The question of which state holds the title of the “poorest” in the United States is more than a simple ranking of numbers; it is a complex intersection of history, industry, education, and geography. In the realm of personal finance and national economics, understanding these disparities is crucial for investors, policymakers, and citizens alike. While the United States remains one of the wealthiest nations globally, the distribution of that wealth is remarkably uneven. To identify the poorest state, we must look beyond surface-level statistics and examine the structural economic factors that keep certain regions in a cycle of financial struggle.

Defining Poverty: How Economic Success is Measured
When economists and financial analysts discuss the “poorest” state, they typically rely on several key metrics provided by the U.S. Census Bureau and the Bureau of Economic Analysis (BEA). Identifying the bottom of the list requires a nuanced understanding of how wealth is generated and tracked at the state level.
Median Household Income vs. Per Capita Income
The most common metric used to rank states is Median Household Income. This figure represents the “middle” income of all households in a state; half the households earn more, and half earn less. It is often considered the most accurate reflection of the financial health of the average family. In contrast, Per Capita Income divides the total income of a state by its population. While useful, per capita figures can be skewed by a small number of ultra-wealthy individuals, making median income a more reliable indicator of general economic prosperity.
The Supplemental Poverty Measure (SPM)
While the official poverty rate is based on cash income thresholds, the Supplemental Poverty Measure (SPM) provides a deeper look. The SPM accounts for non-cash benefits (like SNAP or housing subsidies) and subtracts necessary expenses like taxes and medical costs. Interestingly, when the SPM is applied, states with high costs of living, such as California, often see their poverty rankings rise, while more affordable states may see their “real” poverty levels adjusted downward.
Gross Domestic Product (GDP) by State
State GDP measures the total economic output of a region. A low state GDP often correlates with a lack of industrial diversity or a reliance on declining sectors. Analyzing GDP growth—or the lack thereof—helps explain why certain states remain at the bottom of the financial ladder for decades while others manage to climb.
Identifying the Current Economic Standings
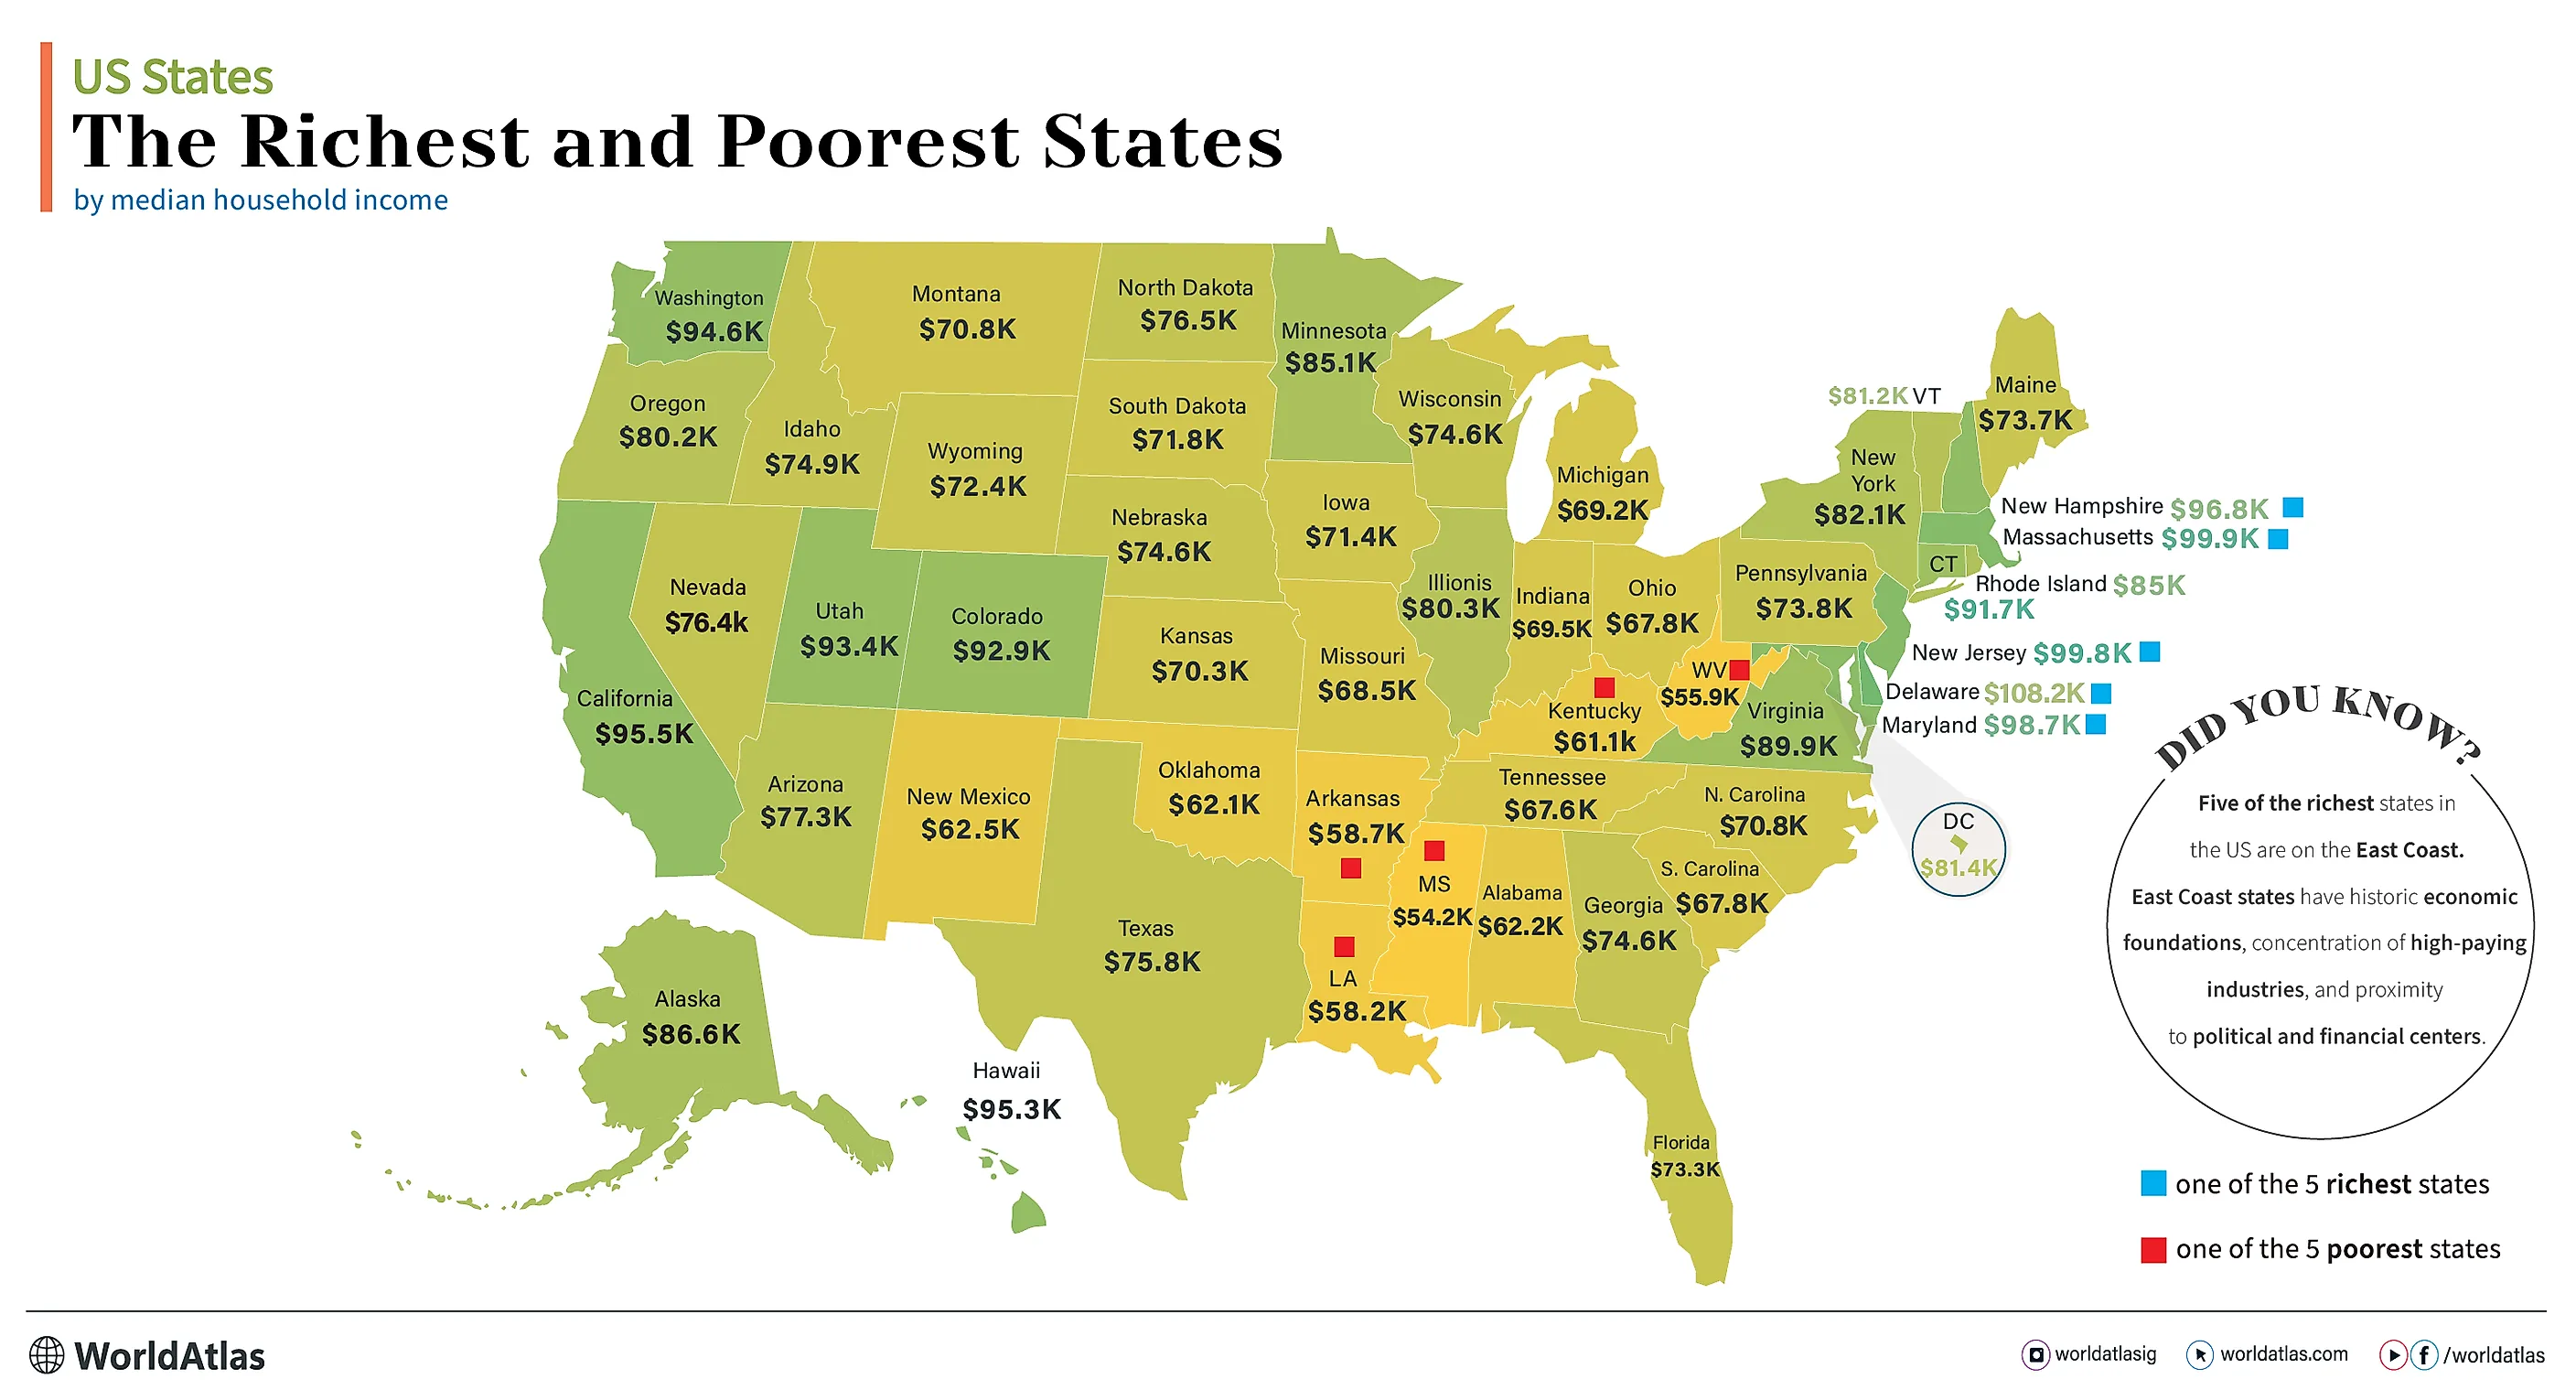
Historically and statistically, the title of the poorest state in America has consistently belonged to Mississippi. However, several other states in the Deep South and Appalachia frequently fluctuate near the bottom of the list.
Mississippi: A Longitudinal Struggle
As of the most recent federal data, Mississippi consistently ranks as the poorest state in the U.S. with the lowest median household income—frequently hovering around $52,000, significantly below the national average of over $74,000. Mississippi’s economic challenges are rooted in a combination of high poverty rates (often exceeding 18-19%) and a lack of high-paying metropolitan hubs. The state’s economy has historically been tied to agriculture, which, while vital, does not generate the same level of wealth as the technology or financial sectors found in wealthier states.
West Virginia and the Decline of Industry
West Virginia often rivals Mississippi for the bottom spots, primarily due to the decline of the coal industry. For a century, coal was the bedrock of the state’s economy. As the world shifts toward renewable energy and natural gas, West Virginia has struggled to transition its workforce. This “industrial monoculture” has led to high unemployment and a low labor force participation rate, which is a key driver of state-level poverty.
Louisiana and Arkansas: Geographic and Sectoral Challenges
Louisiana and Arkansas also consistently rank among the bottom five. In Louisiana, the economy is heavily reliant on the oil and gas industry, making it susceptible to global commodity price fluctuations. Additionally, the state faces significant costs related to natural disasters, which can drain public and private reserves. Arkansas, while seeing growth in corporate hubs like Bentonville (home to Walmart), still grapples with extreme rural poverty that drags down its statewide averages.
Root Causes of Persistent Poverty
Understanding which state is the poorest is less impactful than understanding why it remains so. Poverty is rarely the result of a single factor; rather, it is a “vicious cycle” of interconnected economic disadvantages.
Educational Attainment and Human Capital
In the modern information economy, education is the primary driver of income. States like Mississippi and West Virginia consistently rank lower in terms of the percentage of the population with a bachelor’s degree or higher. Without a highly skilled workforce, these states struggle to attract high-paying industries like tech, biotech, or specialized finance. This creates a “brain drain” effect, where the most educated residents leave the state to seek higher wages elsewhere, further depleting the local tax base and economic potential.
Infrastructure and Connectivity Gaps
Wealth creation in the 21st century requires physical and digital connectivity. Many of the poorest states have significant “digital divides,” where rural areas lack high-speed internet. This prevents the growth of remote work opportunities and hinders small businesses from reaching global markets. Furthermore, crumbling physical infrastructure—roads, bridges, and water systems—increases the cost of doing business, deterring large-scale corporate investment.
The Impact of Industry Monocultures
States that rely on a single industry are economically fragile. When that industry faces a downturn—whether it’s Appalachian coal, Southern textiles, or Delta farming—the entire state’s economy suffers. Wealthier states tend to have diversified economies that can weather sector-specific recessions. The poorest states often lack the venture capital and entrepreneurial ecosystems necessary to pivot into new, more profitable industries.
The Cost of Living Factor: Is Poverty Relative?
From a personal finance perspective, a crucial distinction must be made between “nominal poverty” and “purchasing power.” While residents in Mississippi earn less on average, their expenses are also significantly lower than those in states like New York or Massachusetts.
Real Value of a Dollar in Low-Income States
According to the BEA’s Regional Price Parities, a dollar goes much further in Mississippi or Arkansas than it does in the national average. In these states, the “Real Value of $100” might be closer to $115 or $120. This means that while a household income of $50,000 would be nearly impossible to live on in San Francisco, it can provide a modest, middle-class lifestyle in parts of the South. However, even when adjusting for the cost of living, the poorest states still lag behind in terms of discretionary income and the ability to build long-term wealth.
Housing Affordability and Wealth Accumulation
One of the few advantages in the poorest states is housing affordability. Lower barriers to entry for homeownership can allow families to build equity earlier. However, the downside is that property appreciation in these states is often sluggish. An investment in a home in a stagnant economy does not yield the same “wealth effect” as an investment in a high-growth corridor. For those looking to build significant net worth through real estate, the poorest states offer lower risk but also significantly lower ceilings for returns.
Pathways to Economic Revitalization
While the statistics may seem bleak, the economic landscape is not static. There are clear pathways through which the poorest states can improve their financial standing and the quality of life for their residents.
Diversifying State Economies
The states that have successfully climbed out of the bottom rankings are those that have diversified. For example, some Southern states have aggressively pursued the automotive manufacturing industry, offering tax incentives to companies like BMW, Toyota, and Kia. By shifting from agriculture or low-end manufacturing to high-tech industrial production, these states have created a new middle class and boosted their median incomes.
Policy Interventions and Social Safety Nets
Effective use of federal and state funds can break the cycle of poverty. Investing in early childhood education (Pre-K) has been shown to have the highest return on investment for state economies over the long term. Additionally, expanding access to healthcare through Medicaid and other programs ensures a healthier, more productive workforce. From a business finance perspective, states that offer “business-friendly” environments—balanced with social stability—tend to see the highest levels of foreign direct investment.

The Role of Remote Work and the “Zoom Boom”
The rise of remote work presents a unique opportunity for America’s poorest states. If these regions can invest in high-speed fiber-optic infrastructure, they could attract high-earning professionals who want the low cost of living found in Mississippi or West Virginia while maintaining “coastal” salaries. This influx of capital could revitalize local service economies and provide the tax revenue needed to improve schools and public services.
In conclusion, while Mississippi currently holds the title of the poorest state in America based on median household income, the story of economic disparity is one of nuance. It is a story of industrial shifts, educational gaps, and the relative value of money. For the “Money” conscious observer, these states represent both a cautionary tale of economic stagnation and a frontier of potential for those who can solve the riddle of regional revitalization. Understanding these dynamics is essential for anyone looking to grasp the full picture of the American financial landscape.
aViewFromTheCave is a participant in the Amazon Services LLC Associates Program, an affiliate advertising program designed to provide a means for sites to earn advertising fees by advertising and linking to Amazon.com. Amazon, the Amazon logo, AmazonSupply, and the AmazonSupply logo are trademarks of Amazon.com, Inc. or its affiliates. As an Amazon Associate we earn affiliate commissions from qualifying purchases.