
In the world of personal finance, investing, and economic reporting, numbers are the language of truth. However, that truth is often filtered through different mathematical lenses. When you read a headline stating that the “average” household income has risen, or that the “median” home price in a specific zip code has hit a new high, you are looking at two fundamentally different ways of interpreting wealth.
Understanding the difference between the median and the average (the arithmetic mean) is not just a lesson in middle-school statistics; it is a critical skill for financial literacy. These metrics can change how you negotiate your salary, how you evaluate a potential investment property, and how you perceive your own financial progress relative to the rest of the world. Using the wrong metric can lead to skewed expectations and poor resource allocation. To master your money, you must first master the data that describes it.

Understanding the Fundamentals: The Arithmetic Mean vs. The Middle Ground
Before diving into complex financial strategies, we must establish a clear technical foundation. While both terms are types of “averages” in a broad sense, they serve different purposes in financial analysis.
Defining the Average (The Arithmetic Mean)
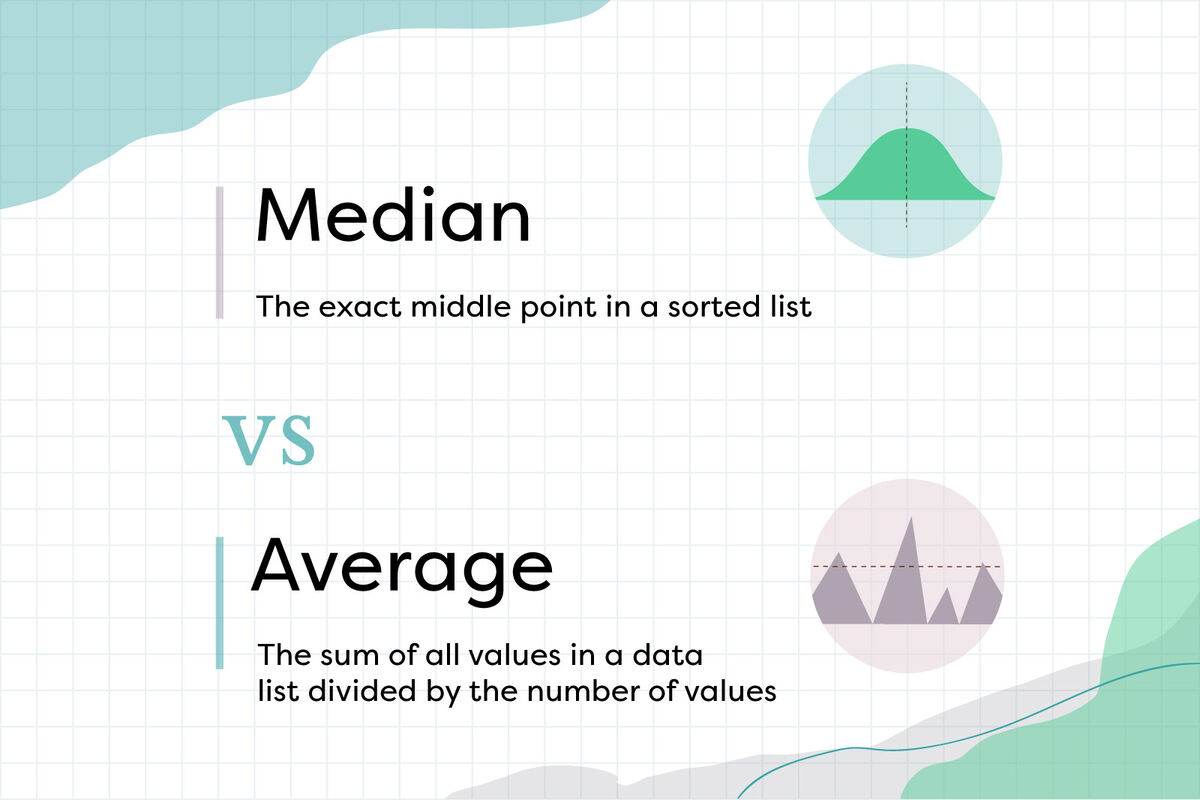
The “average,” formally known as the arithmetic mean, is calculated by adding up all the values in a data set and dividing the sum by the number of values. In the context of money, imagine a group of five investors who have individual portfolios worth $10,000, $15,000, $20,000, $25,000, and $500,000.
To find the average, you add these figures together ($570,000) and divide by five. The average portfolio size is $114,000. While mathematically correct, this number doesn’t accurately describe any of the individuals in the group. The $500,000 “outlier” has pulled the average significantly higher, creating a picture of wealth that doesn’t exist for 80% of the group.
Defining the Median (The True Middle)
The median is the “middle” value in a list of numbers ordered from smallest to largest. If the list has an odd number of entries, the median is the center point. Using our previous example of five investors ($10k, $15k, $20k, $25k, $500k), the median is $20,000.
This figure is often more “representative” of the typical experience because it is not influenced by extreme outliers. In the world of finance, the median tells you what the person at the 50th percentile is doing. It splits the population exactly in half: 50% earn or own more, and 50% earn or own less.
Why the Distinction Matters in Your Wallet
The choice between mean and median determines the “story” the data tells. If a company tells a prospective hire that the “average” bonus is $20,000, but the CEO gets $1 million and most employees get $500, the average is technically true but practically a lie. For the individual investor or earner, relying on the average can lead to “comparison trap” anxiety or, worse, a misunderstanding of market risks. By looking at the median, you gain a clearer picture of what is “normal” or “attainable” for the majority.
Real Estate and Income: Why Averages Can Be Deceptive
Perhaps nowhere is the mean-vs-median debate more relevant than in real estate and labor markets. These are the two primary pillars of personal wealth, and both are prone to massive data skewing.
The “Outlier” Effect in Property Markets
When evaluating a neighborhood for a potential real estate investment or a primary residence, savvy buyers look at the median home price rather than the average. This is because real estate markets are frequently skewed by a few ultra-luxury properties.
Imagine a neighborhood with ten homes. Nine of them are modest bungalows worth $300,000 each. The tenth is a sprawling mansion worth $5 million. The average home price in this neighborhood would be $770,000. If you were an investor looking for a mid-market flip, seeing an “average” of $770,000 might lead you to believe the area is more upscale than it actually is. The median price, however, remains $300,000. The median reflects the reality of the street, while the average reflects the presence of one billionaire.

Evaluating Salary and Household Income
Government agencies like the U.S. Census Bureau almost always report “Median Household Income” because income inequality creates extreme outliers at the top end of the spectrum. If you use the average income to set your personal benchmarks, you may feel perpetually behind.
High-net-worth individuals and C-suite executives pull the “average” income far above what the typical worker earns. For example, if you are looking at salaries for a “Marketing Manager” role in a specific city, the average might be inflated by a few people at global firms making $300,000. The median salary, however, might be $85,000. Knowing the median helps you set a realistic baseline for negotiations, while knowing the average (and the top-tier outliers) helps you understand the ceiling.
Investing and Business Finance: Using Data to Forecast Growth
In the professional world of business finance and portfolio management, these two metrics are used as diagnostic tools. They help analysts identify whether a company’s success is broad-based or dependent on a few high-performing segments.
Portfolio Performance and Skewed Returns
Investors often look at the “average annual return” of the S&P 500, which historically sits around 10%. However, this average is composed of years with 30% gains and years with 20% losses. For a long-term retirement plan, the “average” is a useful aggregate, but the “median” return of various asset classes can tell you more about the probability of hitting your goals.
Furthermore, in venture capital, the “average” return is almost entirely driven by “unicorns”—the one in a hundred companies that goes 100x. If you removed those outliers, the average return of a VC portfolio would be negative. For an individual side-hustle or small business owner, it is often more useful to look at median success rates to gauge the risk of a new venture.
Business Metrics: Average Order Value vs. Median Customer Spend
For those running a business or managing an online store, “Average Order Value” (AOV) is a standard KPI. It tells you how much revenue you generate per transaction. However, AOV can be misleading if a few wholesale buyers are placing massive orders while the general public buys small items.
By tracking the Median Order Value alongside the AOV, a business owner can identify if their growth is healthy. If the AOV is $100 but the Median is $20, it means the business is heavily reliant on a few “whales.” If those whales leave, the business collapses. A healthy, sustainable consumer brand usually likes to see the median and the average moving closer together, indicating a consistent and loyal customer base across the board.
Financial Strategy: When to Use Which Metric
To achieve financial independence, you must know when to ignore the average and when to embrace the median. Strategic financial planning requires a nuanced view of these statistical tools.
Budgeting Based on Typicality
When you are setting a budget for expenses—such as utilities, groceries, or car maintenance—you should look at your own median spending over the last twelve months. We often have “outlier” months, such as December (holiday spending) or a month where the car required a major repair.
If you budget based on your “average” monthly spend, you might over-allocate funds every month just to cover those two or three expensive outliers. By budgeting for the median, you cover your “typical” life, and by setting aside a separate emergency fund, you handle the outliers. This prevents the “average” from making your day-to-day life feel more expensive than it actually is.
Analyzing Market Trends for Long-Term Planning
When is the average actually useful? It is most effective when you want to see the “total weight” of a market. If you are a macro-investor looking at the total wealth of a nation or the total market cap of an industry, the average (mean) tells you the aggregate strength. It factors in every dollar, which is important for understanding total liquidity and economic power.
However, for personal financial planning—deciding where to live, what career to pursue, or how much to save—the median is your best friend. It provides a “reality check” against the noise of the ultra-wealthy. When you see a report about “Average Savings by Age,” take it with a grain of salt. A few millionaires in their 30s can make it look like the “average” 35-year-old has $200,000 in the bank. The median might reveal the number is closer to $20,000. Understanding this keeps your financial goals grounded in reality rather than driven by statistical illusions.
In conclusion, the difference between median and average is the difference between the middle and the sum. In the pursuit of wealth and financial stability, being able to distinguish between the two allows you to read between the lines of financial news, negotiate better contracts, and build a more resilient investment strategy. Numbers don’t lie, but they do have different ways of telling the truth. Choose the metric that fits your financial goals, and you will never be misled by a skewed data set again.
aViewFromTheCave is a participant in the Amazon Services LLC Associates Program, an affiliate advertising program designed to provide a means for sites to earn advertising fees by advertising and linking to Amazon.com. Amazon, the Amazon logo, AmazonSupply, and the AmazonSupply logo are trademarks of Amazon.com, Inc. or its affiliates. As an Amazon Associate we earn affiliate commissions from qualifying purchases.