
In the vast landscape of modern data management, SQL reporting stands as a pivotal process, transforming raw database information into actionable insights. It serves as the bridge between complex data structures and the easily digestible reports that drive business decisions, monitor performance, and inform strategic planning across virtually every industry. At its core, SQL reporting leverages the power of Structured Query Language (SQL) to extract, manipulate, and present data from relational databases in a meaningful format.
The Foundation: Understanding SQL and Relational Databases
To truly grasp SQL reporting, it’s essential to first understand its foundational components: SQL itself and the relational databases it interacts with.
SQL: The Language of Data
Structured Query Language (SQL) is a specialized programming language designed for managing data held in a relational database management system (RDBMS), or for stream processing in a relational data stream management system (RDSMS). It is the standard language for relational database systems and is used to perform various operations such as creating database objects (tables, views, stored procedures), inserting data, updating existing data, deleting data, and, most importantly for reporting, querying data. Its declarative nature allows users to specify what data they want, rather than how to get it, making it incredibly powerful for data retrieval and manipulation. Mastering SQL enables data professionals to precisely target the information needed for any report, filtering out irrelevant noise and focusing on key metrics.
Relational Databases: The Data Repository
Relational databases organize data into one or more tables (or “relations”) of rows and columns, with a unique key identifying each row. This structure allows for highly efficient storage and retrieval of related data, as relationships between different data entities (e.g., customers and their orders, products and their suppliers) can be explicitly defined. Popular RDBMS platforms include MySQL, PostgreSQL, Oracle Database, SQL Server, and SQLite. These databases are the backbone of countless applications, storing everything from transaction records and customer information to inventory levels and website analytics. SQL reporting directly queries these systems, drawing data from multiple interconnected tables to compile comprehensive views. The integrity and organization of data within these relational structures are paramount for accurate and reliable reports.
Why Data Matters in Business
In today’s digital economy, data is often referred to as the new oil. It is an invaluable asset that, when properly analyzed and understood, can provide profound competitive advantages. Businesses collect vast amounts of data daily from various sources: sales transactions, customer interactions, marketing campaigns, operational processes, and more. Without a systematic way to process and interpret this data, it remains dormant potential. SQL reporting is precisely that systematic approach, transforming raw data points into coherent narratives that reveal trends, highlight opportunities, expose inefficiencies, and measure performance against strategic goals. It empowers stakeholders to move beyond guesswork, making data-driven decisions that are more informed and strategically sound.
Defining SQL Reporting: Purpose and Core Concepts
SQL reporting is more than just executing a simple SELECT statement; it’s a comprehensive process designed to extract, transform, and present data in a structured, user-friendly format.
Beyond Simple Queries: The Reporting Layer
While an individual SQL query can retrieve specific data, SQL reporting involves a more sophisticated layering of queries and logic to construct complete, multi-faceted reports. This often means combining data from numerous tables, applying complex aggregations (like sums, averages, counts), implementing intricate filtering rules, and performing calculations to derive new metrics. The reporting layer encapsulates these complex SQL operations, often packaging them into stored procedures, views, or functions within the database itself, or integrating them into dedicated reporting tools. This abstraction simplifies the process for end-users, allowing them to access pre-defined reports without needing deep SQL knowledge, while ensuring data consistency and accuracy across reports.
Key Objectives of SQL Reporting
The primary objectives of SQL reporting are manifold:
- Performance Monitoring: Tracking key performance indicators (KPIs) such as sales figures, customer acquisition rates, website traffic, and operational efficiency metrics.
- Strategic Decision-Making: Providing insights that guide long-term business strategy, market positioning, and investment decisions.
- Operational Management: Supporting day-to-day operations by flagging anomalies, managing inventory, scheduling resources, and tracking project progress.
- Compliance and Auditing: Generating reports necessary for regulatory compliance, internal audits, and financial disclosures.
- Problem Identification and Resolution: Pinpointing areas of inefficiency, bottlenecks, or underperformance, enabling timely intervention.
- Trend Analysis and Forecasting: Identifying historical patterns and projecting future outcomes, helping businesses anticipate changes and plan accordingly.
The Role of Data Transformation and Aggregation
A critical aspect of SQL reporting is the transformation and aggregation of raw data. Raw data from transactional systems is often too granular for direct reporting. For example, individual sales transactions might need to be aggregated by day, week, or month to show sales trends. Customer data might need to be grouped by region or demographic. Data transformation involves cleaning, enriching, and restructuring data (e.g., converting data types, handling missing values, standardizing formats). Aggregation involves summarizing data from many rows into a single summary row (e.g., SUM, AVG, COUNT, MAX, MIN). These steps are typically performed using SQL queries with functions like GROUP BY, JOIN, and various aggregate functions, which are fundamental to turning disparate data points into meaningful summary statistics and actionable insights.
The Technical Workflow of SQL Reporting
The process of generating a SQL report typically follows a well-defined technical workflow, moving from data source to final presentation.
Data Extraction: SELECT Statements and Beyond
The first step in SQL reporting is data extraction. This is primarily achieved using the SQL SELECT statement. This statement allows you to specify which columns you want to retrieve from which tables. More complex extractions involve using WHERE clauses to filter rows based on specific conditions (e.g., sales from the last quarter), JOIN clauses to combine data from multiple related tables (e.g., customer details with their order history), and ORDER BY clauses to sort the results. For highly complex reports, stored procedures—pre-compiled SQL code blocks stored in the database—can be used to encapsulate sophisticated extraction logic, parameterizing inputs for dynamic reporting.
Data Manipulation: Filtering, Sorting, and Joining
Once data is extracted, it often needs further manipulation to fit the reporting requirements.
- Filtering:
WHEREclauses are crucial for narrowing down the dataset to only include relevant records. For instance, a sales report might only focus on completed orders or products within a specific category. - Sorting:
ORDER BYclauses arrange the report data in a logical sequence, such as by date, alphabetical order, or by sales volume, making it easier to read and analyze. - Joining:
JOINoperations (INNER JOIN, LEFT JOIN, RIGHT JOIN, FULL JOIN) are fundamental for combining data from different tables based on related columns. This is how you connect a customer’s name (from aCustomerstable) to their purchases (from anOrderstable) and the details of those purchases (from anOrder_Itemstable). Without effective joining, comprehensive reports spanning multiple data entities would be impossible.
Output and Visualization: From Raw Data to Insights
After extraction and manipulation, the prepared data needs to be outputted and often visualized. The raw output of a SQL query is typically a tabular dataset. While this can be viewed directly by data professionals, business users often require a more digestible format. This is where reporting tools come into play. These tools take the results of SQL queries and render them into various visual formats:
- Tabular Reports: Simple lists or tables of data.
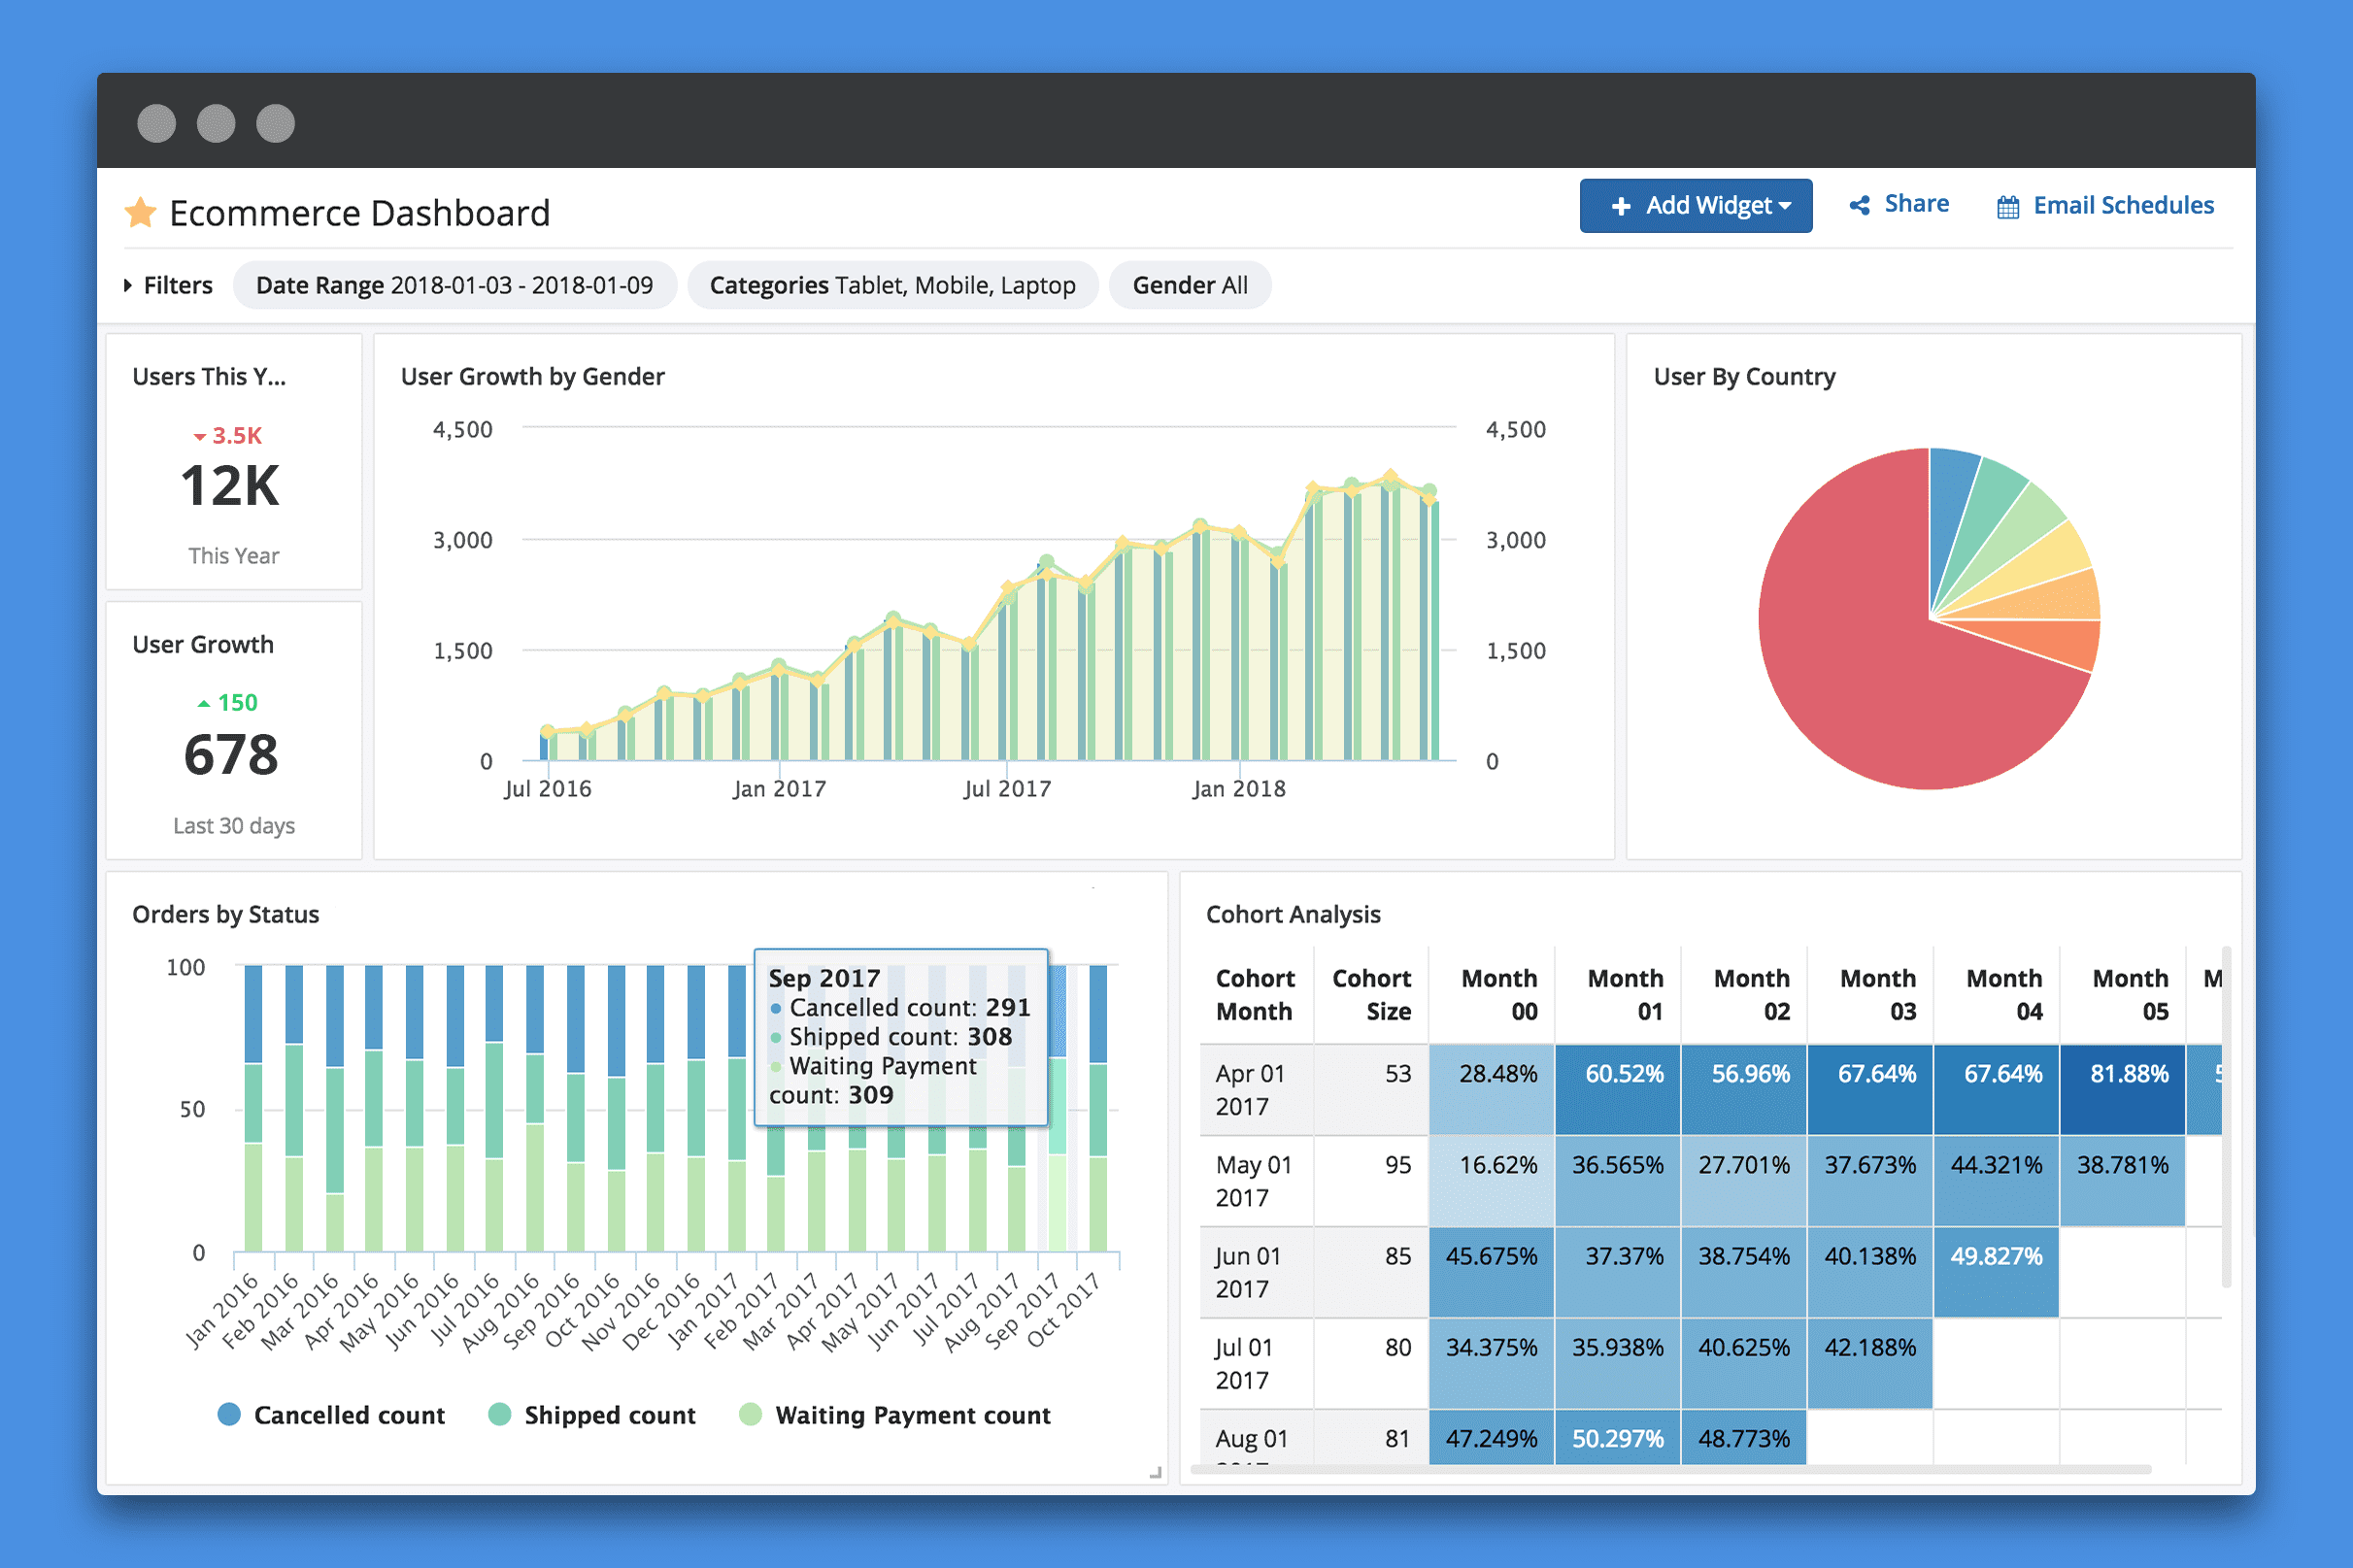
- Charts and Graphs: Bar charts, line graphs, pie charts, scatter plots to visualize trends, comparisons, and distributions.
- Dashboards: Interactive interfaces combining multiple charts and data summaries, providing a holistic view of performance.
- PDFs and Spreadsheets: Static reports for distribution or further analysis.
The goal is to translate complex datasets into clear, intuitive visual representations that highlight key findings and facilitate quick comprehension.
Common Tools and Platforms for SQL Reporting
A variety of software tools and platforms are used for SQL reporting, ranging from basic database clients to sophisticated business intelligence (BI) suites:
- Database Management Tools: SQL Server Management Studio (SSMS), DBeaver, pgAdmin, MySQL Workbench allow direct query execution and basic result viewing.
- Programming Languages: Python with libraries like Pandas, SQLAlchemy, and Matplotlib/Seaborn, or R with packages like dplyr and ggplot2, enable highly customizable data extraction, transformation, and visualization.
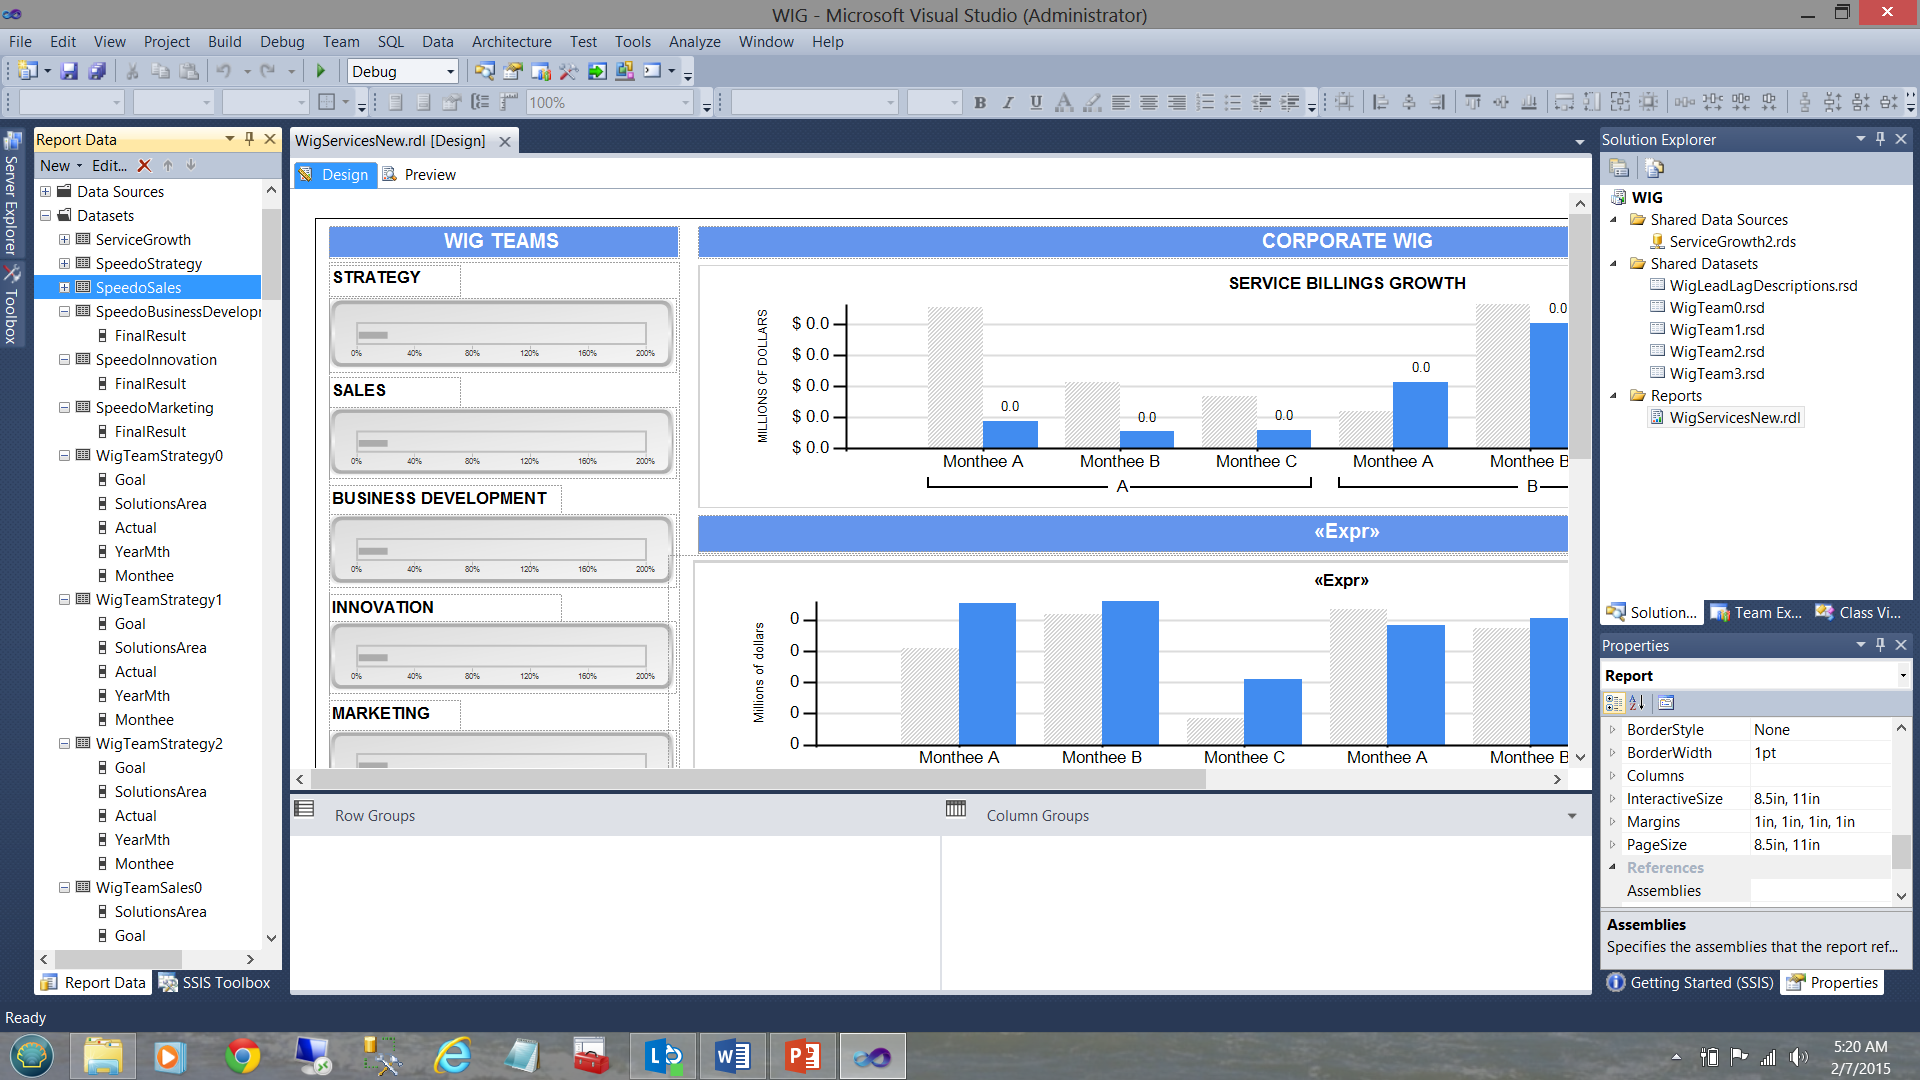
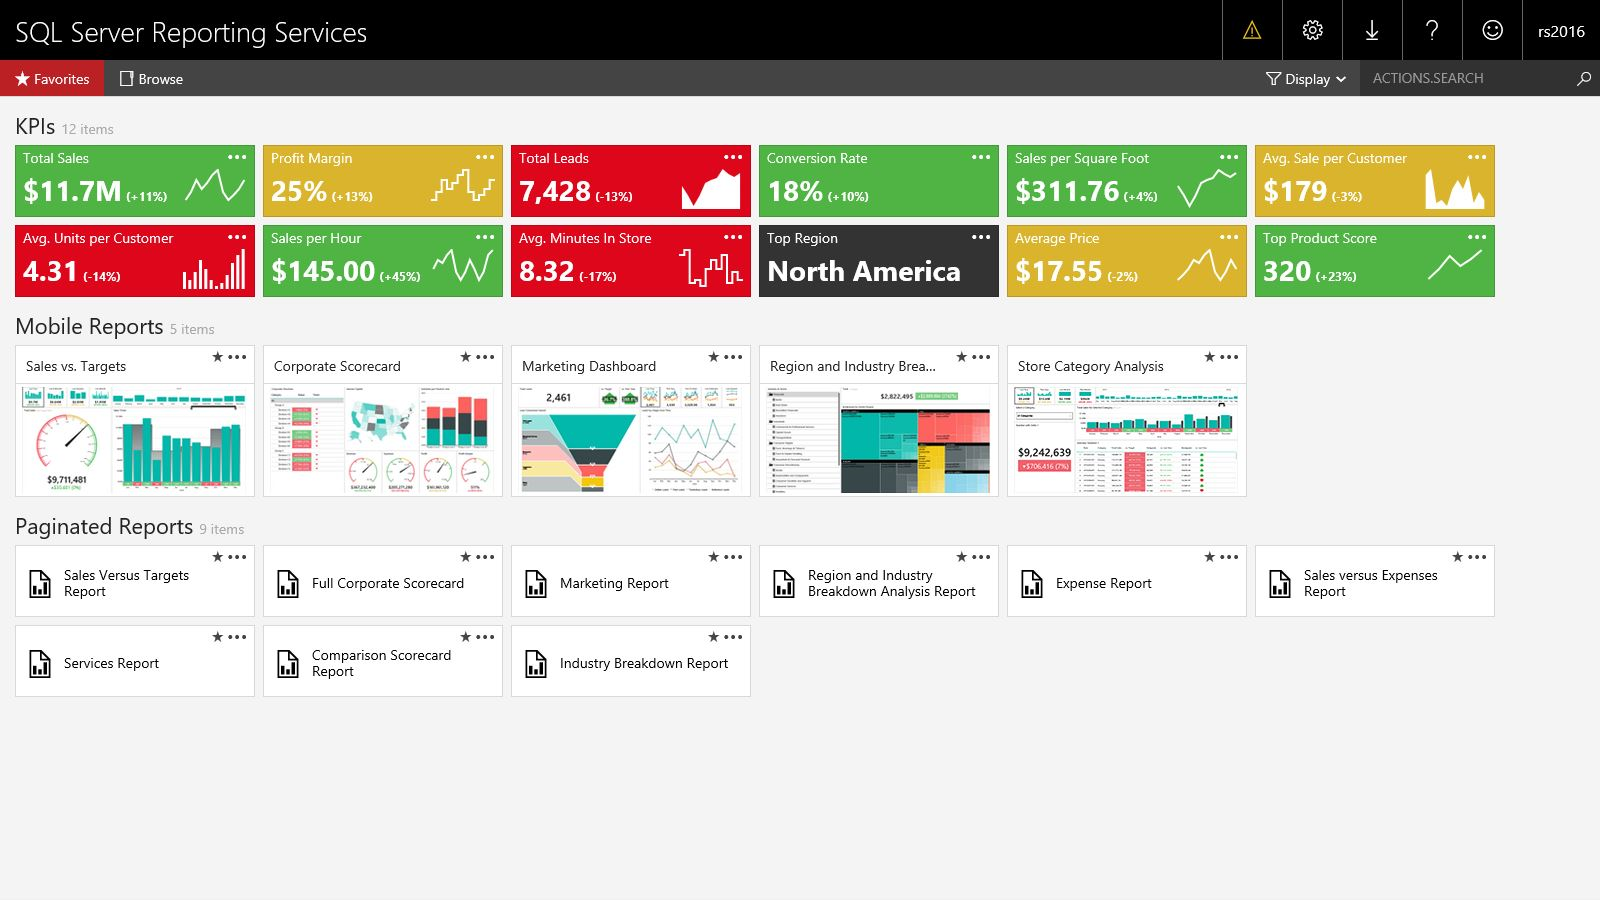
- Reporting Services: SQL Server Reporting Services (SSRS) is a traditional server-based reporting platform for creating, deploying, and managing paginated and mobile reports.
- Business Intelligence (BI) Platforms: Tools like Tableau, Power BI, Looker (Google Data Studio), and Qlik Sense offer robust capabilities for connecting to SQL databases, building interactive dashboards, and performing advanced analytics on top of SQL queries.
- ETL Tools: Tools like Informatica, SSIS (SQL Server Integration Services), or Apache Nifi are used for more complex Extract, Transform, Load processes that prepare data specifically for reporting data warehouses.
Key Benefits and Strategic Impact for Businesses
Implementing effective SQL reporting brings a multitude of benefits that extend across an organization’s operations and strategic planning.
Driving Informed Decision-Making
Perhaps the most significant benefit of SQL reporting is its ability to empower businesses with data-driven decision-making. By providing accurate, timely, and relevant information, SQL reports enable leaders to understand current performance, identify emerging trends, and assess the potential impact of various strategies. Whether it’s optimizing marketing spend based on campaign ROI reports, adjusting inventory levels using sales forecasts, or improving customer service based on feedback analysis, SQL reporting provides the factual basis required for confident and effective decision-making, moving away from intuition-based choices.
Enhancing Operational Efficiency
SQL reporting can drastically improve operational efficiency by shining a light on processes, resource utilization, and potential bottlenecks. Reports on manufacturing output, supply chain logistics, employee productivity, or system performance can help managers identify inefficiencies and areas for improvement. For instance, an inventory report might highlight slow-moving items, prompting a clearance sale, while a production report could pinpoint equipment downtime, leading to proactive maintenance. By continuously monitoring operational KPIs, businesses can streamline workflows, reduce waste, and optimize resource allocation.
Ensuring Data Accuracy and Consistency
When SQL reporting is properly implemented, it establishes a single source of truth for an organization’s data. By defining standard queries and data transformation rules, businesses ensure that everyone is looking at the same metrics, derived from the same underlying data, using the same calculations. This consistency is vital for internal alignment and external credibility. Robust SQL reporting architectures often involve data warehousing and data governance practices, further enhancing data quality, accuracy, and reliability, thereby building trust in the insights generated.
Key Considerations for Effective SQL Reporting
To maximize the value of SQL reporting, several key considerations should be kept in mind:
- Data Quality: Reports are only as good as the data they are based on. Ensuring clean, accurate, and complete data at the source is paramount.
- Performance Optimization: Complex SQL queries can be slow. Proper indexing, query optimization, and potentially denormalization or data warehousing strategies are essential for fast report generation.
- Security and Access Control: Sensitive data must be protected. Implementing robust security measures and granular access control ensures that only authorized personnel can view specific reports or underlying data.
- Scalability: As data volumes grow, the reporting infrastructure must be able to scale to handle increased demands without sacrificing performance.
- User Experience: Reports should be designed with the end-user in mind—intuitive, easy to understand, and visually engaging to encourage adoption and utilization.
- Automation: Automating report generation and distribution saves time and ensures that stakeholders receive timely updates without manual intervention.
The Evolving Landscape of SQL Reporting
The field of data and reporting is constantly evolving. While SQL remains the bedrock, SQL reporting is increasingly integrating with newer technologies.
Integration with Advanced Analytics and AI
Modern SQL reporting often forms the data foundation for more advanced analytics and artificial intelligence (AI) applications. The structured data prepared through SQL queries can feed machine learning models for predictive analytics (e.g., sales forecasting, customer churn prediction) or prescriptive analytics (recommending actions). Reporting tools themselves are incorporating AI capabilities, such as natural language querying, automated anomaly detection, and intelligent data storytelling, to make insights even more accessible and powerful.
Cloud-Native Solutions and Scalability
The shift to cloud computing has profoundly impacted SQL reporting. Cloud-native databases (like Amazon RDS, Azure SQL Database, Google Cloud SQL) and cloud data warehouses (like Snowflake, Amazon Redshift, Google BigQuery) offer unparalleled scalability, flexibility, and managed services. This allows organizations to process massive datasets and generate reports with greater agility and cost-efficiency. Cloud-based reporting tools also facilitate collaboration and ubiquitous access, making insights available to distributed teams regardless of their location. The future of SQL reporting is undoubtedly intertwined with these cloud infrastructures, enabling even more sophisticated and ubiquitous data intelligence.
aViewFromTheCave is a participant in the Amazon Services LLC Associates Program, an affiliate advertising program designed to provide a means for sites to earn advertising fees by advertising and linking to Amazon.com. Amazon, the Amazon logo, AmazonSupply, and the AmazonSupply logo are trademarks of Amazon.com, Inc. or its affiliates. As an Amazon Associate we earn affiliate commissions from qualifying purchases.