
In the dynamic landscape of modern data analysis and collaborative work, Microsoft Excel remains an indispensable tool. Its ability to process, analyze, and visualize vast datasets makes it a cornerstone for businesses, analysts, and students alike. However, for years, one persistent challenge plagued teams working concurrently on the same Excel workbook: the inability to maintain individual perspectives without disrupting others. This common friction point often led to a frustrating dance of “who touched the filter?” or “my sort disappeared!” Microsoft’s innovative solution to this very problem is Sheet View, a powerful feature designed to revolutionize collaborative data interaction.

At its core, Sheet View in Excel allows multiple users to apply different sorts and filters to a shared worksheet without affecting what other users see. Imagine a central spreadsheet containing sales data for an entire quarter. One team member might need to sort by “highest revenue” to identify top performers, while another concurrently needs to filter by “region: North America” to analyze regional trends, and a third might be sorting by “date” to review a timeline. Before Sheet View, applying one of these actions would immediately change the view for everyone else, leading to constant communication overhead and the tedious process of re-applying preferred views. Sheet View liberates users from this constraint, providing a personalized, ephemeral, and non-disruptive workspace within a shared document, thus elevating Excel from a merely functional spreadsheet to a truly collaborative data platform. It’s a fundamental shift in how teams can interact with data simultaneously, ensuring individual productivity without sacrificing collective insight.
Understanding the Core Concept of Sheet View
To fully appreciate the utility of Sheet View, it’s essential to grasp the problem it solves and how it fundamentally alters the user experience in a shared Excel environment. This feature isn’t just a minor tweak; it’s a strategic enhancement that addresses long-standing pain points in collaborative data management.
The Problem It Solves: Collaborative Chaos
Historically, when multiple users accessed and edited a shared Excel workbook, any change to the sheet’s display — such as applying a filter, sorting data, or even adjusting column widths — would immediately propagate to all other active users. This “one view for all” paradigm often resulted in significant workflow disruptions:
- Filter Wars: User A applies a filter to see only “completed tasks,” while User B applies a different filter to see “overdue tasks.” Both users constantly overwrite each other’s filters, leading to frustration and wasted time.
- Sort Conflicts: An analyst sorts data by “highest profit” for their report, only to find the data resorted by “product ID” by a colleague moments later.
- Visual Disruption: Adjusting column widths or hiding rows for a specific presentation could inadvertently affect how another user is working on the same sheet, forcing them to constantly revert changes.
- Communication Overhead: Teams would often resort to complex coordination, like “Don’t touch the filters while I’m working on this,” or creating multiple copies of the same sheet, which inevitably led to version control nightmares.
This constant back-and-forth eroded productivity, fostered inefficiency, and often necessitated the creation of individual copies of workbooks, thereby defeating the purpose of shared access and leading to data fragmentation. Sheet View directly confronts this collaborative chaos, providing a dedicated and isolated visual layer for each user.
Beyond Simple Filtering: A Personalized Workspace
Sheet View goes beyond merely isolating filters and sorts; it creates a truly personalized workspace within a single, shared sheet. While filters and sorts are the most common applications, the principle extends to any temporary display adjustment that doesn’t alter the underlying data. This means each user can:
- Apply unique filters: One person can filter for “sales in Q1” while another filters for “sales by region.”
- Implement distinct sort orders: One might sort by “revenue descending,” another by “date ascending.”
- Hide or unhide specific rows/columns: A user can hide irrelevant columns to focus on key data points without affecting their colleagues’ view of the full dataset.
- Adjust column widths and row heights: Optimize the layout for personal viewing preferences or reporting needs without imposing those changes on others.
Crucially, Sheet View does not create a separate copy of the data. All users are still interacting with the same live dataset, ensuring data consistency and real-time updates. What changes is merely the presentation of that data on their individual screens. This distinction is vital: it promotes collaboration on a single source of truth while empowering individual analytical exploration, marking a significant leap forward in Excel’s collaborative capabilities.
How Sheet View Transforms Collaborative Workflows
The introduction of Sheet View marks a paradigm shift in how teams interact with shared Excel workbooks. It moves beyond basic file sharing to enable sophisticated, simultaneous data exploration without friction. This capability profoundly enhances efficiency, reduces errors, and fosters a more cooperative environment.
Maintaining Individual Focus in Shared Workbooks
In complex projects involving large datasets, different team members often have distinct analytical objectives. A marketing specialist might be analyzing customer demographics, while a finance analyst is scrutinizing budget allocations, all within the same master spreadsheet. Before Sheet View, their differing needs for filtering, sorting, or even hiding columns would inevitably clash.
Sheet View eliminates this conflict by allowing each user to create and activate their own personalized view. This means the marketing specialist can apply filters to isolate specific customer segments and sort data by acquisition channel, completely undisturbed by the finance analyst, who might be filtering by department and sorting by expense category. Each individual can maintain their unique focus, delve deep into their specific area of responsibility, and perform their analysis without the constant need to reset or re-apply their preferred view, leading to uninterrupted concentration and greater analytical depth.
Eliminating Conflicts: Filters, Sorts, and Row/Column Adjustments
The most immediate and impactful benefit of Sheet View is its ability to prevent the “filter wars” and “sort clashes” that plagued shared workbooks. When a user creates a Sheet View, any filters, sorts, or temporary display adjustments made within that view are isolated to their session. These changes are saved within the Sheet View, not to the main worksheet, ensuring that other users’ experiences remain unaffected.
- Filter Independence: Multiple users can apply different filters simultaneously on the same data range. User A sees data filtered by ‘Region: East’, while User B sees ‘Product Category: Electronics’, and User C sees ‘Sales Status: Pending’. All happen concurrently, without overwriting each other.
- Sort Autonomy: One user sorts by ‘Date Created (newest to oldest)’, another by ‘Priority (highest to lowest)’, and yet another by ‘Alphabetical Order of Customer Name’. Each user’s data remains sorted according to their active Sheet View.
- Visual Personalization: The ability to hide irrelevant rows/columns, adjust column widths, or even temporarily freeze panes (in their own view) allows users to tailor the visual presentation to their immediate needs, without affecting the layout for others. This eliminates the annoyance of constantly re-adjusting views or explaining why a specific column is hidden.
This isolation of display settings dramatically reduces communication overhead, minimizes errors stemming from incorrect data views, and allows teams to work more harmoniously on a single source of truth.
Streamlining Data Analysis for Multiple Users
Beyond merely preventing conflicts, Sheet View actively streamlines data analysis for multiple users. Consider a scenario where a team is preparing a quarterly report. Different sections of the report require different views of the same underlying data.
- A sales manager needs to identify top-performing regions. They create a Sheet View called “Top Regions” with relevant filters and sorts.
- A product manager needs to analyze product-specific performance. They create a Sheet View called “Product X Analysis” with filters for their product line.
- A finance lead needs to consolidate revenue figures. They use the “Default” view or create their own for aggregation.
These pre-defined Sheet Views act as bookmarks or saved perspectives. Users can quickly switch between them, applying complex filters and sorts with a single click, rather than manually re-applying each parameter every time they switch focus. This significantly cuts down on the time spent on data manipulation and increases the time available for actual analysis and insight generation. By providing a structured way to manage diverse analytical perspectives, Sheet View transforms a single Excel file into a multi-faceted analytical tool for an entire team.
Practical Implementation: Getting Started with Sheet View
Implementing Sheet View in your collaborative workflow is straightforward, designed to be intuitive for regular Excel users. Understanding the basic steps for creation, activation, management, and sharing is key to leveraging its full potential.
Creating a New Sheet View
Creating a Sheet View is an uncomplicated process that can be initiated in a couple of ways:
-
From the “View” Tab:
- Open your shared Excel workbook.
- Navigate to the View tab in the Excel ribbon.
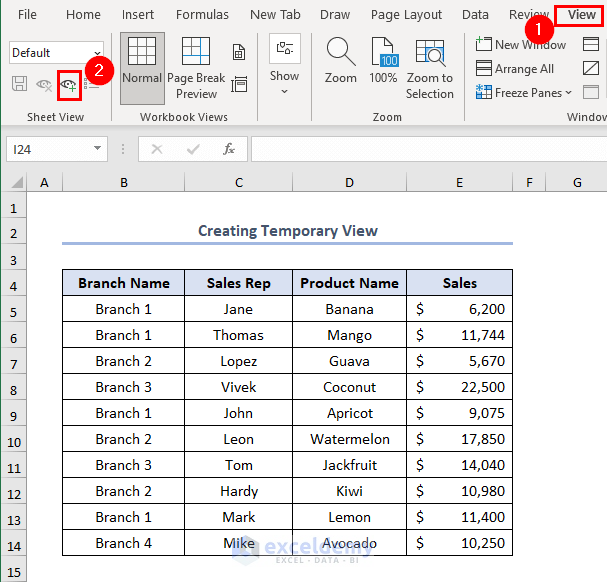
- In the “Sheet View” group, click on New.
- Excel will immediately switch to a new, temporary Sheet View, indicated by “SheetView1” (or similar) in a grey bar at the top of the worksheet, along with an “Exit” button.
- Now, apply any filters, sorts, or other display changes you desire (e.g., sort column A, filter column B).
- Once you’re satisfied with your view, click on the Keep button in the Sheet View bar or go back to the View tab, click the Sheet View dropdown, and select Rename. Give your view a descriptive name (e.g., “My Sales by Region,” “Q4 Performance Review”).
-
From an Existing Filter/Sort:
- If you’ve already applied filters or sorts to a shared sheet and want to save that specific arrangement as a Sheet View, simply go to the View tab.
- Click on Sheet View dropdown, and then select New. Excel will automatically create a new Sheet View reflecting your current filters/sorts.
- Rename it immediately using the Rename option in the dropdown to avoid generic names.
Once saved, your Sheet View is tied to that specific worksheet within the workbook and will be available for you and others (if the workbook is shared) to access.

Activating and Switching Between Views
Once you have created multiple Sheet Views, switching between them is incredibly simple, mimicking how you might switch between different custom views in other software.
- Go to the View tab.
- In the “Sheet View” group, click on the dropdown menu labeled with the currently active Sheet View (e.g., “Default,” or the name of a custom view).
- A list of all available Sheet Views for that worksheet will appear. Select the desired view from the list. The worksheet will instantly update to display the data according to the selected view’s filters, sorts, and display settings.
- To exit a Sheet View and return to the main, unsorted/unfiltered “Default” view, simply select “Default” from the dropdown list. You can also click the “Exit” button in the grey Sheet View bar if you are currently in a custom Sheet View.
This quick switching capability is what truly streamlines the analytical process, allowing users to jump between different perspectives with minimal effort.
Managing and Deleting Views
Over time, you might create several Sheet Views, some of which may become redundant. Managing them ensures your list remains clean and relevant.
- To Rename a Sheet View: Select the view from the dropdown on the View tab, then click the Sheet View dropdown again and choose Rename. Type in the new name.
- To Duplicate a Sheet View: While in an existing Sheet View, simply click New again. This will create a copy of the current view, which you can then rename and modify. This is useful for building variations on an existing view.
- To Delete a Sheet View: Ensure you are not currently in the Sheet View you wish to delete (e.g., switch to “Default” or another view). Then, go to the View tab, click the Sheet View dropdown, and select Manage Sheet Views. A task pane will appear on the right side of Excel, listing all Sheet Views for that sheet. Select the view you want to delete and click the trash can icon. This action cannot be undone.
Sharing Your Custom Views (and When Not To)
Sheet Views are inherently designed for shared workbooks. When you create a Sheet View in a workbook that is saved to a cloud location like OneDrive or SharePoint and shared with others, those Sheet Views become accessible to everyone with edit permissions.
- Accessibility: Other users can see and activate your named Sheet Views from their “Sheet View” dropdown. They can then interact with the data according to your saved perspective.
- No Editing Rights: While others can use your Sheet Views, they cannot edit your specific view. If they apply new filters or sorts while in your view, those changes will create a temporary personal view that they would need to save as a new Sheet View if they wanted to keep it. This ensures the integrity of your original view.
- When Not To Share: While Sheet Views are shared, consider naming conventions. If a view is highly personalized for your specific, temporary analysis and won’t be useful to others, you might name it “My Temp Analysis” or delete it once done to keep the list clean for the team. Ensure names are clear and descriptive for views intended for collaborative use.
Advanced Tips and Best Practices for Maximizing Sheet View
While the basic functionality of Sheet View is straightforward, integrating it effectively into advanced workflows and team processes requires a strategic approach. Maximizing its potential involves understanding how it interacts with other Excel features and fostering a collaborative culture.
Combining Sheet Views with Other Excel Features (e.g., Tables, Named Ranges)
Sheet View truly shines when combined with other robust Excel features, amplifying their individual power within a collaborative context:
- Excel Tables: Always convert your data range into an Excel Table (Insert > Table). Excel Tables are inherently designed for structured data and automatically provide filter and sort dropdowns. When you create a Sheet View with filters applied to an Excel Table, the experience is seamless. Furthermore, features like “Slicers” for Tables are visible to all users, but the resulting filtered view from Slicers can be saved within a Sheet View.
- Named Ranges: While Sheet View primarily deals with visual presentation, using Named Ranges (Formulas > Define Name) for key data areas can make formula creation and navigation easier, regardless of the active Sheet View. This helps maintain consistent reference points even when the visible data changes.
- Conditional Formatting: Conditional formatting (Home > Conditional Formatting) applied to the underlying data will persist across all Sheet Views, providing a consistent visual emphasis on data points, regardless of individual filters or sorts. This allows teams to highlight critical information universally, while individual users can then filter to focus on those highlighted items within their private view.
- PivotTables/PivotCharts: Sheet Views do not directly interact with PivotTable filters or layouts, as PivotTables are separate, interactive reports. However, you could have a sheet containing source data, and another sheet containing a PivotTable. Users could use Sheet View on the source data sheet, and independently interact with the PivotTable’s filters on its own sheet.
By leveraging these features in conjunction with Sheet View, you create a more powerful, structured, and user-friendly collaborative environment.
Educating Your Team: Fostering a Collaborative Culture
The success of Sheet View, like any collaborative tool, hinges on user adoption and understanding. Simply rolling it out without proper communication can lead to confusion.
- Introduction and Demonstration: Conduct a brief team meeting or share a quick video demonstrating what Sheet View is, why it’s beneficial, and how to create/use one. Highlight how it solves previous “filter wars.”
- Clear Naming Conventions: Encourage teams to use descriptive and consistent naming conventions for Sheet Views (e.g., “JaneSalesQ1,” “MarketingLeadsEurope,” “FinanceExpensesApproved”). This makes views easy to identify and use by everyone.
- Best Practices Guide: Create a simple internal guide that outlines when to use Sheet View, how to manage them, and perhaps even some scenarios where it might not be the best solution (e.g., if fundamental data changes are needed, not just display changes).
- Encourage Experimentation: Create a safe space for team members to experiment with Sheet Views without fear of breaking anything. The beauty of Sheet View is its non-destructive nature.
Fostering an environment where team members feel empowered to use these tools effectively is crucial for maximizing their impact on productivity and collaboration.
When to Use Sheet View vs. Separate Worksheets
It’s important to understand the boundary between a Sheet View and a completely separate worksheet. While Sheet View is powerful, it’s not a panacea for all collaborative needs.
- Use Sheet View When:
- Multiple users need different views (filters, sorts, display settings) of the same underlying dataset.
- The goal is to maintain a single source of truth for the data, with real-time updates for everyone.
- The changes are temporary visual adjustments, not modifications to the core data structure or content.
- You want to avoid creating multiple, potentially outdated copies of the same data.
- Use Separate Worksheets When:
- Users need to work on fundamentally different subsets or transformations of the data that require distinct calculations, formulas, or layouts.
- Different users require their own editable copies of data, where their changes are isolated from others (e.g., individual budget forecasts).
- The structure of the data itself needs to be different (e.g., one sheet for raw data, another for a summary report, another for specific charts).
- You need to archive specific states of the data that shouldn’t change even if the source data updates.
Sheet View is about managing perspectives on data, not fundamentally altering or duplicating data. Recognizing this distinction is key to applying the right tool for the right collaborative challenge.
The Future of Collaboration in Excel: Why Sheet View Matters
Microsoft Excel has always been a powerful individual productivity tool, but its evolution towards cloud-based collaboration has fundamentally reshaped its role in the modern workplace. Sheet View is not just an incremental feature; it represents a significant stride in this collaborative journey, cementing Excel’s position as a robust platform for shared data analysis.
Enhancing Productivity and Reducing Errors
The primary value proposition of Sheet View lies in its ability to simultaneously enhance individual productivity and significantly reduce collaborative errors. By eliminating the constant need to re-apply filters and sorts, users save valuable time that was previously wasted on tedious data manipulation. This saved time can be redirected towards deeper analysis, critical thinking, and more impactful decision-making.
Furthermore, by preventing “filter clashes,” Sheet View ensures that each user is consistently viewing the data relevant to their task, minimizing the risk of misinterpreting information or making decisions based on an incorrect dataset. This reduction in errors is particularly crucial in fields like finance, research, and project management, where accuracy is paramount. In essence, Sheet View allows teams to work smarter, not harder, fostering an environment where focus, accuracy, and efficiency are the norm.
A Key Feature for Modern Distributed Teams
The rise of remote work and globally distributed teams has placed unprecedented demands on collaborative software. Tools must enable seamless interaction, regardless of geographic location or time zone. Sheet View perfectly addresses this need. It allows team members scattered across different offices or even continents to simultaneously engage with the same live dataset, each seeing it through their own customized lens, without interfering with others.
This capability is vital for:
- Real-time Project Dashboards: Project managers and team leads can monitor progress with their preferred filters (e.g., “Overdue Tasks”), while individual contributors focus on their specific tasks (e.g., “My Tasks Due This Week”) on the same master tracking sheet.
- Financial Reporting and Audits: Finance teams can simultaneously review different aspects of a budget or financial statement, each applying their own audits and checks, contributing to a quicker and more comprehensive review process.
- Sales Performance Analysis: Regional sales managers can filter by their territory, while product managers filter by their product line, all working on the same master sales data, leading to a unified yet personalized understanding of performance.
Sheet View is more than just a convenience; it’s an enabler of truly effective synchronous and asynchronous collaboration. It transforms Excel from a potentially chaotic shared document into an organized, multi-perspective analytical hub, making it an indispensable asset for any modern team striving for agility and data-driven success in today’s distributed work environment. As Microsoft continues to evolve its suite of cloud-connected tools, Sheet View stands out as a testament to their commitment to fostering genuinely collaborative and efficient digital workspaces.
aViewFromTheCave is a participant in the Amazon Services LLC Associates Program, an affiliate advertising program designed to provide a means for sites to earn advertising fees by advertising and linking to Amazon.com. Amazon, the Amazon logo, AmazonSupply, and the AmazonSupply logo are trademarks of Amazon.com, Inc. or its affiliates. As an Amazon Associate we earn affiliate commissions from qualifying purchases.