In the world of finance, the pursuit of profit is always a balancing act against the presence of risk. For the modern investor, whether managing a personal retirement account or overseeing a corporate treasury, the ability to quantify that risk is what separates speculative gambling from strategic wealth building. While most investors are familiar with “standard deviation” as a measure of volatility, it often fails to tell the whole story when comparing different types of assets. This is where the Coefficient of Variation (CV) becomes an indispensable tool.
The Coefficient of Variation is a statistical measure of the dispersion of data points in a data series around the mean. In simpler financial terms, it represents the ratio of the standard deviation to the mean. It is a powerful metric because it allows investors to determine how much volatility they are assuming in comparison to the amount of return they expect from an investment. By normalizing risk, the CV provides a “level playing field” for comparing assets that have vastly different price points or expected returns.
1. Defining the Coefficient of Variation in the Financial Context
To master personal finance and investing, one must look beyond raw returns. A 10% return on a highly volatile asset is not the same as a 10% return on a stable one. The Coefficient of Variation provides the mathematical bridge to understand this distinction.
The Mathematical Foundation: Moving Beyond Standard Deviation
In finance, standard deviation measures the “spread” of returns. If a stock has a high standard deviation, its price swings wildly. However, standard deviation is an absolute measure. If you are comparing a stock priced at $1,000 with a stock priced at $10, a $5 fluctuation means very different things for each.
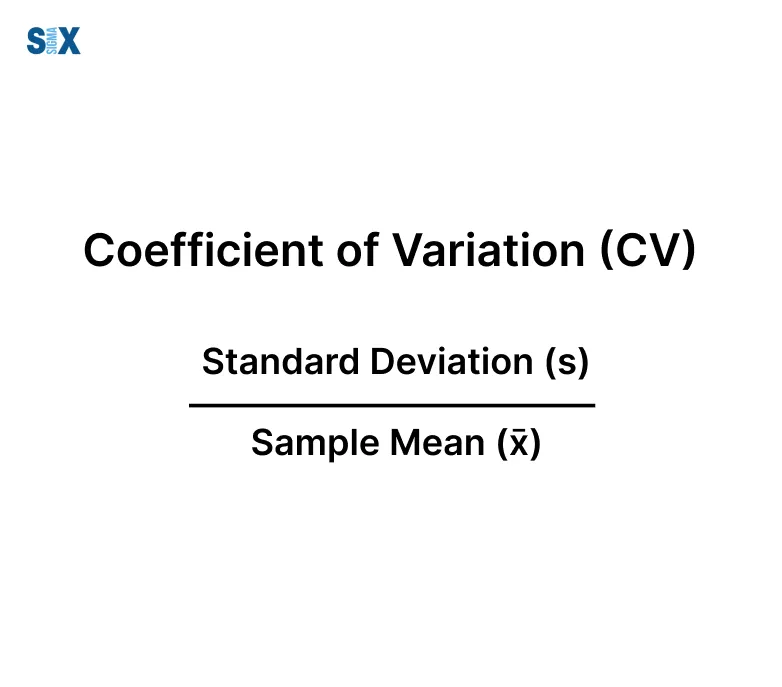
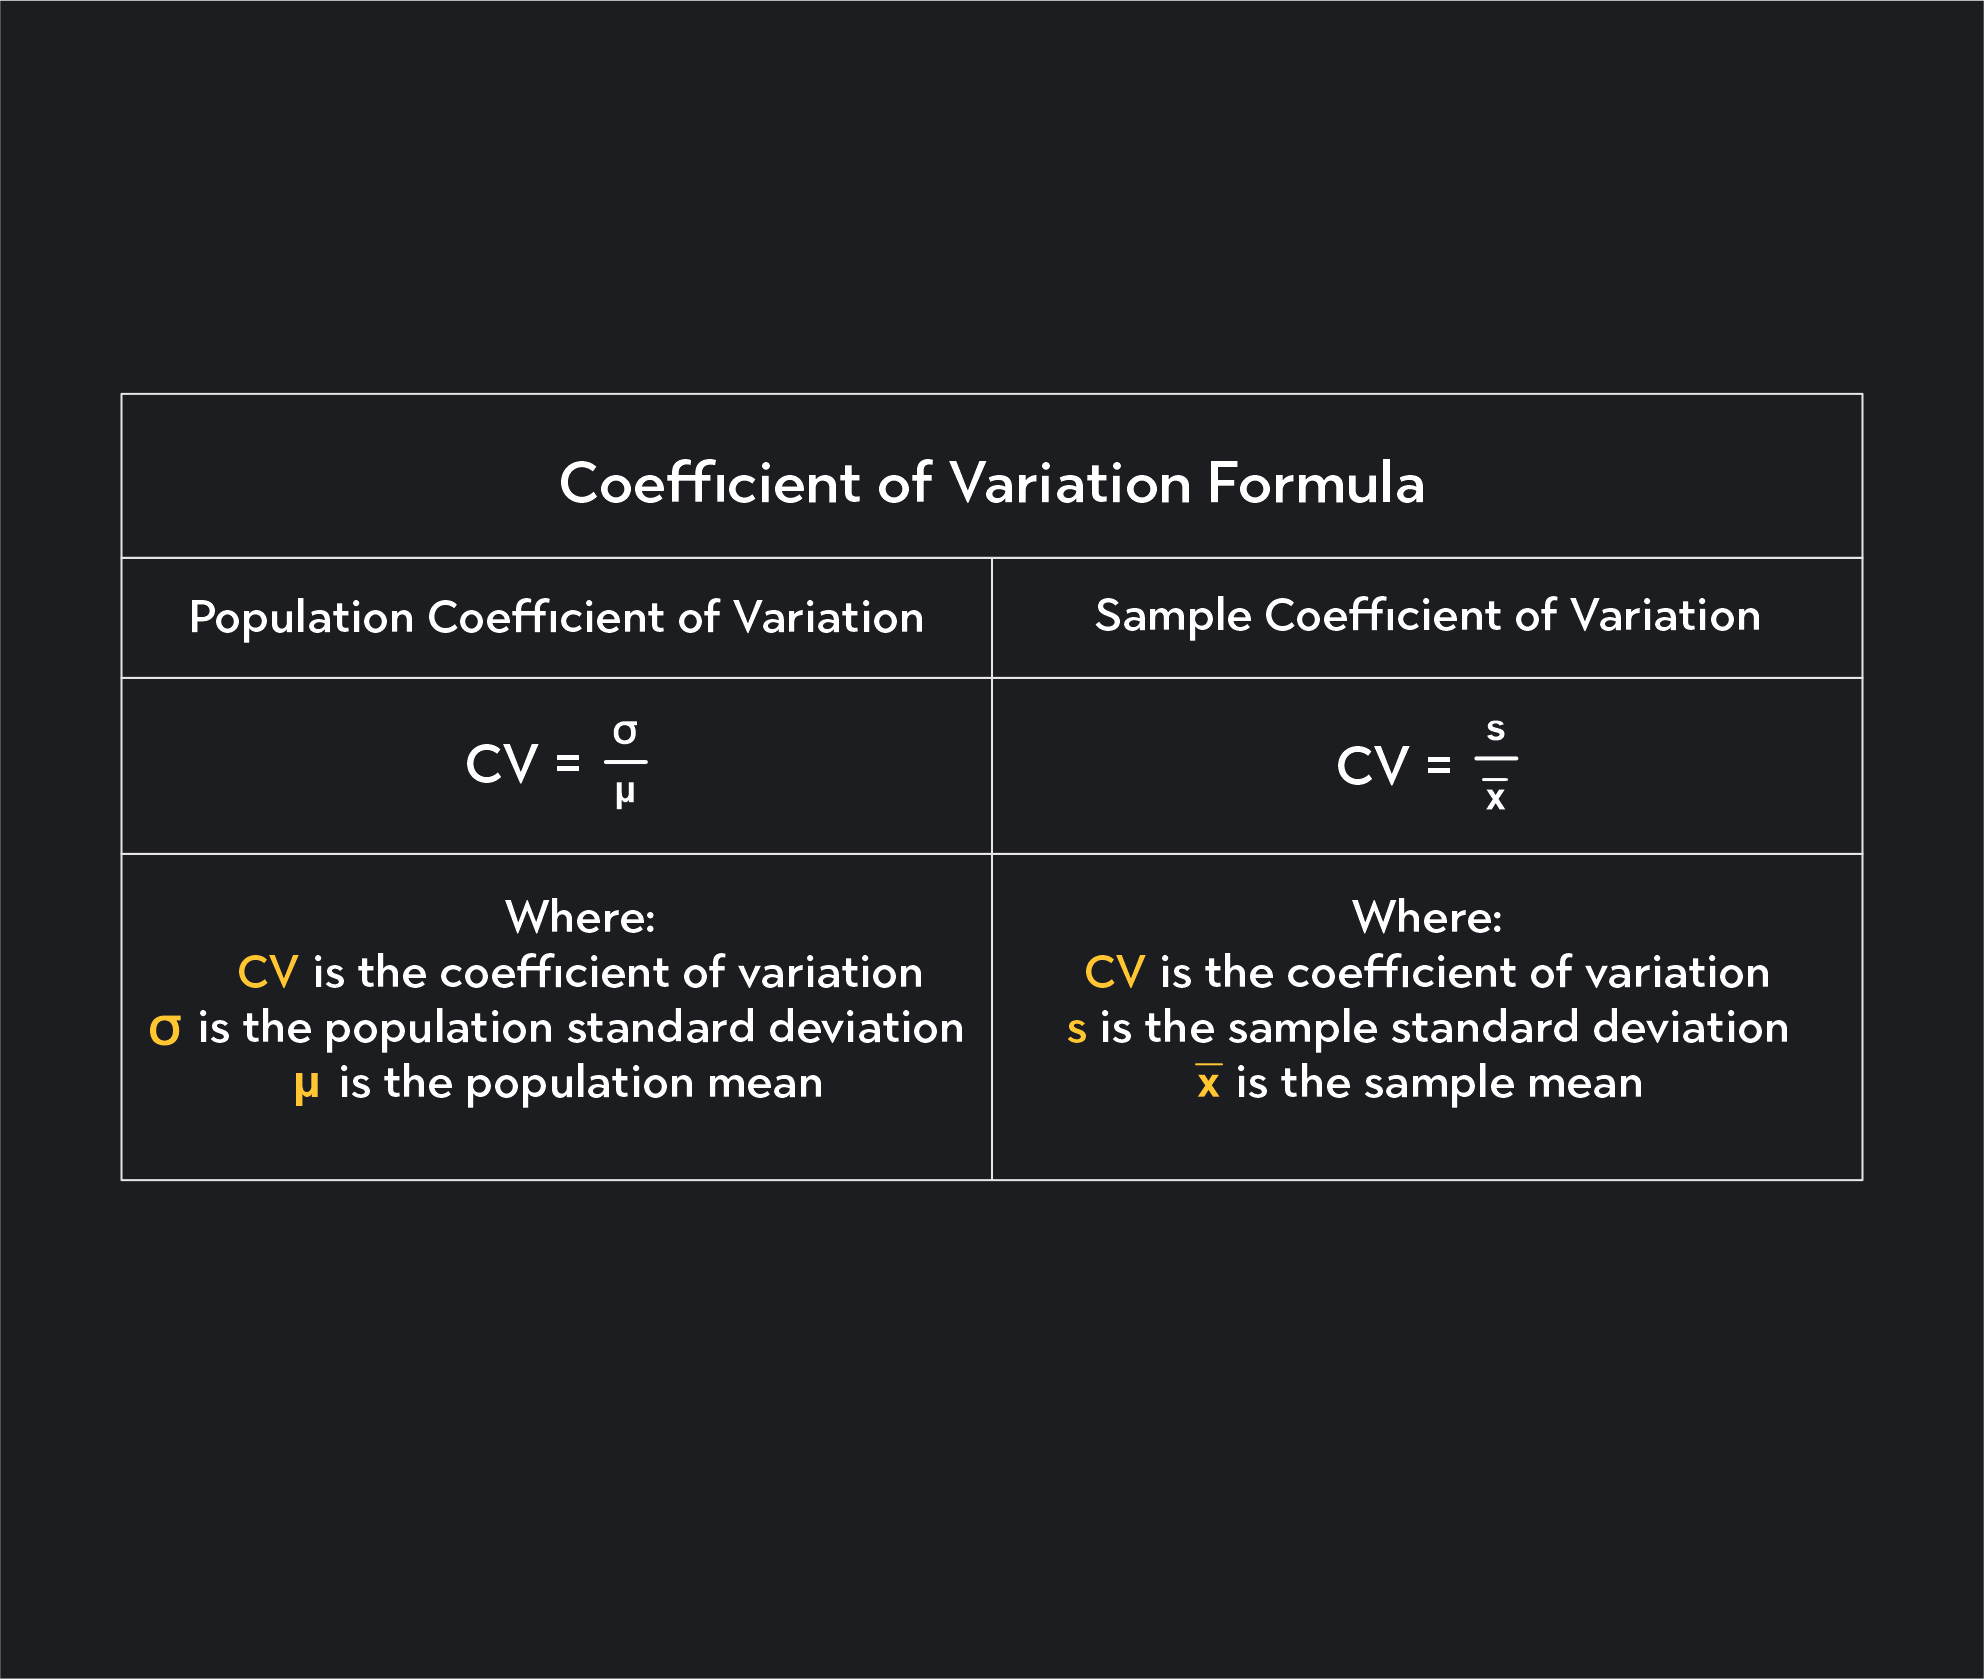
The formula for the Coefficient of Variation is:
CV = (Standard Deviation / Mean)
By dividing the standard deviation by the expected return (the mean), we get a dimensionless number. This allows us to see the “risk per unit of return.” A lower CV indicates a better risk-return trade-off, suggesting that the investment provides a higher return for every unit of risk taken.
Why Relative Volatility Matters for Your Portfolio
Why can’t we just use standard deviation? Imagine you are choosing between two index funds. Fund A has a standard deviation of 15%, and Fund B has a standard deviation of 10%. At first glance, Fund B looks safer. However, if Fund A provides an average annual return of 20% while Fund B only provides 5%, the context changes.
The CV for Fund A would be 0.75 (15/20), while the CV for Fund B would be 2.0 (10/5). Even though Fund B has a lower absolute volatility, it is twice as risky relative to the return it generates. In the niche of money management, understanding relative volatility ensures that you aren’t overpaying—in terms of risk—for the yields you receive.
2. Practical Applications in Portfolio Management and Investing
For the retail investor and the professional fund manager alike, the Coefficient of Variation is most useful during the asset allocation phase. It acts as a filter to weed out inefficient investments that offer “too much drama for too little pay.”
Comparing Assets with Different Expected Returns
One of the greatest challenges in personal finance is comparing “apples to oranges.” How do you compare the risk of a high-yield corporate bond to a volatile tech stock or a cryptocurrency?
Cryptocurrencies often boast astronomical returns but come with gut-wrenching volatility. By using CV, an investor can see if the high returns truly justify the swings. If a speculative asset has a CV significantly higher than the S&P 500 over a five-year period, the investor must ask if they have the stomach for that specific risk-to-reward ratio. CV allows you to normalize these disparate asset classes into a single, comparable metric.
Evaluating Mutual Funds and ETFs
When browsing through a brokerage platform, you are often presented with hundreds of Exchange-Traded Funds (ETFs). Most platforms list the “3-year Trailing Return” and the “Standard Deviation.” Smart investors take the extra step to calculate the CV.
When comparing two “Growth” ETFs, the one with the lower CV is generally the more efficient choice. It suggests the fund manager is achieving growth without exposing the capital to unnecessary wild swings. This is particularly important for those in or near retirement, where capital preservation is just as important as capital appreciation.
Assessing the Risk in Small-Cap vs. Large-Cap Stocks
Small-cap stocks are notoriously volatile but offer the potential for explosive growth. Large-cap stocks (like “Blue Chip” companies) are generally more stable. If you are looking to diversify your portfolio, the CV can help you determine how much small-cap exposure is “efficient.” If adding a specific small-cap stock triples your portfolio’s standard deviation but only increases the expected return by 10%, the CV will spike, signaling that the move may be structurally unsound for a balanced financial plan.
3. The Role of CV in Business Finance and Corporate Strategy
Beyond personal investing, the Coefficient of Variation is a staple in business finance. Corporate treasurers and CFOs use it to make “Go/No-Go” decisions on major projects and to manage company resources.
Capital Budgeting and Project Selection
When a company considers investing in a new factory, a new product line, or an acquisition, they forecast the potential cash flows. However, these forecasts are never certain. A project might have an expected return of $1 million, but with a high degree of uncertainty.
By calculating the CV of the projected Net Present Value (NPV), a business can compare different projects. If “Project Alpha” has an expected return of $500,000 with a CV of 0.2, and “Project Beta” has an expected return of $700,000 with a CV of 0.9, the company might choose the “smaller” project. Why? Because the certainty of the return in Project Alpha is much higher, making it a more responsible use of shareholder capital.
Supply Chain Risk and Revenue Forecasting
In business finance, CV is also used to measure the consistency of revenue and the reliability of suppliers. A revenue stream with a low CV is predictable, allowing the business to take on debt safely or plan for long-term expansion. Conversely, a high CV in monthly sales suggests a “lumpy” business model that requires a larger cash cushion. By analyzing the CV of sales data, financial officers can determine exactly how much “emergency fund” the corporation needs to survive the lean months.
4. Limitations and Best Practices for Using CV
While the Coefficient of Variation is a robust financial tool, it is not a magic wand. Like any financial ratio, it must be used within the correct context to avoid misleading conclusions.
The “Zero Mean” Problem and Negative Returns
The most significant limitation of the CV occurs when the mean (the expected return) is zero or a negative number. Because the formula involves dividing by the mean, a mean close to zero will cause the CV to explode toward infinity, rendering it useless.
Furthermore, in years where the market performs poorly and returns are negative, the CV can become confusing. A negative CV doesn’t have the same intuitive meaning as a positive one. Therefore, CV is best used when analyzing long-term positive-return assets or when comparing the internal consistency of business operations rather than short-term market crashes.
Combining CV with Other Financial Ratios
To get a 360-degree view of an investment, the CV should be used alongside other metrics like the Sharpe Ratio and Beta.
- Beta measures an asset’s risk relative to the overall market.
- The Sharpe Ratio measures excess return per unit of risk (subtracting the risk-free rate).
- CV measures the total risk relative to the mean.
While CV tells you about the internal volatility of the asset itself, Beta tells you how it will behave when the market gets rocky. Using them together allows an investor to build a “Money Fortress”—a portfolio that is efficient, predictable, and resilient.
5. Step-by-Step Guide: Integrating CV into Your Personal Investment Strategy
How can you start using this today? You don’t need a PhD in statistics to apply the Coefficient of Variation to your own money.
Calculating CV for Your Current Holdings
To begin, export your last 12 to 24 months of monthly returns from your brokerage account into a spreadsheet.
- Use the
=AVERAGE()function to find your mean monthly return. - Use the
=STDEV()function to find the standard deviation of those returns. - Divide the Standard Deviation by the Average.
This number is your personal Portfolio CV. If you track this over time, you can see if your strategy is becoming more or less efficient. If your CV is rising while your total returns are stagnant, you are working harder (taking more risk) for the same amount of money.
Making Data-Driven Decisions to Rebalance
When it comes time to rebalance your portfolio—perhaps once a year—use the CV to identify the “troublemakers.” Look for assets in your portfolio that have a disproportionately high CV compared to their peers. These are candidates for liquidation or reduction.
By shifting capital from high-CV assets to lower-CV assets with similar returns, you are performing “Volatility Harvesting.” This doesn’t just make your portfolio safer; it makes your financial life less stressful. In the pursuit of financial independence, the goal isn’t just to have the most money; it’s to have the most “reliable” money.

Conclusion: The Strategic Advantage of CV
In the complex landscape of personal and business finance, the Coefficient of Variation serves as a vital compass. It strips away the illusions created by raw percentages and forces an honest conversation about risk. By focusing on the “risk per unit of return,” you empower yourself to make smarter investments, manage business volatility more effectively, and ultimately build a more stable financial future. Whether you are evaluating a side hustle, a stock, or a corporate expansion, always ask: “What is the CV?” The answer may be the difference between a calculated success and a costly mistake.
aViewFromTheCave is a participant in the Amazon Services LLC Associates Program, an affiliate advertising program designed to provide a means for sites to earn advertising fees by advertising and linking to Amazon.com. Amazon, the Amazon logo, AmazonSupply, and the AmazonSupply logo are trademarks of Amazon.com, Inc. or its affiliates. As an Amazon Associate we earn affiliate commissions from qualifying purchases.