
In the intricate tapestry of baseball statistics, where numbers paint vivid pictures of performance and strategy, few metrics offer as direct and insightful a look into a pitcher’s effectiveness as WHIP. Short for “Walks plus Hits per Inning Pitched,” WHIP has transc transcended its sabermetric origins to become a cornerstone stat for everyone from casual fans to professional analysts, fantasy league enthusiasts, and even front office executives. It distills a pitcher’s ability to prevent base runners into a single, easily digestible figure, offering a potent measure of their control and contact management.
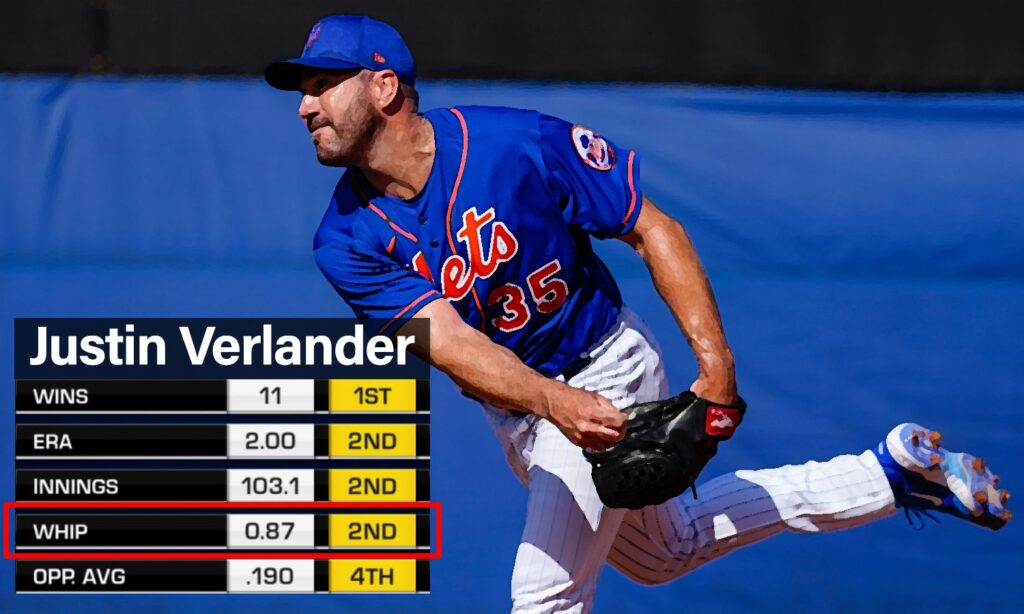
In an era increasingly defined by data, technology, and sophisticated analytics, understanding WHIP is not merely about appreciating a pitcher’s craft; it’s about grasping a fundamental component of baseball’s evolving landscape. It impacts player valuation, informs team strategies, fuels the burgeoning fantasy sports industry, and even shapes the personal brand of elite athletes. This article will delve deep into the meaning, calculation, and profound implications of WHIP, exploring how it intersects with the worlds of technology, branding, and finance within the global sport of baseball.
Understanding WHIP: The Basics of Pitching Efficiency
At its core, WHIP is a measure of how many base runners a pitcher allows per inning pitched. Unlike ERA (Earned Run Average), which focuses on the outcome of runs, WHIP zeroes in on the prevention of opportunities for runs. A pitcher’s primary job is to get outs and keep opponents off the bases. WHIP directly quantifies this aspect of their performance, offering a clearer picture of their efficiency in limiting traffic on the basepaths.
The Calculation Behind WHIP
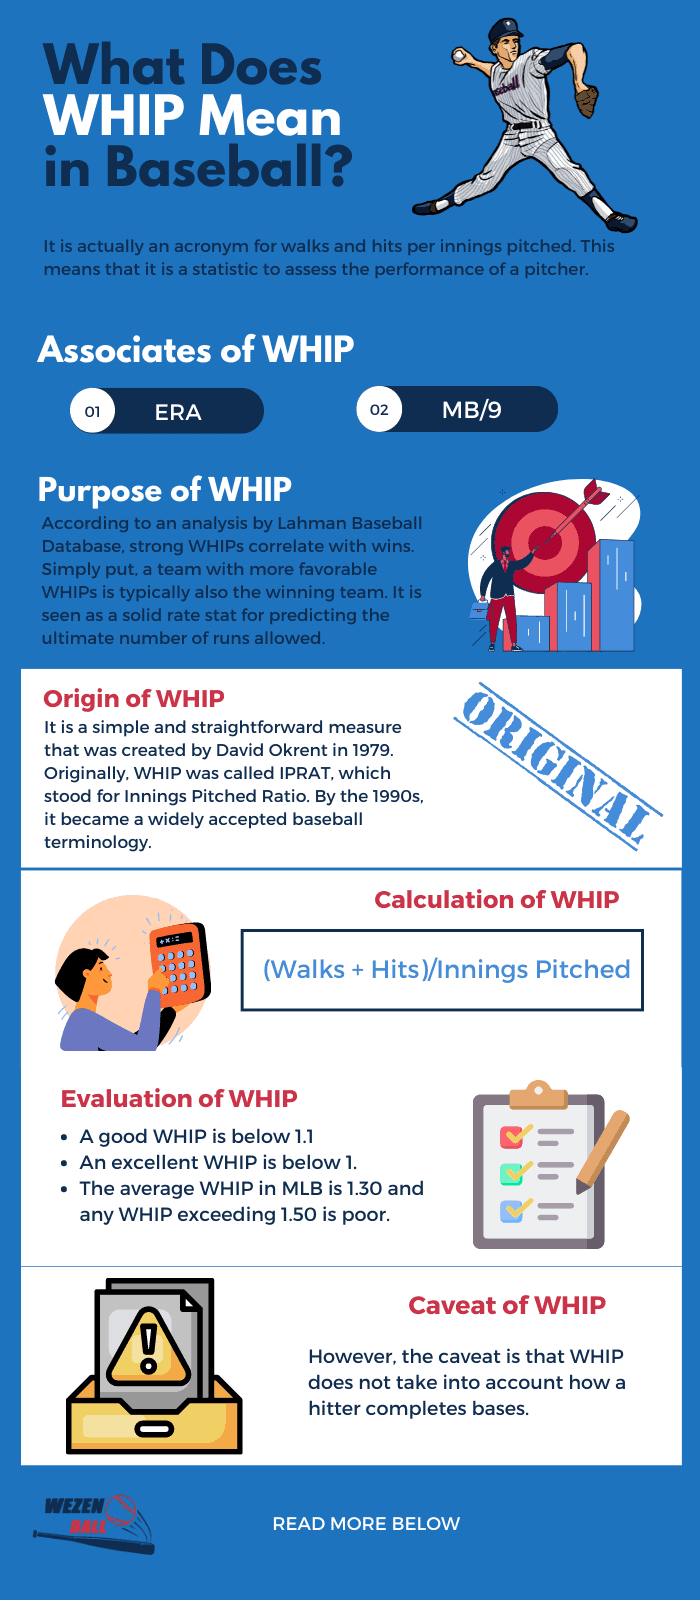
The formula for WHIP is elegantly simple, yet profoundly revealing:
WHIP = (Walks + Hits) / Innings Pitched
Let’s break down each component:
- Walks (BB): This refers to all walks issued by the pitcher, including intentional walks. A walk represents a free pass to first base, putting a runner on without the ball even being put into play.
- Hits (H): This counts all base hits (singles, doubles, triples, home runs) given up by the pitcher. Each hit allows an opposing player to reach base.
- Innings Pitched (IP): This is the total number of innings the pitcher has completed. Innings are often recorded in fractions (e.g., 6.1 innings for six and one-third innings). For calculation purposes, 0.1 innings typically means one out, and 0.2 innings means two outs. So, 6.1 IP would be treated as 6 + 1/3 = 6.333 innings in the denominator.
Example:
Imagine a pitcher who throws 7.0 innings, allows 2 walks, and 5 hits.
WHIP = (2 + 5) / 7.0 = 7 / 7.0 = 1.00
Now, consider another pitcher who throws 6.0 innings, allows 4 walks, and 6 hits.
WHIP = (4 + 6) / 6.0 = 10 / 6.0 = 1.67
The first pitcher, with a WHIP of 1.00, is significantly more effective at preventing base runners than the second pitcher, with a WHIP of 1.67. A lower WHIP is always desirable, indicating fewer runners allowed per inning.
Why WHIP is a Key Performance Indicator
WHIP’s importance stems from its direct correlation to run prevention. Fewer base runners generally mean fewer scoring opportunities for the opposition. While a pitcher might give up a hit or a walk and still escape an inning unscathed, consistently allowing runners builds pressure and statistically increases the likelihood of runs being scored.
- Focus on Control and Contact Management: WHIP highlights two crucial pitching skills:
- Control: A pitcher with good control limits walks, forcing hitters to earn their way on base. Excessive walks inflate WHIP and give away free scoring chances.
- Contact Management: While some hits are unavoidable, a pitcher’s ability to induce weak contact or miss bats (leading to strikeouts, which don’t count as hits or walks) minimizes the number of hits allowed.
- Beyond Earned Runs: WHIP offers a complementary perspective to ERA. ERA measures the runs a pitcher allows, but it can be influenced by defensive errors. WHIP, on the other hand, focuses solely on events directly attributable to the pitcher (walks and hits), providing a “purer” assessment of their base-runner prevention capabilities. A pitcher might have a low ERA but a relatively high WHIP, suggesting they are getting lucky with runners stranded, a situation that might not be sustainable. Conversely, a pitcher with a high ERA but a low WHIP might be a candidate for positive regression, as their underlying ability to prevent base runners is strong. This makes WHIP an excellent predictive stat for future performance.
WHIP in the Age of Analytics: Tech and Data Driving Deeper Insights
Baseball has always been a game of numbers, but the past few decades have seen an exponential rise in the sophistication of data collection and analysis. WHIP, while a relatively straightforward calculation, gains immense power when viewed through the lens of modern technology and advanced analytics. The entire ecosystem of how baseball stats are gathered, interpreted, and utilized has been revolutionized by technological advancements.
From Scorecard to Software: The Evolution of Stat Tracking
The days of solely relying on paper scorecards for tracking every play are long gone. Today, every Major League Baseball game is a veritable data-generating machine, thanks to cutting-edge “Tech.” Systems like MLB’s Statcast employ an array of sophisticated tools:
- Advanced Camera Systems: High-speed cameras capture every movement on the field, tracking the flight of the ball, the speed and spin of pitches, player movements, and more. This granular data allows for the precise logging of every hit, walk, and out.
- Radar Guns and Lidar: These “Gadgets” precisely measure pitch velocity, exit velocity off the bat, and even the speed of base runners, feeding into the comprehensive statistical databases.
- Machine Learning and AI: Raw data is massive and complex. Machine learning algorithms are employed to process, categorize, and validate this data in real-time. These AI tools identify trends, patterns, and anomalies that would be impossible for human analysts to spot manually.
- Specialized Software: Once collected, this wealth of data is fed into sophisticated “Software” applications designed for sabermetrics and predictive analytics. Analysts use these tools to parse through performance metrics, compare players across different eras, and even forecast future outcomes. For fantasy baseball players, dedicated “Apps” and online platforms leverage this data to provide real-time updates, player projections, and statistical breakdowns, enhancing their “Productivity” in managing their teams.
This technological backbone ensures that stats like WHIP are not just numbers, but components of a vast, interconnected data network that offers unparalleled insights into the game.
Leveraging AI Tools for Pitcher Evaluation and Strategy
The integration of “AI Tools” has elevated pitcher evaluation beyond traditional metrics like WHIP and ERA. While WHIP remains a fundamental stat, AI can dissect how a pitcher achieves a low WHIP. For instance:
- Analyzing Pitch Mechanics: AI can analyze a pitcher’s biomechanics from video data, identifying inefficiencies or potential injury risks, and suggesting adjustments to improve control and reduce walks.
- Predictive Modeling: Advanced AI models can predict a pitcher’s future WHIP based on their current underlying metrics (e.g., strikeout-to-walk ratio, groundball rate, expected batting average on balls in play). This is crucial for teams making long-term roster decisions.
- Opponent Scouting and Game Strategy: AI analyzes hitter tendencies against specific pitch types and locations. This helps pitching coaches and catchers craft a game plan that maximizes a pitcher’s strengths and minimizes walks and hits against particular batters, directly impacting the in-game efforts to maintain a low WHIP.
- Fantasy Sports Integration: Many “Apps” and online platforms for fantasy baseball now incorporate AI-driven projections, allowing users to make informed decisions about drafting and trading players based on predicted WHIP and other advanced metrics. This makes the competitive aspect of fantasy baseball more engaging and strategic, turning raw data into actionable insights for millions of users looking for online income or competitive advantage.
The synergy between traditional stats like WHIP and modern technological advancements has created a richer, more nuanced understanding of pitching performance, benefiting teams, players, and fans alike.
The Financial and Branding Impact of a Pitcher’s WHIP
In the multi-billion dollar business of professional baseball, performance metrics directly translate into financial value and shape an athlete’s “Brand.” A pitcher’s WHIP is far from a mere academic curiosity; it is a critical determinant in salary negotiations, player contracts, and the overall economic landscape of the sport.
WHIP and Player Valuation: A Moneyball Perspective
The “Money” aspect of baseball is deeply intertwined with player statistics. A consistently low WHIP signals a pitcher who efficiently gets outs and keeps opponents off the bases, which is invaluable to a team.
- Contract Negotiations and Free Agency: When a pitcher enters arbitration or free agency, their WHIP is a major talking point. A pitcher with a stellar WHIP (e.g., consistently below 1.10) is seen as a more reliable asset, commanding higher salaries and multi-year contracts. Agents leverage these metrics to demonstrate their client’s worth, directly impacting “Business Finance” decisions for teams. Teams, in turn, use advanced analytics—where WHIP is a key component—to project future performance and allocate their payroll efficiently.
- Investing in Talent: For teams, “Investing” in a pitcher with a strong WHIP profile is often seen as a smart allocation of resources. The “Moneyball” philosophy famously emphasized undervalued stats; while WHIP is now widely recognized, its predictive power still helps teams identify pitchers who might be more effective than their ERA alone suggests, offering better value for their money.
- Fantasy Baseball and Online Income: For individuals engaged in daily fantasy sports or season-long leagues, understanding WHIP is crucial for “Online Income” or winning prize money. Selecting pitchers with good WHIP can lead to stable performances, fewer runs allowed, and ultimately, more points for a fantasy roster. This creates a direct financial incentive for fans to learn and apply sophisticated statistical analysis.
A pitcher’s WHIP, therefore, isn’t just a measure of skill; it’s a financial asset, influencing millions of dollars in salaries, team investments, and the burgeoning sports betting and fantasy markets.
Building an Athlete’s Brand and Team Strategy Around Performance
Beyond personal finance, WHIP plays a significant role in “Brand Strategy” for both individual athletes and the teams they play for.
- Personal Branding: A pitcher renowned for an elite WHIP develops a “Personal Branding” as a “stopper,” someone who can consistently shut down opposing lineups and limit scoring chances. This reputation translates into endorsement deals, media attention, and fan loyalty. Think of pitchers known for their pinpoint control and efficiency; their low WHIP contributes directly to their image as a dominant force on the mound. This brand recognition can extend their careers and open opportunities beyond playing, such as broadcasting or coaching.
- Corporate Identity and Marketing: Teams that consistently employ pitchers with low WHIPs and build their strategy around run prevention can develop a “Corporate Identity” as analytically savvy, pitching-dominant organizations. This “Marketing” angle appeals to fans who appreciate strategic play and efficiency. In promotional materials, broadcasts, and social media, impressive WHIP figures are often highlighted to showcase a team’s pitching prowess. For example, a broadcast might feature a graphic comparing a team’s starting rotation’s collective WHIP to the league average, reinforcing their brand as a pitching powerhouse.
- Fan Engagement: Stats like WHIP are crucial tools for “Marketing” baseball to a broader audience. They provide tangible data points for discussion, debate, and engagement among fans, fostering communities around fantasy leagues, sports analysis websites, and social media discussions. This direct engagement enhances the overall brand value of the sport.
Thus, WHIP moves beyond the diamond to influence economic decisions, shape public perception, and drive the strategic narratives of baseball organizations and their star players.
Contextualizing WHIP: What Constitutes a Good vs. Bad Score?
While the calculation of WHIP is straightforward, its interpretation requires context. What constitutes a “good” WHIP today might have been different decades ago, and what’s excellent in one league might be merely average in another. Understanding these nuances is crucial for a complete appreciation of the stat.
Interpreting WHIP Across Different Eras and Leagues
The average WHIP across Major League Baseball typically hovers around 1.30. However, this figure is subject to fluctuations based on several factors:
- League Averages: Generally, in modern MLB, a WHIP below 1.20 is considered excellent, showcasing elite control and contact management. A WHIP between 1.20 and 1.35 is good to above-average, while anything above 1.40 might indicate a pitcher who struggles with allowing too many base runners. Historically, different eras have seen varying league averages due to changes in pitching philosophy, offensive strategies, and ballpark dimensions. The “dead-ball era” featured lower WHIPs due to less powerful hitting, while the “steroid era” saw higher numbers.
- Rule Changes: Recent rule changes, such as the pitch clock or restrictions on defensive shifts, can influence offensive production and, consequently, WHIP figures. Faster game pace and fewer defensive opportunities might marginally increase hits or walks.
- Ballpark Factors: Some ballparks are known as “hitter-friendly” (e.g., Coors Field), while others are “pitcher-friendly.” A pitcher’s home park can slightly influence their WHIP, especially if they play in a park known for many singles or doubles. Analysts account for these factors through park-adjusted statistics.
- Level of Competition: A WHIP of 1.00 in a minor league system might be exceptional, but its direct comparison to an MLB pitcher requires understanding the difference in talent level. Similarly, WHIPs in international leagues or college baseball are interpreted within their respective contexts.
These contextual elements highlight that while WHIP provides a powerful objective measure, its full meaning comes alive when compared against relevant benchmarks.

The Nuances and Limitations of WHIP
Despite its strengths, WHIP, like any single statistic, has its limitations. It’s a powerful tool but should ideally be used in conjunction with other metrics for a comprehensive evaluation:
- Doesn’t Differentiate Hit Types: A single counts the same as a triple or a home run in the WHIP calculation. While all are hits, a single is less damaging than a three-bagger. A pitcher who gives up many singles but few extra-base hits might have a higher WHIP but still be effective at preventing large innings.
- Doesn’t Account for Errors: If a runner reaches base due to a defensive error, it doesn’t count against a pitcher’s WHIP (as it’s not a hit or a walk). This can sometimes make a pitcher’s WHIP look better than their overall base-runner allowance.
- Doesn’t Account for Hit By Pitches (HBP): While an HBP puts a runner on base, it is not factored into the WHIP calculation. A pitcher who frequently hits batters could still have a relatively good WHIP despite putting more runners on base than the stat suggests.
- Doesn’t Account for Defensive Quality: A pitcher with a superb defense behind them might have a lower WHIP simply because more balls in play are turned into outs. Conversely, a pitcher with a weak defense might see their WHIP inflated by hits that would be outs elsewhere.
- Importance of Other Stats: For a holistic view, WHIP should always be considered alongside stats like:
- ERA (Earned Run Average): For overall run prevention.
- FIP (Fielding Independent Pitching): Which estimates ERA based on strikeouts, walks, and home runs, removing the influence of defense.
- K/9 (Strikeouts per 9 Innings) and BB/9 (Walks per 9 Innings): To understand the underlying strikeout and walk rates.
- xWHIP (Expected WHIP): An advanced metric that uses Statcast data to estimate a pitcher’s expected WHIP based on the quality of contact they allow, providing a more predictive measure.
By understanding these nuances, analysts can leverage WHIP’s strengths while mitigating its weaknesses, creating a more accurate and insightful picture of pitching performance.
In conclusion, WHIP is more than just an acronym; it’s a vital indicator of a pitcher’s efficiency, reflecting their ability to limit base runners and control the flow of a game. In an increasingly data-driven world, its importance has only grown, influencing everything from the cutting-edge “Tech” used to gather and analyze player performance, to the strategic “Brand” building of elite athletes and teams, and the massive “Money” flowing through player contracts and the booming fantasy sports industry. For fans and professionals alike, a solid grasp of what WHIP means and how to interpret it is essential to truly appreciate the strategic depth and financial dynamics of modern baseball.
aViewFromTheCave is a participant in the Amazon Services LLC Associates Program, an affiliate advertising program designed to provide a means for sites to earn advertising fees by advertising and linking to Amazon.com. Amazon, the Amazon logo, AmazonSupply, and the AmazonSupply logo are trademarks of Amazon.com, Inc. or its affiliates. As an Amazon Associate we earn affiliate commissions from qualifying purchases.