For most smartphone users, the morning ritual involves a quick glance at a weather app. We see a cloud icon and a simple figure: 30%, 60%, or perhaps a daunting 90%. While we instinctively use these numbers to decide whether to carry an umbrella or cancel a hike, there is a profound technological disconnect between what the average user perceives and what the underlying software is actually calculating.
In the world of meteorological technology, that “percent” isn’t just a random guess; it is the output of complex algorithmic modeling, massive data sets, and high-performance computing. Understanding “what the percent means” requires us to look under the hood of modern weather stacks, exploring how Probability of Precipitation (PoP) is derived from the marriage of physics and data science.
The Binary Behind the Rain: Understanding the PoP Algorithm
To understand the percentage in your weather app, you must first understand the mathematical formula that generates it. In the tech world, we often talk about “confidence scores” in AI or “error margins” in data analytics. The Probability of Precipitation (PoP) is essentially a confidence score for a specific geographic area over a specific timeframe.
Defining Confidence and Areal Coverage
The industry-standard formula used by the National Oceanic and Atmospheric Administration (NOAA) and major tech weather providers is: PoP = C x A.
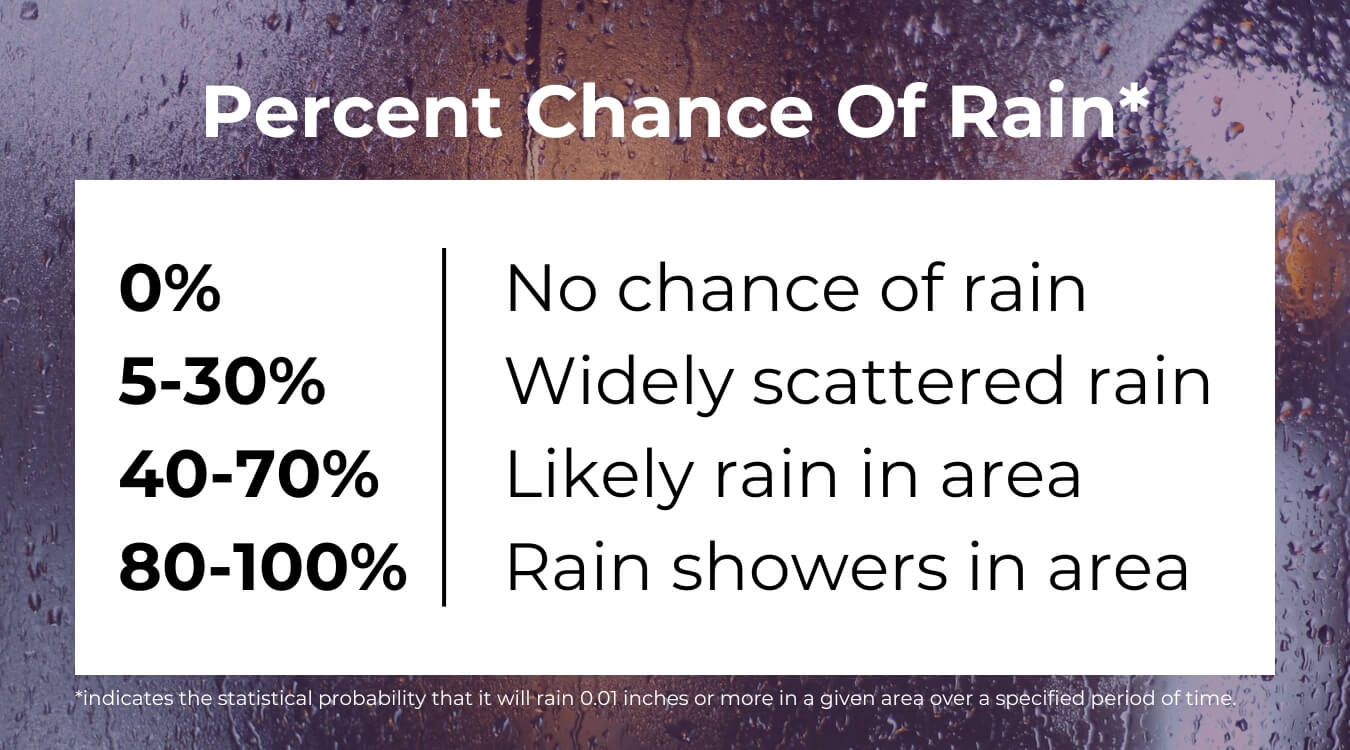
In this equation, C stands for Confidence—the degree of certainty a meteorologist or an automated model has that precipitation will fall somewhere in the forecast area. A stands for Areal Coverage—the percentage of the forecast area that is expected to receive measurable precipitation (at least 0.01 inch).
If a model has 100% confidence that rain will fall on 40% of a city, the app displays 40%. However, if the model has only 50% confidence that rain will cover 80% of the area, the result is still 40%. From a user interface (UI) perspective, these two very different meteorological scenarios look identical. This represents a significant challenge in digital communication: how to distill multi-dimensional data into a single, digestible metric for a consumer-facing app.
Why Your Smartphone App Often Over-simplifies the Data
While the “C x A” formula is the scientific baseline, different tech companies apply their own proprietary layers to this data. Apps like Dark Sky (now integrated into Apple Weather), AccuWeather, and The Weather Channel use “downscaling” algorithms. These take broad atmospheric models and attempt to apply them to a 1-kilometer grid.
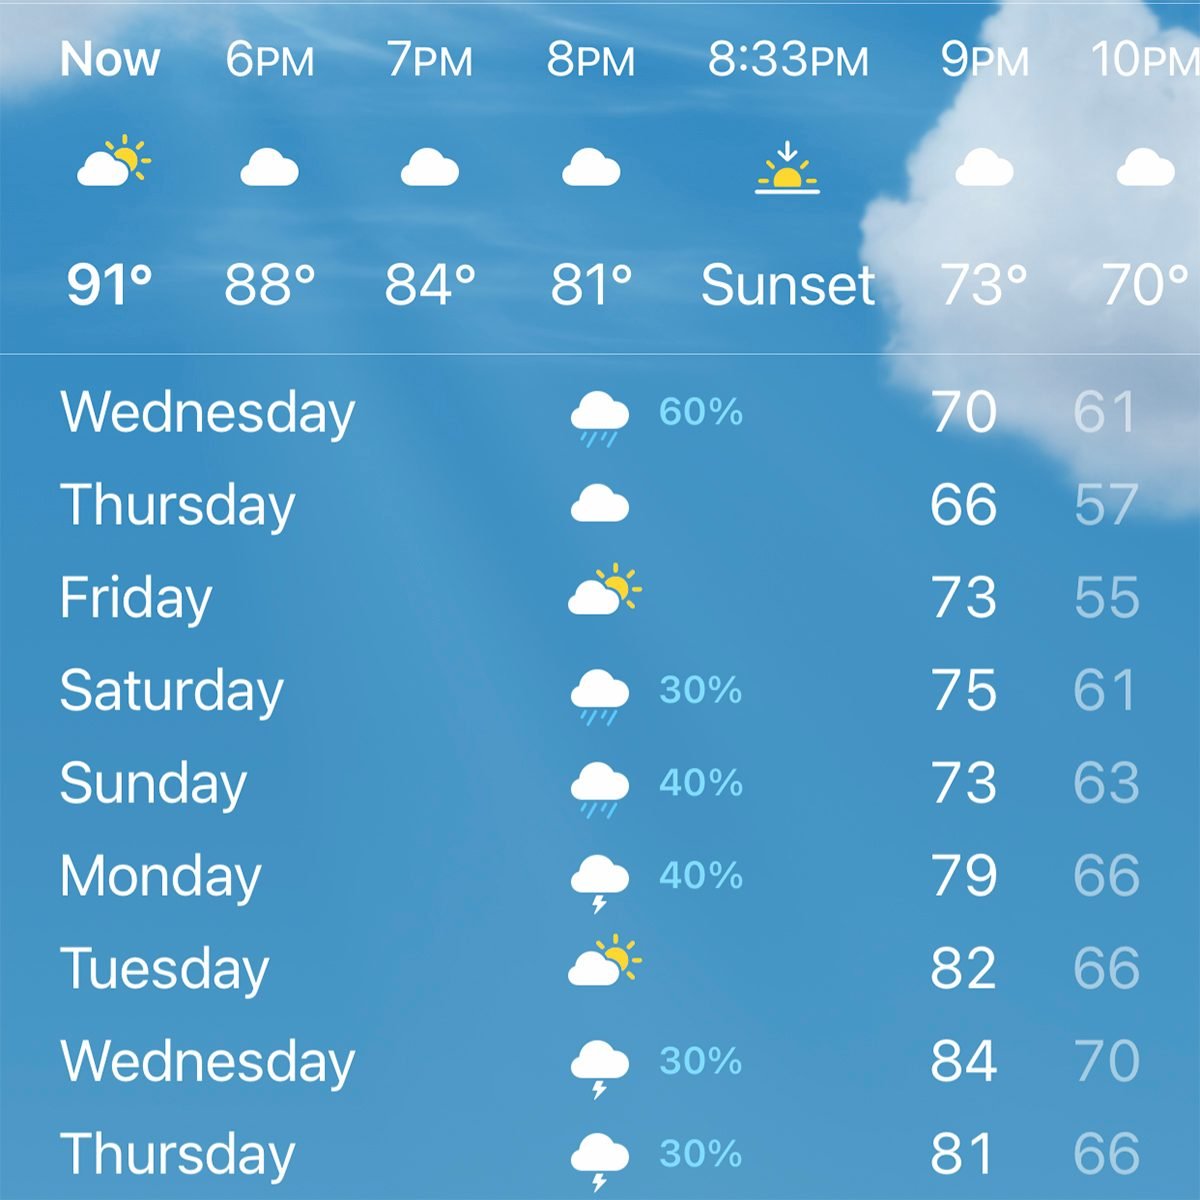
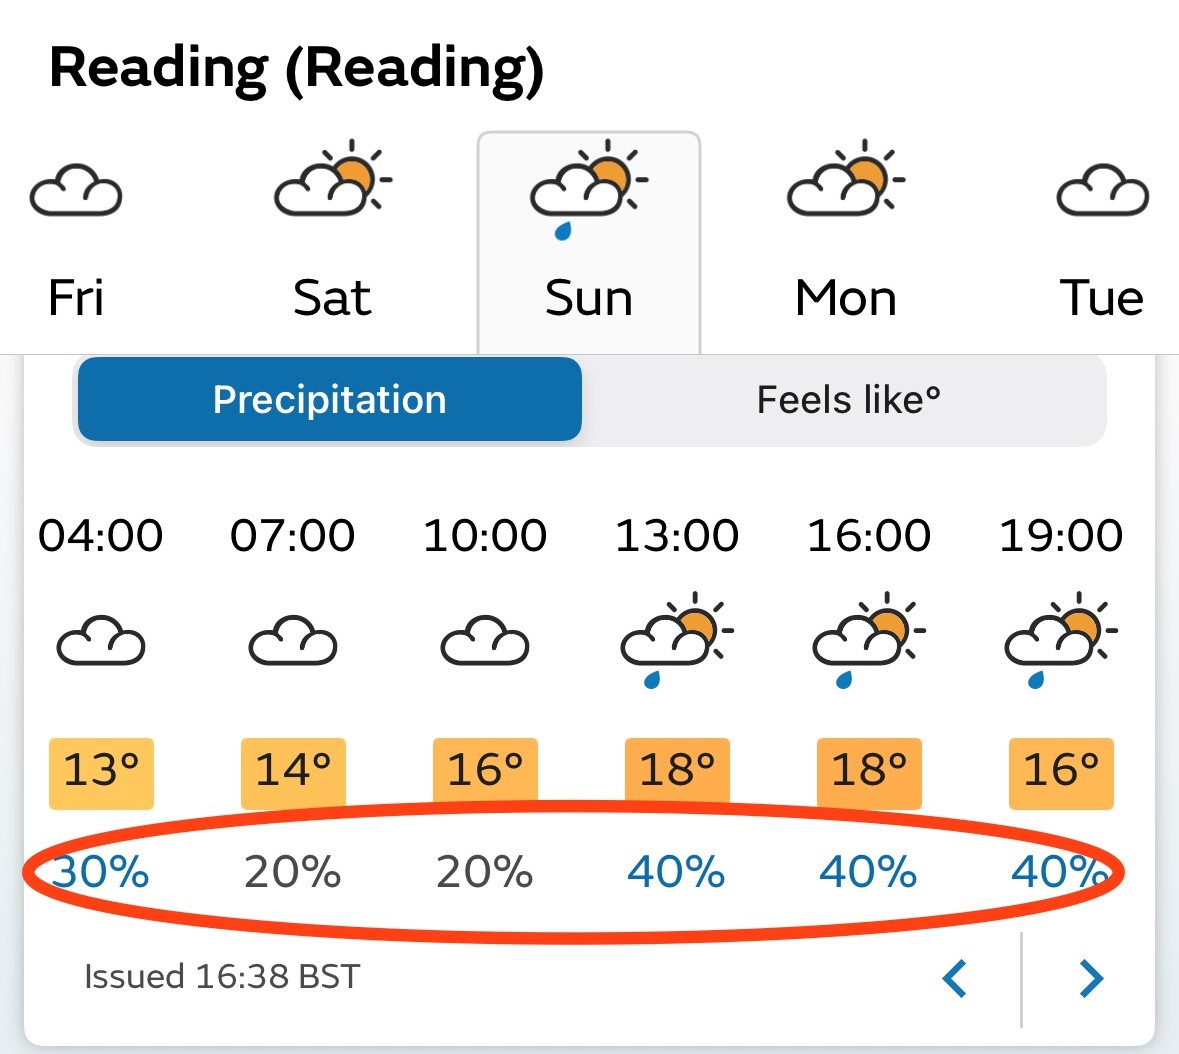
The percentage you see is often a “point forecast.” Tech platforms have moved away from regional generalizations to hyper-local data. When your iPhone says there is a 60% chance of rain, it is increasingly using GPS telemetry to provide a probability for your exact coordinates. This shift from “area-based” to “point-based” forecasting is a direct result of the increase in mobile processing power and the ability to serve personalized data packets in real-time.
Supercomputing and the Modeling Revolution
The percentages we see on our screens are the final output of some of the most powerful hardware on the planet. Weather forecasting is one of the original “Big Data” problems. To generate a 30% rain probability, a supercomputer must simulate the entire atmosphere, solving millions of non-linear equations that describe fluid dynamics and thermodynamics.
The Role of High-Performance Computing (HPC) in Forecasting
Modern weather tech relies on High-Performance Computing (HPC) clusters. For instance, the National Weather Service (NWS) utilizes supercomputers capable of performing quadrillions of calculations per second. These machines run “Ensemble Forecasts.”
Instead of running a single simulation, the software runs the same model dozens of times (an ensemble) with slightly different initial conditions. If 7 out of 10 simulations result in rain for a specific grid, the software assigns a 70% probability. This “Monte Carlo” approach to atmospheric modeling is the backbone of modern digital forecasting. It acknowledges that the atmosphere is a chaotic system where tiny sensor errors can lead to massive divergent outcomes—the literal “butterfly effect” translated into binary.
Comparing Global and Mesoscale Models: GFS vs. ECMWF
In the tech community, there is a constant debate over which “operating system” is superior. In meteorology, the debate is between the Global Forecast System (GFS), developed by the U.S., and the European Centre for Medium-Range Weather Forecasts (ECMWF) model.
The ECMWF is often cited as the “premium” software because it runs at a higher resolution and utilizes more sophisticated data assimilation techniques. Many third-party weather apps ingest data from both models and use a weighted algorithm to present a blended percentage to the user. The “percent” you see is often a consensus reached by different software architectures competing to predict a chaotic environment.
AI and Machine Learning in Modern Meteorology
The next frontier in weather tech isn’t just faster hardware; it’s smarter software. Artificial Intelligence (AI) and Machine Learning (ML) are currently revolutionizing how we interpret weather percentages, moving us from traditional physics-based modeling to pattern-recognition-based forecasting.
Neural Networks for Short-term “Nowcasting”
While traditional models are great for 5-day outlooks, they struggle with “nowcasting”—predicting what will happen in the next 60 minutes. Tech giants like Google (with GraphCast) and NVIDIA are developing deep-learning models that can predict precipitation with higher accuracy and lower computational cost than traditional supercomputers.
These AI models are trained on decades of historical satellite and radar data. When the AI sees a specific thermal signature and moisture gradient, it identifies it as a pattern that led to rain 80% of the time in the past. It then outputs that 80% figure. Unlike traditional models that calculate the physics of every air molecule, AI looks for the “visual” signature of a storm, much like how computer vision identifies a face in a photo.
Refining Precision through Deep Learning
The “percent” in your weather app is also being refined by “Post-Processing” algorithms. Raw model output is often biased; for example, a specific model might consistently over-predict rain in mountainous terrain. Machine learning layers act as a “correction fluid,” analyzing past performance against actual outcomes to “bias-correct” the percentage. If a 50% forecast consistently resulted in no rain in a specific zip code, the ML algorithm learns to dampen that percentage in the future, providing a more accurate UX for the end-user.
IoT and the Proliferation of Hyper-Local Data
Data is the fuel for any algorithm, and the “Internet of Things” (IoT) has provided meteorologists with more fuel than ever before. In the past, data came from a few hundred government-run weather stations. Today, it comes from millions of connected devices.
The Network of Personal Weather Stations (PWS)
Companies like Weather Underground (owned by IBM) and Netatmo have built vast networks of consumer-grade weather stations. These IoT devices feed real-time pressure, humidity, and temperature data back to the cloud. When you see a “percent” of rain, it is increasingly informed by a sensor sitting on a neighbor’s fence three blocks away.
This crowd-sourced data creates a “high-resolution” map of the atmosphere. If ten thousand IoT sensors in a city detect a sudden drop in barometric pressure, the central algorithm can instantly spike the probability of precipitation for that specific urban corridor, providing “hyper-local” alerts that were technologically impossible a decade ago.
Satellite Data Integration and Real-time Telemetry
Beyond ground sensors, the integration of new-age satellite tech—like the GOES-R series—provides high-definition imagery every 30 seconds. This telemetry is beamed to Earth, processed through cloud computing environments (like AWS or Google Cloud), and pushed to your mobile device. The percentage is a live reflection of a global satellite network that monitors the infrared and water vapor signatures of the planet. We are no longer looking at “weather”; we are looking at a real-time digital twin of the Earth’s atmosphere.
The Future: Quantum Computing and the 100% Accuracy Myth
As we look forward, the tech industry is eyeing Quantum Computing as the ultimate solution to the “percent” problem. Because quantum computers can handle the multi-variable complexity of atmospheric molecules better than silicon-based chips, we may eventually see percentages that are far more granular.
However, even with the most advanced tech, a “100% chance of rain” will remain rare in the forecasting world. This is because of the “inherent uncertainty” built into the software. In the tech niche, we understand that no model is a perfect representation of reality. The “percent” in weather is a humility metric—it is a mathematical admission of the limits of our current sensors and processing power.
When you see a percentage on your screen, you aren’t just seeing a weather forecast; you are seeing the culmination of human ingenuity in data science. It is the result of trillions of bytes of data from IoT sensors, processed by AI models, running on HPC clusters, and delivered via a global cloud infrastructure. The next time you see a 40% chance of rain, remember that you are looking at one of the most sophisticated technological achievements in modern history.
aViewFromTheCave is a participant in the Amazon Services LLC Associates Program, an affiliate advertising program designed to provide a means for sites to earn advertising fees by advertising and linking to Amazon.com. Amazon, the Amazon logo, AmazonSupply, and the AmazonSupply logo are trademarks of Amazon.com, Inc. or its affiliates. As an Amazon Associate we earn affiliate commissions from qualifying purchases.