
In the rapidly evolving landscape of software development and cloud-native architecture, the term “honeycomb” has transitioned from a biological marvel to a pivotal concept in systems engineering. While the natural world views a honeycomb as a masterpiece of structural efficiency, the technology sector uses the term—most notably popularized by the platform Honeycomb.io—to represent a paradigm shift in how we understand, debug, and optimize complex software systems.
As applications move from monolithic structures to distributed microservices, traditional monitoring tools have begun to fail. This has given rise to the era of observability. To understand “what are honeycombs” in a tech context is to understand how modern engineering teams navigate the “unknown unknowns” of their systems. This article explores the technical foundations of honeycomb-style observability, the architecture of high-cardinality data, and why this approach is essential for the future of digital infrastructure.

1. The Evolution of Monitoring: From Metrics to Observability
To understand the significance of honeycombs in tech, we must first examine the limitations of traditional monitoring. For decades, engineers relied on simple metrics, logs, and traces—often referred to as the “three pillars of observability.” However, as systems grew more complex, these pillars became silos that failed to provide a cohesive picture.
The Limitations of Traditional Metrics
Traditional monitoring is built on “known unknowns.” You decide in advance what you want to measure—such as CPU usage, memory consumption, or request latency—and you build dashboards to track those specific numbers. While useful, these metrics are aggregated. Aggregation destroys context. For instance, an average latency of 200ms might look healthy, but it could hide the fact that 5% of your users are experiencing a catastrophic 10-second delay. Traditional tools struggle to pinpoint exactly which users are affected and why.
Defining Observability: Beyond the Three Pillars
In the honeycomb philosophy, observability is not just about having logs and metrics; it is the ability to ask new questions of your system without having to ship new code to track specific variables. It is about understanding the internal state of a system solely by looking at its external outputs. In a “honeycomb” environment, the focus shifts from “is the system healthy?” to “why is this specific thing happening to this specific user right now?”
2. The Architecture of a Technical Honeycomb: High Cardinality and Wide Events
The core technical differentiator of a honeycomb-style observability system is its ability to handle high-cardinality and high-dimensionality data. In database terms, cardinality refers to the number of unique values in a dataset.
High Cardinality and Its Importance
In traditional monitoring, high cardinality is often treated as a “problem” because it is expensive to store. Examples of high-cardinality data include User IDs, Transaction IDs, Shopping Cart IDs, or unique IP addresses. However, these are precisely the values needed to debug a modern system.
If a specific customer is experiencing an error, a honeycomb-style system allows you to filter billions of events to find that exact User ID and see their entire journey. Without high-cardinality support, engineers are left guessing which aggregate metric corresponds to a specific failure.
Wide Events: The Foundation of Context
Rather than sending thousands of tiny, disconnected log lines, honeycomb systems utilize “wide events.” A wide event is a single, deeply structured JSON object that contains all the context for a specific unit of work (like an HTTP request).
A single wide event might contain:
- Standard metrics (duration, status code).
- Environment data (container ID, build version).
- Business context (Customer tier, feature flags enabled).
- User data (User ID, geographic location).
By bundling this data together, the system maintains the relationship between different variables, allowing for multi-dimensional analysis that traditional logs cannot achieve.
Distributed Tracing: Connecting the Dots
In a microservices environment, a single user request might pass through dozens of different services. Honeycombs utilize distributed tracing to stitch these wide events together. By passing a “Trace ID” from one service to the next, engineers can visualize the entire lifecycle of a request, identifying exactly where bottlenecks or errors occur in the chain of command.
3. Why Engineering Teams Adopt Honeycomb Systems
The shift toward honeycomb-style observability is driven by the need for speed and reliability. As “Continuous Integration and Continuous Deployment” (CI/CD) becomes the standard, the window for catching errors before they impact users has shrunk significantly.
Resolving “Unknown Unknowns”
The most difficult problems to solve are those you didn’t anticipate. Traditional monitoring requires you to define your alerts ahead of time. But in a distributed system, most outages are caused by a “perfect storm” of unique factors that have never occurred together before. Because honeycombs store raw, unaggregated data, engineers can query the data reactively to discover patterns they didn’t know they should be looking for.
Improving the Developer Experience (DevEx)
Observability is often seen as an “operations” task, but the honeycomb approach brings it into the developer’s workflow. When developers can see how their code performs in production in real-time—using the same tools they use for debugging—the feedback loop closes. This leads to higher code quality and a stronger sense of ownership over the entire lifecycle of the software.
Impact on Incident Response and MTTR
Mean Time to Recovery (MTTR) is a critical KPI for any tech organization. Honeycomb systems drastically reduce MTTR by allowing for “exploratory debugging.” Instead of clicking through dozens of disconnected dashboards, an engineer can “group by” any field (e.g., error_message) and immediately see correlations (e.g., “all these errors are happening on version 2.1 of the mobile app in the EMEA region”).
4. Implementing Honeycomb Strategies in Your Tech Stack
Adopting this style of observability is as much a cultural shift as it is a technical one. It requires moving away from the “dashboard-first” mentality toward an “exploration-first” mentality.
Instrumentation and OpenTelemetry
The first step in creating a honeycomb-style system is instrumentation—the process of adding code to your application to generate events. The industry has largely standardized on OpenTelemetry (OTel), an open-source framework that provides the tools to collect and export telemetry data. By using OTel, organizations can ensure their data is portable and follows a consistent schema, making it easier to feed into an observability platform.
Analyzing Data in Real-Time
Once the data is flowing, the power of the honeycomb lies in the query engine. Unlike traditional databases that might struggle with complex joins across massive datasets, observability-optimized engines are built for speed. They allow engineers to run complex queries—filtering through billions of rows—and receive visual feedback in seconds. This speed is what enables the “interrogative” style of debugging that defines the niche.
Service Level Objectives (SLOs)
Finally, a mature honeycomb implementation uses data to define Service Level Objectives. Instead of alerting on every minor fluctuation in CPU usage, teams set alerts based on the “Error Budget.” If the SLO states that 99.9% of requests must be successful, the team only gets paged if the actual user experience falls below that threshold. This reduces alert fatigue and ensures that engineering resources are focused on issues that truly matter to the business.

Conclusion: The Future of System Reliability
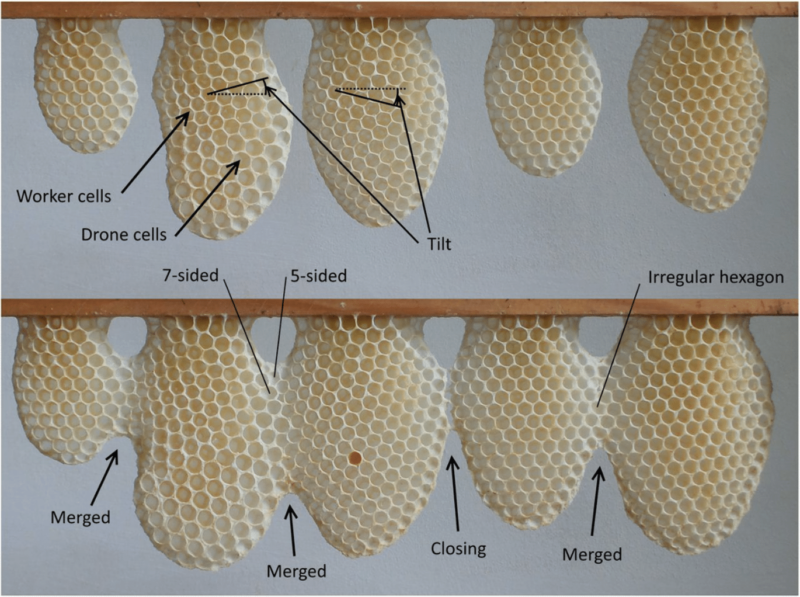
What are honeycombs in the world of technology? They are the structural response to the chaos of modern scale. Just as the hexagonal shape of a bee’s honeycomb provides the most efficient use of space and material, the “honeycomb” approach to data provides the most efficient path to system clarity.
By embracing high cardinality, wide events, and exploratory debugging, technology organizations can move past the era of reactive monitoring. We are entering a phase where software is not just “monitored” but truly “observed.” In this environment, downtime is reduced, developers are more empowered, and the complex web of modern microservices becomes a transparent, manageable ecosystem. Whether you are a startup building your first API or a global enterprise managing thousands of nodes, the principles of the honeycomb are the blueprint for building resilient, high-performance digital products.
aViewFromTheCave is a participant in the Amazon Services LLC Associates Program, an affiliate advertising program designed to provide a means for sites to earn advertising fees by advertising and linking to Amazon.com. Amazon, the Amazon logo, AmazonSupply, and the AmazonSupply logo are trademarks of Amazon.com, Inc. or its affiliates. As an Amazon Associate we earn affiliate commissions from qualifying purchases.