The term “axes” is deceptively simple, yet within the realm of technology, it carries significant weight and diverse applications. Far from the rudimentary concept of a cutting tool, in the digital landscape, “axes” refers to fundamental frameworks, dimensions, or perspectives that define and enable complex systems, data analysis, and user interaction. Understanding these different technological “axes” is crucial for appreciating the underlying mechanics of the software we use, the AI that powers our digital experiences, and the very infrastructure of the internet.
In essence, technological axes serve as organizational principles, measurement scales, or directional vectors that structure information, processes, and capabilities. They provide the scaffolding upon which intricate digital constructs are built, allowing for clarity, comparability, and actionable insights. Whether we are discussing the axes of a graph visualizing data trends, the axes of motion in robotics, or the axes of decision-making in artificial intelligence, these conceptual frameworks are indispensable.

The Ubiquitous Axes of Data Visualization and Analysis
One of the most immediately recognizable applications of “axes” in technology is within the domain of data visualization and analysis. Charts, graphs, and plots are the primary language through which we interpret complex datasets, and at their core lie axes. These are not merely lines on a screen; they are the fundamental dimensions that give data meaning and context.
Defining the Cartesian Coordinate System
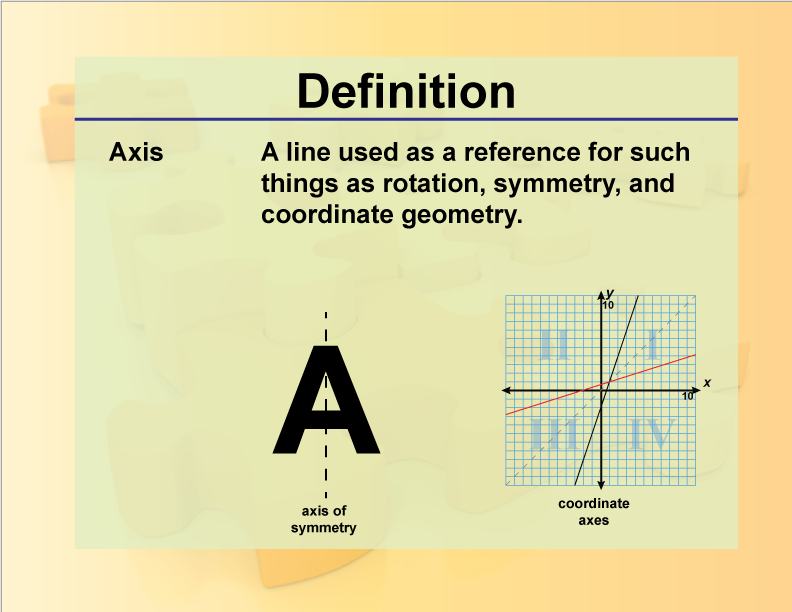
The most common form of axes encountered in data visualization is the Cartesian coordinate system, comprising the X-axis (horizontal) and the Y-axis (vertical). This two-dimensional framework, named after René Descartes, allows for the precise plotting of points and the representation of relationships between two variables.
The X-Axis: The Independent Variable
Typically, the X-axis represents the independent variable, the factor that is manipulated or observed without reference to another. This could be time, in a stock price trend over months; a product feature, in a customer satisfaction survey; or a specific parameter, in a scientific experiment. The values along the X-axis progress in a defined direction, usually from left to right, providing a temporal or categorical progression. The scale of the X-axis is critical; it can be linear, logarithmic, or even categorical, each offering a different perspective on the data. For instance, a logarithmic scale on the X-axis can be used to compress wide ranges of values, making it easier to observe patterns in rapidly growing data.
The Y-Axis: The Dependent Variable
The Y-axis, in contrast, represents the dependent variable, which is expected to change in response to variations in the independent variable. This could be sales figures influenced by marketing spend, crop yield affected by rainfall, or user engagement correlated with app updates. The Y-axis is read from bottom to top, indicating increasing magnitude. Like the X-axis, the Y-axis’s scale is paramount. A linear scale is standard, but if the range of the dependent variable is vast, a logarithmic scale might be employed. Careful consideration of the Y-axis scale can dramatically influence how trends appear. A compressed Y-axis can exaggerate minor fluctuations, while an expanded Y-axis can downplay them, highlighting the importance of choosing appropriate visualization parameters to avoid misleading interpretations.
Beyond Two Dimensions: Introducing Z-Axes and Beyond
While the Cartesian system is fundamental, data visualization frequently extends into three dimensions with the addition of a Z-axis, representing a third independent or dependent variable. This allows for the visualization of volumetric data or the exploration of relationships between three distinct metrics. Examples include topographical maps where the Z-axis represents elevation, or scatter plots with a third dimension indicating a distinct attribute like customer segmentation.
Multi-dimensional Data and Hypercubes
In more advanced data analysis, particularly with the advent of Big Data, we often deal with datasets possessing many more than three variables. While direct visualization becomes challenging, the concept of axes persists. These can be thought of as forming a “hypercube” in multi-dimensional space. Sophisticated algorithms and dimensionality reduction techniques are employed to project these high-dimensional relationships onto lower-dimensional spaces (like 2D or 3D graphs) that humans can comprehend. The underlying axes, even if not directly visualized, still govern the mathematical relationships and the distances between data points in this abstract space, enabling powerful pattern recognition and anomaly detection.
The Axes of Artificial Intelligence and Machine Learning
Artificial Intelligence (AI) and Machine Learning (ML) are fields that are profoundly shaped by conceptual “axes” that guide their learning, decision-making, and operational capabilities. These axes represent the parameters, features, and objectives that AI systems are designed to optimize or understand.
Feature Axes in Machine Learning Models
In supervised learning, machine learning models are trained on datasets where each data point is described by a set of “features.” These features can be considered as axes in a feature space. For example, when training a model to predict house prices, features might include square footage, number of bedrooms, location, and age of the house. Each of these becomes an axis in a multi-dimensional feature space. The model learns to navigate this space, identifying patterns and correlations along these axes to make accurate predictions.
Dimensionality Reduction and Feature Engineering
The concept of feature axes is central to both dimensionality reduction techniques (like Principal Component Analysis – PCA) and feature engineering. Dimensionality reduction aims to find new, more compact axes (principal components) that capture most of the variance in the original feature space, simplifying models and improving efficiency. Feature engineering involves creating new, more informative features from existing ones, effectively transforming the axes of the feature space to better represent the underlying problem.

Axes of Decision-Making in AI Algorithms
Beyond data representation, AI algorithms operate along specific axes of decision-making. This is particularly evident in areas like reinforcement learning and game AI.
Reward and Punishment Axes
In reinforcement learning, an AI agent learns through trial and error by interacting with an environment. The agent receives “rewards” for desirable actions and “punishments” for undesirable ones. These rewards and punishments can be thought of as forming an axis of positive or negative reinforcement. The agent’s goal is to maximize its cumulative reward, effectively moving along this “reward axis” towards optimal strategies. The design of the reward function itself is a critical step, defining what constitutes success and failure for the AI.
Policy Axes and Strategy Space
AI agents often develop a “policy,” which is a strategy for taking actions in a given state. This policy can be visualized as navigating a “strategy space,” where each point represents a different combination of actions and their probabilities. The AI learns to adjust its policy by moving along different axes within this strategy space, exploring various approaches to achieve its objectives. For instance, in a chess AI, the policy might dictate the probability of moving a certain piece to a specific square, and the AI learns to refine this policy by adjusting its decisions along the “strategic move axis.”
The Axes of Digital Interaction and User Experience
The way we interact with digital interfaces and the underlying systems that govern these interactions are also defined by various technological axes, influencing everything from navigation to accessibility.
Navigation Axes in User Interfaces
User interfaces (UIs) are designed with implicit or explicit navigation axes that guide users through digital content and functionality. On websites and within applications, users typically navigate along horizontal and vertical axes.
Scrolling and Swiping Axes
Vertical scrolling is a primary axis of navigation for most web pages and documents, allowing users to access content sequentially from top to bottom. Horizontal scrolling, while less common for primary content, is often used for carousels of images or in specific application layouts. Mobile interfaces heavily utilize the swiping gesture, effectively turning the screen into a navigable space along horizontal and sometimes vertical axes, allowing users to move between screens, pages, or content categories.
Information Hierarchy and Navigational Axes
Beyond direct movement, the very structure of information within an application or website creates navigational axes. A well-designed hierarchy leads users down a predictable path, where selecting an option on one axis (e.g., clicking a menu item) reveals new options along another axis. This creates a tree-like structure, with the main navigation acting as the initial branching point, and subsequent menus and submenus forming deeper levels of the navigational axes.
Axes of Control and Input Mechanisms
The ways in which we input commands and control digital devices are also governed by distinct technological axes.
Analog Input Axes
Many modern input devices utilize analog axes to provide nuanced control. Joysticks and game controllers, for instance, have X and Y axes that translate physical movement into digital input, allowing for precise control in games and simulations. Steering wheels in racing games or flight simulators operate along similar analog axes. The sensitivity and range of these axes directly impact the player’s immersion and the game’s responsiveness.
Gestural and Spatial Axes
The evolution of touchscreens and gesture recognition has introduced new axes of interaction. Pinch-to-zoom gestures involve manipulating digital objects along two spatial axes simultaneously. More advanced systems, like those using depth sensors or motion tracking, can interpret movement along three spatial axes (X, Y, and Z), enabling intuitive control for tasks like 3D modeling or augmented reality experiences. These axes allow for a more natural, kinesthetic interaction with the digital world.
In conclusion, the term “axes” in technology is a versatile concept that underpins our digital world. From the fundamental frameworks of data visualization and the intricate decision-making processes of AI to the intuitive navigation and control mechanisms of user interfaces, axes provide the essential dimensions and structures that make technology functional, understandable, and increasingly sophisticated. Recognizing these diverse applications of “axes” offers a deeper appreciation for the invisible scaffolding that supports our modern digital lives.
aViewFromTheCave is a participant in the Amazon Services LLC Associates Program, an affiliate advertising program designed to provide a means for sites to earn advertising fees by advertising and linking to Amazon.com. Amazon, the Amazon logo, AmazonSupply, and the AmazonSupply logo are trademarks of Amazon.com, Inc. or its affiliates. As an Amazon Associate we earn affiliate commissions from qualifying purchases.