
In the dynamic world of finance, understanding how to measure progress is paramount. Whether you’re a private investor tracking your portfolio, a business owner analyzing quarterly sales, or an individual monitoring your personal income, the concept of “percentage of growth” is a fundamental metric that offers clarity and direction. It transcends mere numbers, transforming raw data into actionable insights, revealing not just what happened, but by how much something changed, enabling informed decision-making. This article delves into the intricacies of calculating percentage growth, exploring its myriad applications across personal and business finance, and equipping you with the knowledge to leverage this powerful analytical tool effectively.
Understanding the Fundamentals of Growth Percentage
At its core, percentage growth is a simple yet profound mathematical concept designed to quantify the relative change in a value over a specific period. It provides a standardized way to compare growth across different assets, timeframes, or even industries, regardless of their absolute sizes.
What is Percentage Growth?
Percentage growth represents the rate of increase of a quantity over time, expressed as a percentage of its initial value. It answers the question: “By what percentage did X increase from point A to point B?” This metric is critical because it normalizes growth figures, making them comparable. For instance, a $100 increase might seem small, but if it’s on an initial value of $10, it represents a 900% growth – a significantly different story than a $100 increase on an initial $10,000 value.
Why is Calculating Growth Important in Finance?
For anyone navigating the financial landscape, understanding growth is not just academic; it’s essential for strategic planning and evaluation.
-
Performance Evaluation: It allows you to assess the effectiveness of investments, business strategies, or personal financial decisions. Are your assets growing at a satisfactory rate? Is your business expanding as projected?
-
Goal Setting: By understanding past growth trends, you can set realistic and ambitious future financial goals, whether it’s for retirement savings, business expansion, or debt reduction.
-
Comparative Analysis: It enables benchmarking. You can compare your investment’s growth against market averages, your company’s revenue growth against competitors, or your salary growth against inflation.
-
Forecasting and Planning: Historical growth rates are often used as inputs for financial models and forecasts, helping to predict future performance and inform budgeting decisions.
The Basic Formula: Current vs. Past Value
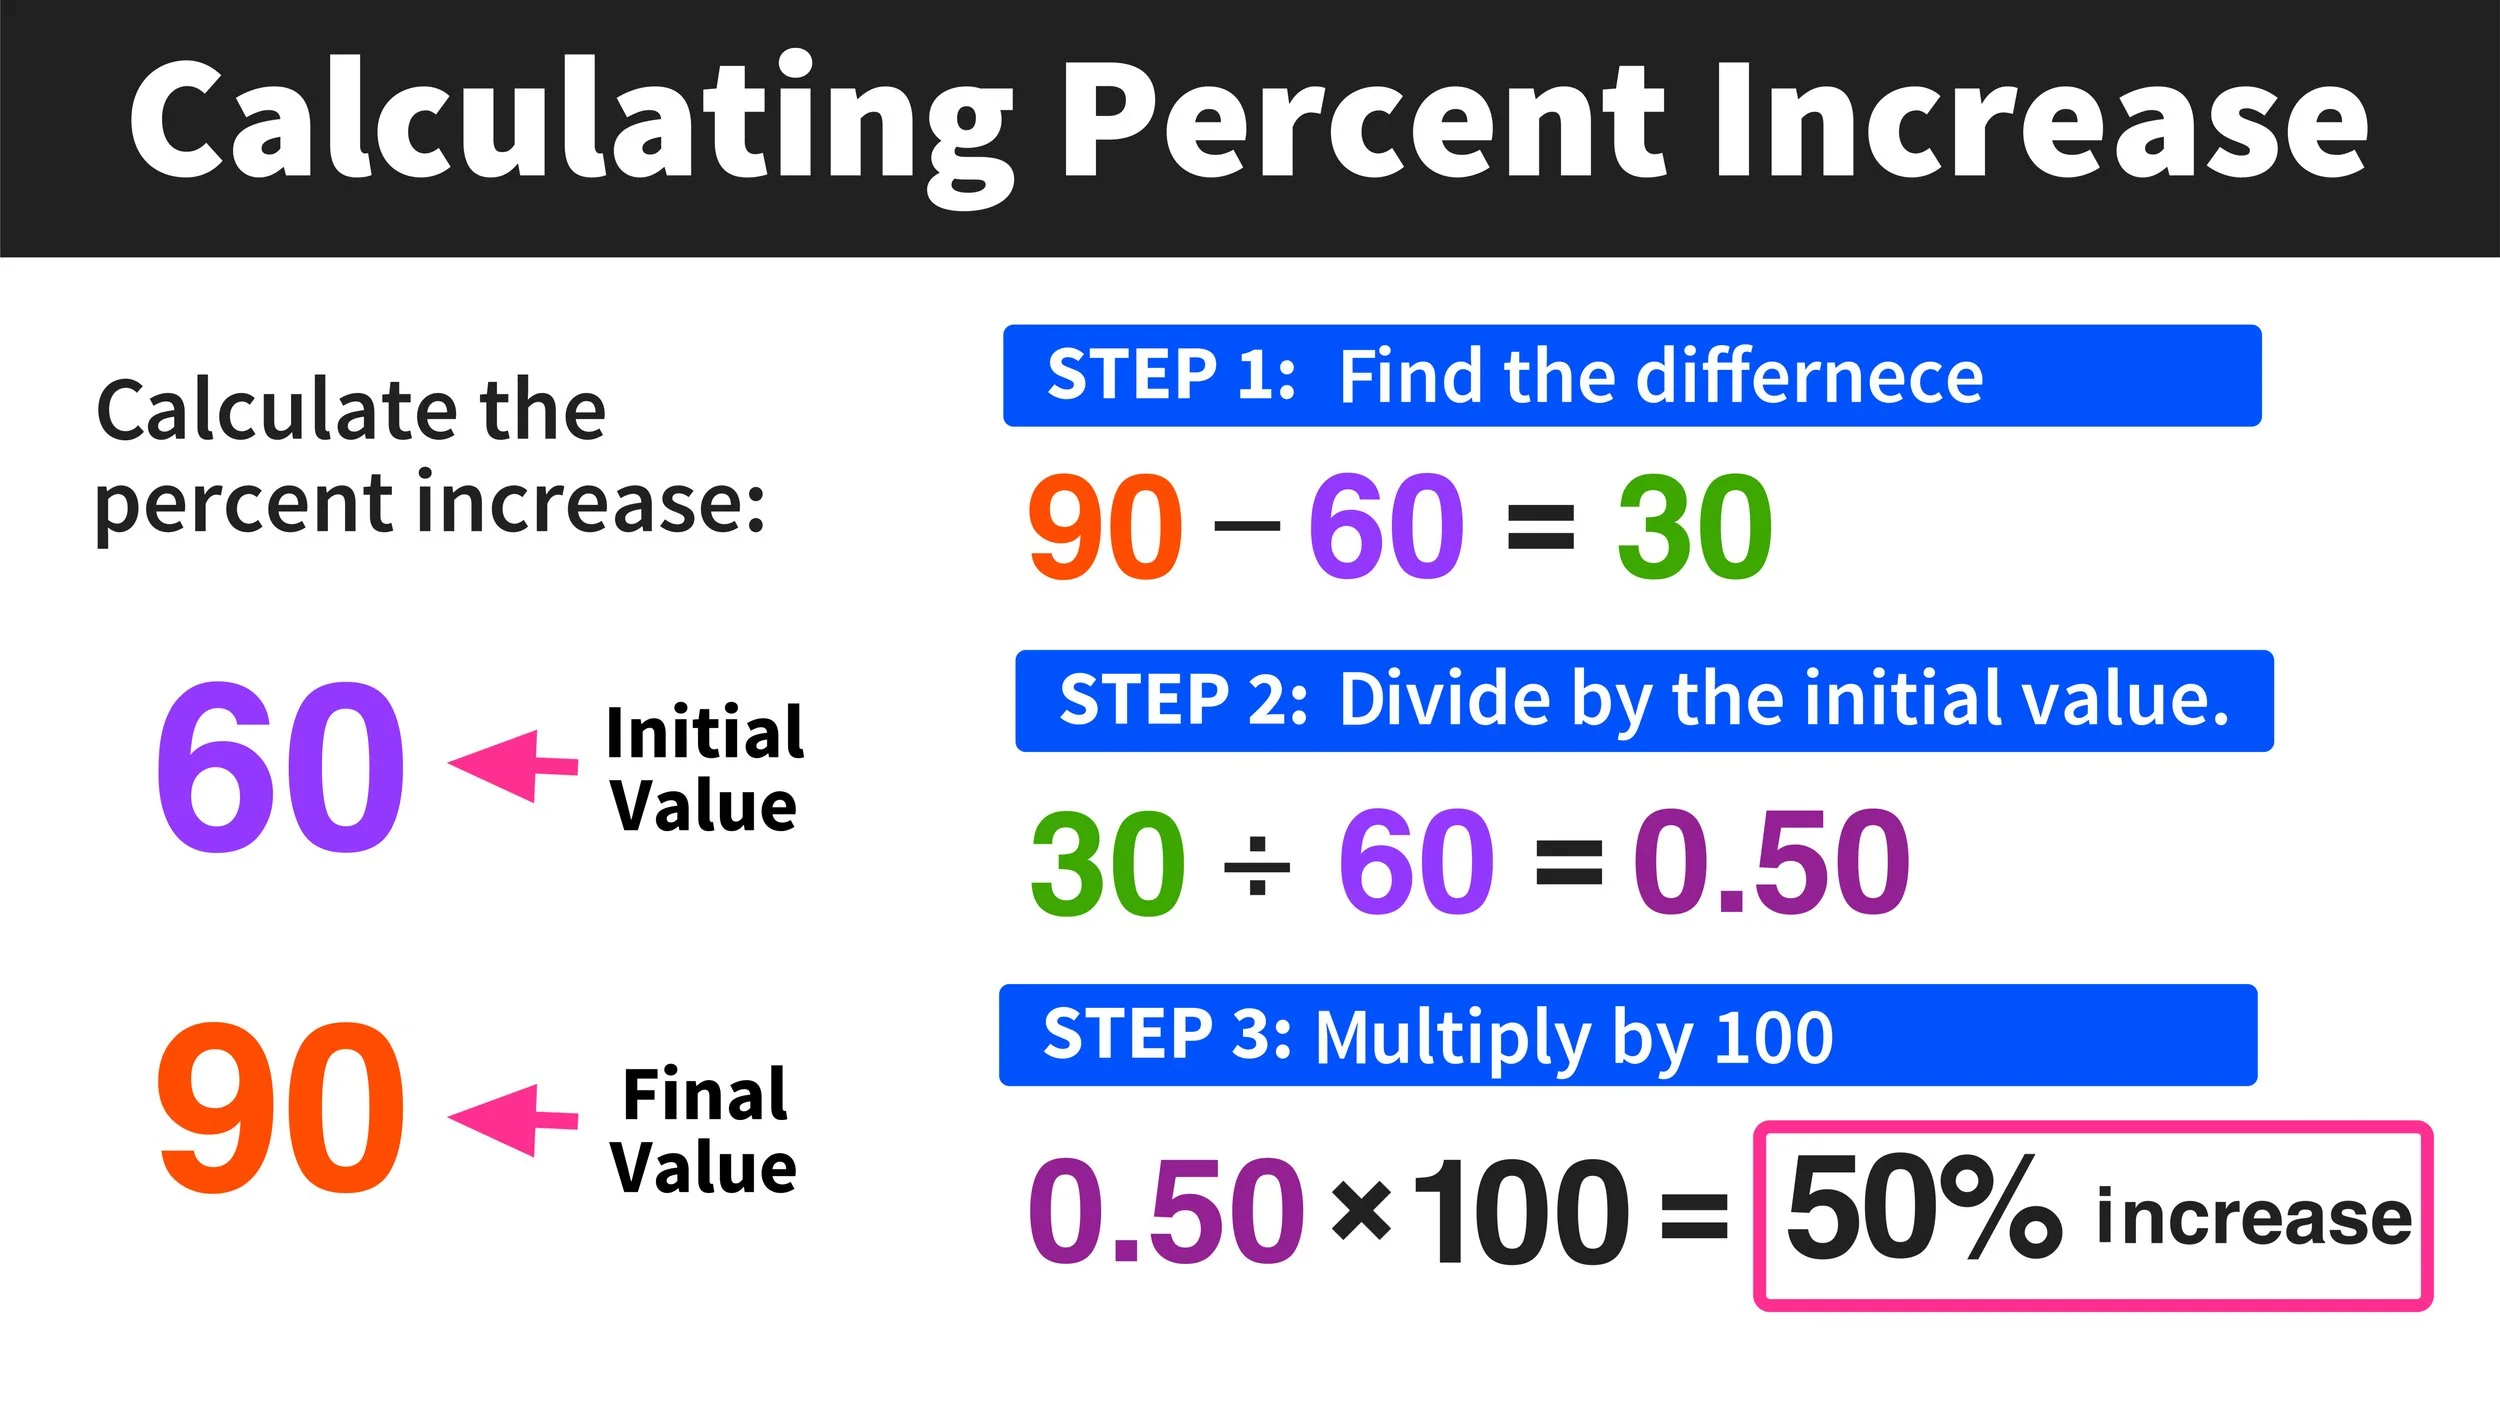
The calculation of percentage growth is straightforward. It requires two primary data points: the initial value and the final (or current) value.
The formula is as follows:
$$ text{Percentage Growth} = left( frac{text{Current Value} – text{Past Value}}{text{Past Value}} right) times 100% $$
Let’s break it down:
-
Current Value (or Final Value): This is the value of the item, asset, or metric at the end of the period you’re analyzing.
-
Past Value (or Initial Value): This is the value of the item, asset, or metric at the beginning of the period.
Example: If your investment was worth $5,000 last year and is now worth $6,250:
$$ text{Percentage Growth} = left( frac{$6,250 – $5,000}{$5,000} right) times 100% $$
$$ text{Percentage Growth} = left( frac{$1,250}{$5,000} right) times 100% $$
$$ text{Percentage Growth} = 0.25 times 100% = 25% $$
This indicates a 25% growth in your investment over the period.
It’s also important to note that if the current value is less than the past value, the result will be a negative percentage, indicating a percentage decrease or decline. The formula remains the same, providing a comprehensive view of change.
Practical Applications in Personal Finance
For individuals, percentage growth is a powerful tool for navigating their financial journey. It helps assess progress towards financial independence, evaluate the effectiveness of personal financial decisions, and adjust strategies as needed.
Tracking Investment Returns
Perhaps the most common personal finance application, percentage growth is fundamental to understanding how well your investments are performing.
-
Stocks and Bonds: You can calculate the percentage growth of individual stock holdings or bonds to see which are thriving and which are lagging. This helps in portfolio rebalancing decisions.
-
Mutual Funds and ETFs: Growth percentages are critical for comparing the performance of different funds against each other and against their respective benchmarks (e.g., S&P 500).
-
Retirement Accounts (401k, IRA): Regularly checking the growth of your retirement savings helps ensure you’re on track for your long-term goals and allows you to adjust contribution levels or investment strategies if growth is insufficient.
Example: You invested $10,000 in a mutual fund five years ago, and it’s now worth $14,500.
$$ text{Percentage Growth} = left( frac{$14,500 – $10,000}{$10,000} right) times 100% = 45% $$
This means your investment has grown by 45% over five years.
Analyzing Salary and Income Growth
Your earning power is a key component of your financial health. Tracking its growth helps you understand your economic progression.
-
Salary Increases: When you receive a raise, calculating the percentage increase helps you understand its real impact and compare it against inflation or industry standards.
-
Side Hustle Income: If you have multiple income streams, tracking the growth of each can help you identify which ventures are most profitable and worth scaling.
-
Overall Household Income: Monitoring total household income growth year-over-year provides a clear picture of your financial advancement.
Example: Your annual salary was $60,000 last year and increased to $63,000 this year.
$$ text{Percentage Growth} = left( frac{$63,000 – $60,000}{$60,000} right) times 100% = 5% $$
Your salary grew by 5%.
Monitoring Savings and Debt Reduction Progress
Percentage growth (or reduction) isn’t just for assets; it’s equally vital for liabilities and savings.
-
Savings Growth: Tracking the percentage increase in your savings account balance motivates continued saving and helps you see how quickly you’re approaching your financial targets (e.g., emergency fund, down payment).
-
Debt Reduction: Conversely, calculating the percentage reduction of a debt (e.g., credit card balance, mortgage principal) can be incredibly motivating and demonstrates the effectiveness of your debt repayment strategy.
Example (Debt Reduction): You started with a credit card balance of $5,000 and have reduced it to $3,500.
While technically a percentage decrease in debt, using the same formula to quantify the change:
$$ text{Percentage Change} = left( frac{$3,500 – $5,000}{$5,000} right) times 100% = -30% $$
This indicates a 30% reduction in your credit card debt, a positive financial outcome.
Essential for Business Finance and Investment Analysis
Beyond personal finance, percentage growth is a cornerstone of business analysis and investment decisions on a larger scale. It’s used by executives, analysts, and investors to gauge the health, scalability, and potential of companies.
Measuring Revenue and Profit Growth
For businesses, these are arguably the most critical growth metrics.
-
Revenue Growth: This indicates how effectively a company is increasing its sales. Consistent, healthy revenue growth often signals a strong product-market fit and effective sales strategies. It’s a primary indicator of a company’s market acceptance.
-
Profit Growth: While revenue growth is good, profit growth (specifically net profit) demonstrates a company’s ability to not only sell more but also manage costs effectively. Ultimately, profit drives shareholder value and reinvestment capabilities.
Example: A company’s revenue increased from $1 million last year to $1.3 million this year.
$$ text{Percentage Growth} = left( frac{$1,300,000 – $1,000,000}{$1,000,000} right) times 100% = 30% $$
The company achieved 30% revenue growth.
Assessing Market Share and Customer Base Expansion
Percentage growth extends beyond financial statements to operational metrics that reveal market position and customer engagement.
-
Market Share Growth: By comparing a company’s sales growth to the overall market growth, businesses can determine if they are gaining, losing, or maintaining their share of the market.
-
Customer Base Growth: Tracking the percentage increase in new customers or subscribers is vital for subscription-based models or businesses heavily reliant on customer acquisition.
Example: A software company had 10,000 subscribers at the start of the year and ended with 12,500 subscribers.
$$ text{Percentage Growth} = left( frac{12,500 – 10,000}{10,000} right) times 100% = 25% $$
The customer base grew by 25%.
Evaluating Stock Performance and Portfolio Growth
Investors analyze stock performance not just in absolute dollar terms but critically in percentage growth to understand returns relative to the initial investment.
-
Individual Stock Performance: Calculating the percentage growth of a single stock reveals its appreciation over a period, making it comparable to other investment opportunities.
-
Investment Portfolio Performance: Aggregating the value of an entire portfolio and calculating its percentage growth provides an overall measure of investment success, crucial for wealth management.
-
Dividend Growth: For income-focused investors, tracking the percentage growth of dividends paid by a company is a key indicator of its financial health and commitment to shareholder returns.
Common Pitfalls and Considerations When Calculating Growth
While the percentage growth formula is simple, its interpretation requires nuance. Several factors can influence the meaning and comparability of growth figures.
The Impact of Time Periods
The period over which growth is measured significantly impacts the resulting percentage.
-
Short-Term Volatility vs. Long-Term Trends: A stock might show 10% growth in a single volatile month, but only 2% over a year. Long-term trends are often more indicative of true performance than short-term fluctuations.
-
Starting and Ending Points: The choice of start and end dates can dramatically alter the perception of growth, especially if either point coincides with an unusual peak or trough. Always ensure the chosen period is representative and consistent for comparisons.
Accounting for Inflation and Real Growth
A critical oversight is failing to adjust for inflation. If your investment grows by 5% but inflation is 3%, your real growth (purchasing power increase) is only 2%.
- Nominal vs. Real Growth: The basic formula provides nominal growth. To find real growth, you typically subtract the inflation rate from the nominal growth rate (or use a more precise formula involving inflation adjustment factors for more complex calculations). This gives a truer picture of wealth creation.
Understanding Different Growth Rates (CAGR vs. Simple Growth)
For periods longer than one year, simple percentage growth can be misleading.
-
Simple Percentage Growth: As discussed, this is the total percentage change from start to end. It doesn’t account for compounding effects over multiple periods.
-
Compound Annual Growth Rate (CAGR): This is the average annual growth rate of an investment over a specified period longer than one year, assuming the profits are reinvested at the end of each year. CAGR smooths out volatility and provides a more accurate picture of an investment’s sustained growth performance over several years.
The formula for CAGR is:
$$ text{CAGR} = left( left( frac{text{Current Value}}{text{Past Value}} right)^{frac{1}{text{Number of Years}}} – 1 right) times 100% $$
Example: An investment grew from $10,000 to $14,500 over 5 years.
$$ text{CAGR} = left( left( frac{$14,500}{$10,000} right)^{frac{1}{5}} – 1 right) times 100% $$
$$ text{CAGR} = left( (1.45)^{0.2} – 1 right) times 100% $$
$$ text{CAGR} = (1.077 – 1) times 100% = 7.7% $$
This means the investment grew at an average annual rate of 7.7% per year, compounded.
The Limitations of Growth Figures
Percentage growth is a powerful metric, but it tells only part of the story.
-
Context is Key: A 100% growth on a $100 investment ($100 profit) is vastly different from 10% growth on a $1,000,000 investment ($100,000 profit). Absolute numbers often provide necessary context.
-
Starting From a Low Base: A small, nascent business might show astronomically high percentage growth (e.g., 500%) simply because its initial revenue was very low. While impressive, this growth rate is unlikely to be sustainable as the business scales.
-
Excluding Other Factors: Growth figures don’t account for risk, industry specifics, competitive landscape, or macroeconomic conditions. A high growth rate in a highly volatile market might not be as desirable as moderate growth in a stable environment.
Advanced Techniques and Tools for Growth Analysis
While the core formula is simple, financial professionals and savvy individuals often employ tools and more advanced techniques to streamline calculations and gain deeper insights.
Utilizing Spreadsheets (Excel/Google Sheets) for Automation
Spreadsheets are invaluable for managing financial data and automating growth calculations.
-
Basic Calculations: Inputting Current Value, Past Value, and directly applying the formula in a cell is quick and efficient.
=(B2-A2)/A2(where A2 is Past Value, B2 is Current Value)
-
CAGR Function: Excel and Google Sheets have built-in functions that simplify CAGR calculation. For example, the
RRIfunction in Excel orRATEcan be adapted. More commonly, the formula can be entered directly:=( (B2/A2)^(1/C2) - 1 )where C2 is the number of years. -
Tracking Over Time: You can set up columns for each month or year and automatically calculate rolling growth percentages, helping you spot trends instantly.
Introducing Compound Annual Growth Rate (CAGR)
As discussed, CAGR is preferred for multi-period analysis because it gives a smoothed average annual growth rate, assuming reinvestment. This is particularly useful for comparing investments that have been held for different durations or that experienced varying levels of volatility. It allows for an “apples-to-apples” comparison of performance over time. When analyzing returns from stocks, mutual funds, or real estate held for several years, CAGR provides a more representative figure than simple total growth divided by years.

Visualizing Growth Trends
Numbers alone can sometimes obscure patterns. Visualizing growth data makes it far more intuitive and easier to interpret.
-
Line Charts: These are ideal for showing growth over time. Plotting values (e.g., revenue, portfolio value) on the Y-axis against time (months, years) on the X-axis instantly reveals upward or downward trends, as well as periods of acceleration or deceleration.
-
Bar Charts: Useful for comparing growth percentages across different entities (e.g., product lines, investment funds) for the same period.
-
Growth Rate Charts: Instead of plotting absolute values, plotting the percentage growth itself each period can highlight volatility and periods of exceptional or poor performance.
By integrating these visualization techniques with your growth calculations, you can transform raw data into compelling narratives that inform strategic decisions and communicate financial performance effectively.
In conclusion, the ability to accurately calculate and interpret percentage of growth is an indispensable skill in the realm of finance. From managing personal wealth to steering corporate strategy, this fundamental metric provides the clarity needed to measure progress, identify opportunities, and mitigate risks. By understanding its nuances, leveraging the right tools, and considering its limitations, you can unlock deeper insights into financial performance and make more informed decisions for a prosperous future.
aViewFromTheCave is a participant in the Amazon Services LLC Associates Program, an affiliate advertising program designed to provide a means for sites to earn advertising fees by advertising and linking to Amazon.com. Amazon, the Amazon logo, AmazonSupply, and the AmazonSupply logo are trademarks of Amazon.com, Inc. or its affiliates. As an Amazon Associate we earn affiliate commissions from qualifying purchases.