
Percentages are more than just abstract mathematical concepts; they are the bedrock of informed financial decision-making in nearly every aspect of life. From deciphering a sales discount to calculating investment returns, understanding how to figure the percentage of a number empowers individuals and businesses alike to make smarter choices. In a world increasingly driven by data and financial metrics, mastering this fundamental skill isn’t just beneficial—it’s essential for navigating personal finance, optimizing investments, and ensuring business health.
This comprehensive guide will demystify percentage calculations, placing them firmly within the context of money management. We’ll explore the core mechanics, delve into their pervasive applications in personal finance and investing, and examine their critical role in business analysis. By the end, you’ll not only know how to figure a percentage but also why it’s a non-negotiable skill for financial literacy and success.

The Foundational Mechanics: Understanding Percentage Calculations
At its core, a percentage represents a portion of a whole, expressed as a fraction of 100. The term “percent” literally means “per hundred.” This simple concept is incredibly powerful because it standardizes comparisons, allowing us to evaluate different quantities on a common scale.
What is a Percentage and Why Does it Matter Financially?
A percentage is essentially a ratio or a fraction where the denominator is always 100. For instance, 25% means 25 out of 100. In finance, this standardization is invaluable. It allows us to compare the performance of different investments, understand the magnitude of an interest rate, or gauge the proportion of a budget allocated to a specific expense, regardless of the absolute numbers involved. Without percentages, comparing a $10 discount on a $100 item to a $50 discount on a $1000 item would require more complex thought; with percentages, we immediately see that both are 10% savings.
The Basic Formula: Part / Whole × 100
The universal formula for calculating a percentage is straightforward:
Percentage = (Part / Whole) × 100
Let’s break down the components:
- Part: This is the specific amount or quantity you are interested in expressing as a percentage. It’s the portion of the whole.
- Whole: This is the total amount or quantity against which the “part” is being compared. It represents the entire entity.
- × 100: Multiplying by 100 converts the decimal fraction into a percentage, giving it the “%” symbol.
Example: If you spent $300 on groceries out of a total monthly income of $3000, you would calculate:
(300 / 3000) × 100 = 0.10 × 100 = 10%.
This tells you that 10% of your income goes towards groceries.
Converting Between Decimals, Fractions, and Percentages
Fluency in converting between these forms is crucial for financial calculations, especially when using calculators or spreadsheets.
- Decimal to Percentage: Multiply the decimal by 100 and add the percent sign.
- Example: 0.10 becomes 10%.
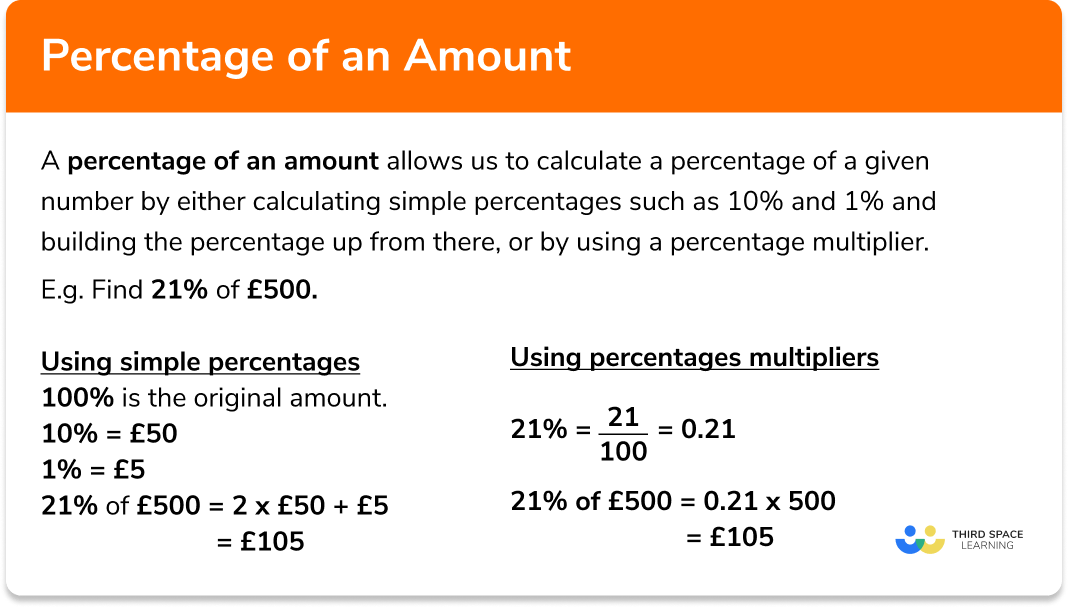
- Percentage to Decimal: Divide the percentage by 100 (or move the decimal point two places to the left).
- Example: 10% becomes 0.10. This is frequently needed when applying percentages in formulas (e.g., calculating interest: Principal × Rate (as a decimal) × Time).
- Fraction to Percentage: Convert the fraction to a decimal by dividing the numerator by the denominator, then multiply by 100.
- Example: 1/4 becomes 0.25, which is 25%.
Mastering these conversions is the first step towards confidently applying percentages to real-world financial scenarios.
Percentages in Personal Finance: Mastering Your Money
For individuals, understanding percentages is not just an academic exercise; it’s a vital tool for managing daily finances, making informed purchasing decisions, and planning for the future. From budgeting to borrowing, percentages shape our financial landscape.
Budgeting and Expense Tracking: Allocating Your Income
A fundamental use of percentages in personal finance is budgeting. By expressing expenses as a percentage of your total income, you gain a clear picture of where your money is going and can identify areas for adjustment.
- Rule of Thumb: Many financial advisors recommend the 50/30/20 rule: 50% of income for needs, 30% for wants, and 20% for savings and debt repayment. These are all percentage-based allocations.
- Calculating Expense Ratios: If your rent is $1,000 and your take-home pay is $4,000, your housing expense is ($1,000 / $4,000) × 100 = 25% of your income. This quickly tells you if you’re over-allocated in one area.
- Savings Goals: Setting a goal to save 15% of every paycheck becomes easily measurable and trackable using percentages.
Discounts, Sales, and Markups: Smart Shopping and Pricing
Understanding how percentages work allows you to confidently navigate sales, calculate true savings, and even determine a fair tip.
- Calculating a Discount: If an item costs $200 and is 25% off, the discount amount is $200 × 0.25 = $50. The final price is $200 – $50 = $150. Alternatively, you can calculate the price directly: $200 × (1 – 0.25) = $200 × 0.75 = $150.
- Markups: In retail, understanding markups (e.g., a store sells an item for 50% above its cost) helps grasp pricing strategies.
- Tips and Gratuities: Quickly calculating a 15% or 20% tip on a bill is a common everyday application. For a $60 bill, a 20% tip is $60 × 0.20 = $12.
Loan Interest Rates and Payments: The Cost of Borrowing
Interest rates are almost universally expressed as percentages, and understanding them is crucial for anyone taking out a loan or carrying a credit card balance.
- Simple Interest: The simplest form is Principal × Rate × Time. If you borrow $1,000 at 5% simple interest for one year, the interest owed is $1,000 × 0.05 × 1 = $50.
- Credit Card Interest: Credit cards often have high Annual Percentage Rates (APRs). If you carry a $1,000 balance at an 18% APR, the monthly interest could be $1,000 × (0.18 / 12) = $15 (this is a simplified example, as credit card interest compounds daily). Understanding this helps illustrate the high cost of revolving debt.
Investing and Wealth Building: Leveraging Percentage Growth
In the realm of investments, percentages are the language of growth, returns, and risk. They enable investors to compare performance, allocate assets, and understand the power of compounding.
Investment Returns and Performance Comparison
When evaluating investments, percentages provide a standardized metric for success or failure.
- Return on Investment (ROI): Calculated as ((Current Value – Original Cost) / Original Cost) × 100. If you invested $5,000 and it grew to $6,000, your ROI is (($6,000 – $5,000) / $5,000) × 100 = 20%.
- Annualized Returns: This allows comparison of investments held for different durations, standardizing returns to a yearly rate.
- Percentage Change in Stock Prices: Daily news reports stock market movements in percentages (e.g., “The S&P 500 rose 1.2%”). This provides a quick snapshot of market sentiment and individual stock performance.
Portfolio Allocation and Diversification
Smart investors use percentages to allocate their assets across different investment types (stocks, bonds, real estate, cash) based on their risk tolerance and financial goals.
- Asset Allocation: A common strategy might be 60% stocks, 30% bonds, 10% cash. These percentages need to be maintained through rebalancing as market values shift.
- Diversification: Understanding what percentage of your portfolio is exposed to a single stock, sector, or asset class is critical for managing risk. Over-concentration in one area means a disproportionate impact if that area performs poorly.
Compound Interest and Exponential Growth
Perhaps the most magical application of percentages in wealth building is compound interest. This is interest earned not only on the initial principal but also on the accumulated interest from previous periods.
- The “Eighth Wonder of the World”: Albert Einstein is often quoted as calling compound interest the eighth wonder of the world. It’s why starting to invest early, even small amounts, can lead to substantial wealth over time.
- Calculating Future Value: While the formula can be complex for manual calculation, understanding that a consistent annual percentage return (e.g., 7% per year) can significantly multiply your initial investment over decades is empowering. For example, $1,000 invested at 7% compounded annually will be worth approximately $7,612 after 30 years—a 661% gain.
Business Finance: Percentages for Strategic Insight
For businesses, percentages are not merely useful; they are indispensable for analyzing performance, making strategic decisions, and communicating financial health to stakeholders. From small startups to multinational corporations, percentage-based metrics drive operational efficiency and growth strategies.
Profit Margins and Revenue Growth: Gauging Performance
Businesses rely on percentages to understand their profitability at various levels and to track growth over time.
- Gross Profit Margin: (Gross Profit / Revenue) × 100. This reveals how much profit a company makes from its sales after accounting for the direct costs of goods sold. A high gross margin indicates efficient production or strong pricing power.
- Net Profit Margin: (Net Income / Revenue) × 100. This is the ultimate measure of a company’s profitability, showing what percentage of revenue is left after all expenses, including taxes and interest, have been paid.
- Revenue Growth Rate: ((Current Revenue – Previous Revenue) / Previous Revenue) × 100. This percentage indicates how quickly a company’s sales are increasing, a key indicator for investors and management.
Market Share and Sales Performance: Competitive Analysis
Percentages help businesses understand their standing within their industry and evaluate the effectiveness of their sales efforts.
- Market Share: (Company’s Sales / Total Market Sales) × 100. This metric shows what proportion of the total market a company controls, providing insight into its competitive position and influence.
- Sales Conversion Rate: (Number of Sales / Number of Leads) × 100. This percentage measures the effectiveness of sales and marketing efforts, showing how many prospects turn into paying customers.
- Customer Retention Rate: (Number of Customers at End of Period – New Customers Acquired / Number of Customers at Start of Period) × 100. A high retention rate (expressed as a percentage) signifies customer satisfaction and loyalty, crucial for long-term growth.
Financial Ratios and Cost Analysis: Operational Efficiency
A vast array of financial ratios, all expressed as percentages, provide deep insights into a company’s liquidity, solvency, efficiency, and profitability.
- Debt-to-Equity Ratio: (Total Debt / Shareholder Equity) × 100. While not always expressed as a percentage, understanding the proportion of debt to equity is vital for assessing financial leverage and risk.
- Current Ratio: (Current Assets / Current Liabilities). Although often presented as a raw ratio (e.g., 2:1), converting it mentally to percentages (e.g., current assets are 200% of current liabilities) aids interpretation of short-term liquidity.
- Cost of Goods Sold as a Percentage of Revenue: Monitoring this percentage helps identify inefficiencies in production or supply chain management. If this percentage increases, it means the company is spending more to produce each dollar of revenue, potentially eroding profits.
Leveraging Tools for Accurate Percentage Calculations
While understanding the manual process is crucial, modern financial management benefits immensely from readily available tools that streamline calculations and minimize error.
Calculators and Spreadsheets: Your Digital Assistants
For most personal and business calculations, standard calculators and spreadsheet software are indispensable.
- Handheld Calculators: For quick, on-the-spot calculations, a basic calculator is sufficient for discounts, tips, or simple interest.
- Spreadsheets (Excel, Google Sheets): These are powerful tools for more complex financial modeling, budgeting, and investment tracking.
- Formulas: You can easily input percentage formulas (e.g.,
=A2/B2*100to find the percentage of A2 relative to B2) and apply them across large datasets. - Percentage Formatting: Spreadsheets allow you to format cells directly as percentages, simplifying input and display.
- What-if Scenarios: You can change an input (e.g., an interest rate or a savings percentage) and instantly see the impact on other figures, aiding in financial planning.
- Formulas: You can easily input percentage formulas (e.g.,
Online Calculators and Financial Apps: Specialized Solutions
The digital age offers a plethora of specialized tools designed to handle specific percentage-based financial calculations.
- Mortgage Calculators: These compute monthly payments, total interest paid, and amortization schedules, all based on interest rates (percentages).
- Loan Calculators: Similar to mortgage calculators, for personal loans, car loans, etc.
- Investment Return Calculators: Tools to project compound growth, calculate ROI for specific periods, or compare different investment options.
- Budgeting Apps: Many apps automatically categorize spending and display it as percentages of your income or budget categories, offering real-time financial insights.
The Importance of Double-Checking and Understanding the Context
Even with advanced tools, understanding the underlying percentage calculation is vital. Always double-check results, especially for significant financial decisions. Moreover, percentages derive their meaning from context. A 5% increase in a small startup’s revenue might be less impressive than a 1% increase for a multi-billion dollar corporation. Always consider the “whole” and the specific scenario when interpreting a percentage.

Conclusion: The Power of Percentage Proficiency
In the intricate world of money, percentages serve as a universal translator, simplifying complex financial data into digestible and comparable insights. From managing personal budgets and navigating consumer choices to optimizing investment portfolios and driving business growth, the ability to figure the percentage of a number is not just a mathematical skill—it’s a critical component of financial literacy and empowerment.
By mastering the basic formula, understanding conversions, and applying these concepts across personal finance, investing, and business operations, you equip yourself with an invaluable tool. Embrace calculators and spreadsheets as your allies, but never lose sight of the fundamental principles. With a solid grasp of percentages, you gain clarity, confidence, and control, allowing you to make smarter financial decisions that pave the way for lasting prosperity. The journey to financial mastery begins with this simple, yet profoundly powerful, concept.
aViewFromTheCave is a participant in the Amazon Services LLC Associates Program, an affiliate advertising program designed to provide a means for sites to earn advertising fees by advertising and linking to Amazon.com. Amazon, the Amazon logo, AmazonSupply, and the AmazonSupply logo are trademarks of Amazon.com, Inc. or its affiliates. As an Amazon Associate we earn affiliate commissions from qualifying purchases.