
In the realms of personal finance, corporate accounting, and professional investing, the ability to calculate and interpret percentage increases is a fundamental skill. It is the primary metric by which we measure growth, evaluate the success of a strategy, and determine the velocity of wealth accumulation. Whether you are analyzing the quarterly revenue growth of a Fortune 500 company, assessing the appreciation of a real estate asset, or negotiating a salary increase, understanding the mechanics of percentage change allows for data-driven decision-making.
Percentage increase provides a standardized way to compare growth across different scales. While absolute numbers provide the “what,” percentages provide the “how much” in relation to the starting point, offering a clearer picture of performance and momentum. In a financial context, this clarity is the difference between a superficial observation and a strategic insight.
The Mathematical Framework of Financial Growth
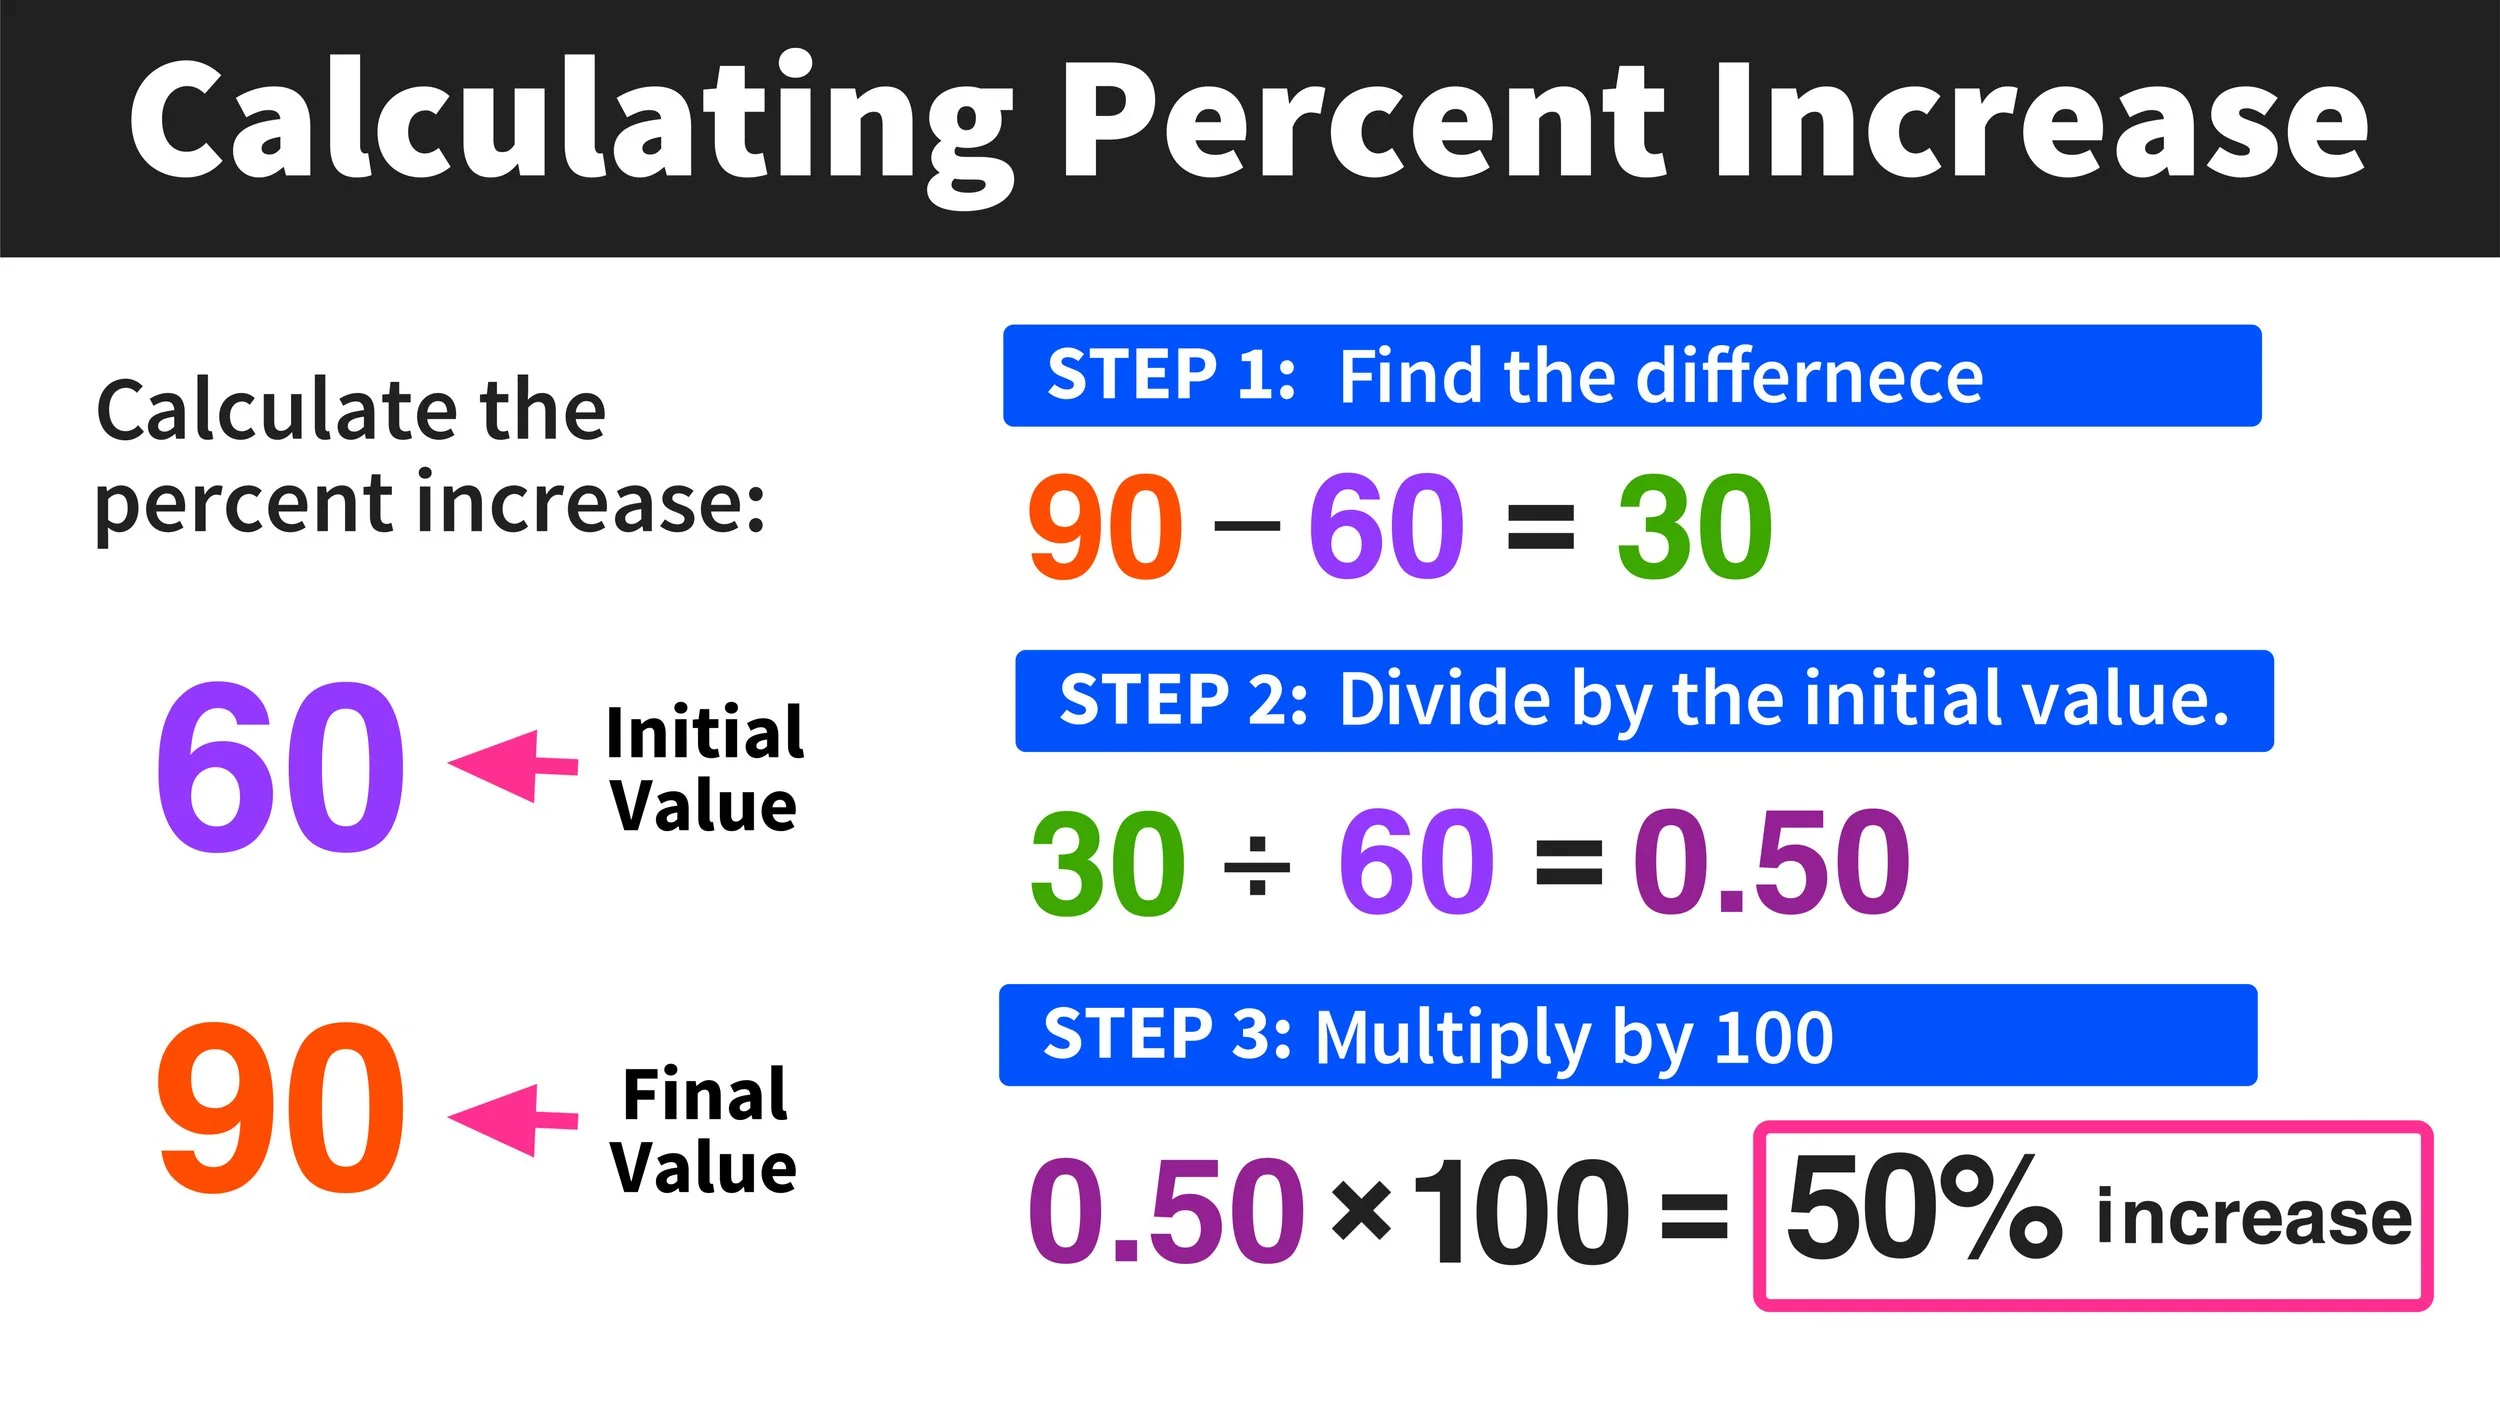
At its core, determining a percentage increase is a straightforward mathematical process, yet its applications in business finance are multifaceted. The standard formula used by analysts and accountants worldwide is:
Percentage Increase = [(New Value – Original Value) / Original Value] × 100
To arrive at the correct figure, one must first identify the “base” or “original” value. This is the figure representing the starting point of the period being analyzed. The “new” value represents the figure at the end of that period. By subtracting the original value from the new value, you determine the absolute increase. Dividing that absolute increase by the original value gives you the decimal representation of growth, which is then multiplied by 100 to reach the final percentage.
The Importance of the Base Value
In finance, the denominator—the original value—is the most critical component. A common mistake in financial reporting is using the wrong base, which can lead to a fundamental misunderstanding of growth. For instance, if a startup’s revenue grows from $100,000 to $150,000, the increase is 50%. However, if the revenue then grows from $150,000 back to $200,000, the absolute increase is the same ($50,000), but the percentage increase drops to 33.3%. This illustrates the law of diminishing returns in growth percentages: as the base grows, maintaining high percentage increases becomes exponentially more difficult.
Comparative Analysis: Beyond the Formula
While the formula provides the numerical output, the professional financier looks at the context. An increase of 5% in a high-inflation environment might actually represent a loss in purchasing power, whereas a 2% increase in a deflationary environment could represent significant gain. Therefore, the “increase” must always be measured against benchmarks such as the Consumer Price Index (CPI), industry averages, or historical performance.
Strategic Investment Analysis: Measuring Gains and Portfolio Velocity
For investors, determining the percentage increase is the primary method for calculating Return on Investment (ROI). This metric allows an investor to compare the performance of a high-growth tech stock against a stable dividend-paying utility or a piece of commercial real estate.
Calculating Capital Appreciation
When evaluating an asset’s performance, the percentage increase represents capital appreciation. If an investor purchases shares at $200 and the market price rises to $250, the 25% increase indicates the strength of the investment relative to the capital deployed. However, sophisticated investors often look at “Total Return,” which factors in dividends or interest earned during the holding period. In this case, the “New Value” in our formula would be the current price plus any distributions received.
The Impact of Volatility and the “Recovery Math”
One of the most vital lessons in investment finance involves the relationship between percentage decreases and the subsequent percentage increases required to break even. This is known as the “math of recovery.” If a portfolio suffers a 20% loss, it does not require a 20% increase to return to its original value; it requires a 25% increase. If it suffers a 50% loss, it requires a 100% increase to recover. Understanding how to determine these percentages is crucial for risk management and setting realistic expectations for portfolio recovery.
Compound Annual Growth Rate (CAGR)
For long-term investments, a simple percentage increase between the start and end dates can be misleading because it ignores the effect of time. Investors instead use the Compound Annual Growth Rate (CAGR). This formula smoothes out the annual fluctuations to provide a geometric progression ratio that provides a constant rate of return over the time period. While the simple percentage increase tells you how much you made in total, the CAGR tells you how efficiently your money worked for you each year.
Corporate Finance: Analyzing Revenue and Profitability Metrics
In the corporate world, percentage increases are the lifeblood of quarterly earnings reports and strategic planning. Management teams and shareholders use these figures to determine if a company is scaling effectively or if its growth is stagnating.
Year-over-Year (YoY) and Quarter-over-Quarter (QoQ) Growth
Financial analysts rarely look at a single month’s data in isolation. Instead, they use Year-over-Year (YoY) calculations to determine the percentage increase compared to the same period in the previous year. This method accounts for seasonality. For example, a retail business may see a massive percentage increase in revenue in December compared to November, but the more telling metric is the percentage increase in December revenue compared to the previous December. A positive YoY percentage increase suggests sustainable growth, whereas a QoQ increase might just reflect seasonal trends.
Margin Expansion and Operating Leverage
Beyond top-line revenue, determining the percentage increase in profit margins is a key indicator of operational efficiency. If a company’s revenue increases by 10%, but its net income increases by 20%, the company is experiencing “margin expansion.” This indicates that the business is becoming more efficient, controlling costs, or benefiting from economies of scale. Analyzing the percentage increase of the “bottom line” (net profit) relative to the “top line” (revenue) allows executives to identify whether the company is truly becoming more valuable or simply getting larger.
Evaluating Market Share
A business may see a 10% increase in sales, which seems positive in a vacuum. However, if the overall industry grew by 20% in the same period, the business has actually lost market share. By determining the percentage increase of the total market and comparing it to the company’s internal growth percentage, leadership can determine their competitive standing.
Personal Finance and Wealth Management
On an individual level, mastering percentage calculations is essential for managing a household budget, negotiating compensation, and planning for retirement.
Salary Negotiations and Cost of Living Adjustments
When an employer offers a raise, it is typically presented as a percentage. Understanding how to calculate this increase allows a professional to determine if the raise is a “real” increase or merely a cost-of-living adjustment. For example, if the annual inflation rate is 4% and an employee receives a 3% raise, their nominal income has increased, but their real purchasing power has decreased by 1%. By calculating the percentage increase in their expenses and comparing it to the percentage increase in their income, individuals can maintain a clear view of their financial health.
Debt Reduction and Interest Impact
Percentage increases also apply to the liabilities side of a balance sheet. Credit card interest and adjustable-rate mortgages are predicated on percentage points. A “small” increase in an interest rate—for instance, from 4% to 5%—is actually a 25% increase in the cost of borrowing. Being able to calculate these shifts allows consumers to decide when to refinance debt or accelerate payments to avoid compounding interest costs.
Savings Rate and Wealth Velocity
Financial independence is often determined by the “savings rate,” which is the percentage increase of one’s net worth over a specific period. By calculating the percentage of income that is diverted into investments, an individual can project their “time to retirement.” An increase in the savings rate from 10% to 15% of income represents a 50% increase in the velocity of wealth building, which can shave years off a career timeline.
Precision and Accuracy in Financial Reporting
In professional finance, the precision of a percentage increase calculation can have significant legal and ethical implications. Rounding errors or the use of inconsistent data sets can lead to “misleading” financial statements, which can trigger audits or erode investor trust.
Real vs. Nominal Increases
A sophisticated financial analysis always distinguishes between nominal percentage increases (the raw numbers) and real percentage increases (adjusted for inflation). To determine the real increase, one must subtract the inflation rate from the nominal growth rate. This is particularly important for long-term bond yields and pension fund projections, where the primary goal is to preserve and grow purchasing power over decades.
Using Technology for High-Volume Calculations
While the manual formula is vital for conceptual understanding, modern financial tools—ranging from Excel and Google Sheets to advanced ERP (Enterprise Resource Planning) software—automate these calculations. Using the formula =(New-Old)/Old and formatting the cell as a percentage is the standard practice in financial modeling. These tools also allow for “sensitivity analysis,” where an analyst can change the variables to see how different percentage increases in costs or sales would impact the overall health of the business.

Conclusion
Determining the percentage increase is more than a mathematical exercise; it is a lens through which financial health is viewed. For the investor, it is the measure of success; for the business owner, it is the roadmap for scaling; and for the individual, it is the key to personal prosperity. By consistently applying the formula and analyzing the results within the broader economic context, one can move beyond simple observation and begin to master the quantitative side of money management. Understanding the “why” behind the “percent” ensures that every financial move is backed by data, leading to more predictable and robust financial outcomes.
aViewFromTheCave is a participant in the Amazon Services LLC Associates Program, an affiliate advertising program designed to provide a means for sites to earn advertising fees by advertising and linking to Amazon.com. Amazon, the Amazon logo, AmazonSupply, and the AmazonSupply logo are trademarks of Amazon.com, Inc. or its affiliates. As an Amazon Associate we earn affiliate commissions from qualifying purchases.