In the world of finance, numbers are the language of progress. Whether you are tracking the growth of a stock portfolio, measuring the expansion of a business’s quarterly revenue, or assessing the impact of inflation on your purchasing power, the ability to calculate a percentage increase is a fundamental skill. It transforms raw data into meaningful insights, allowing investors and business owners to compare performance across different scales and timeframes.
Understanding the percentage increase between two numbers is not merely a mathematical exercise; it is a pillar of financial literacy. It provides a standardized way to express how much a value has grown relative to its starting point, offering a clearer picture than absolute figures alone. This guide explores the mechanics of this calculation and its critical applications across the spectrum of personal and business finance.
The Mathematical Foundation of Percentage Increase
At its core, calculating a percentage increase involves determining the “relative change” between an initial value and a final value. While absolute change tells you the literal difference (e.g., “I earned $100 more this month”), the percentage increase provides context (e.g., “My income grew by 10%”).
The Universal Formula for Growth
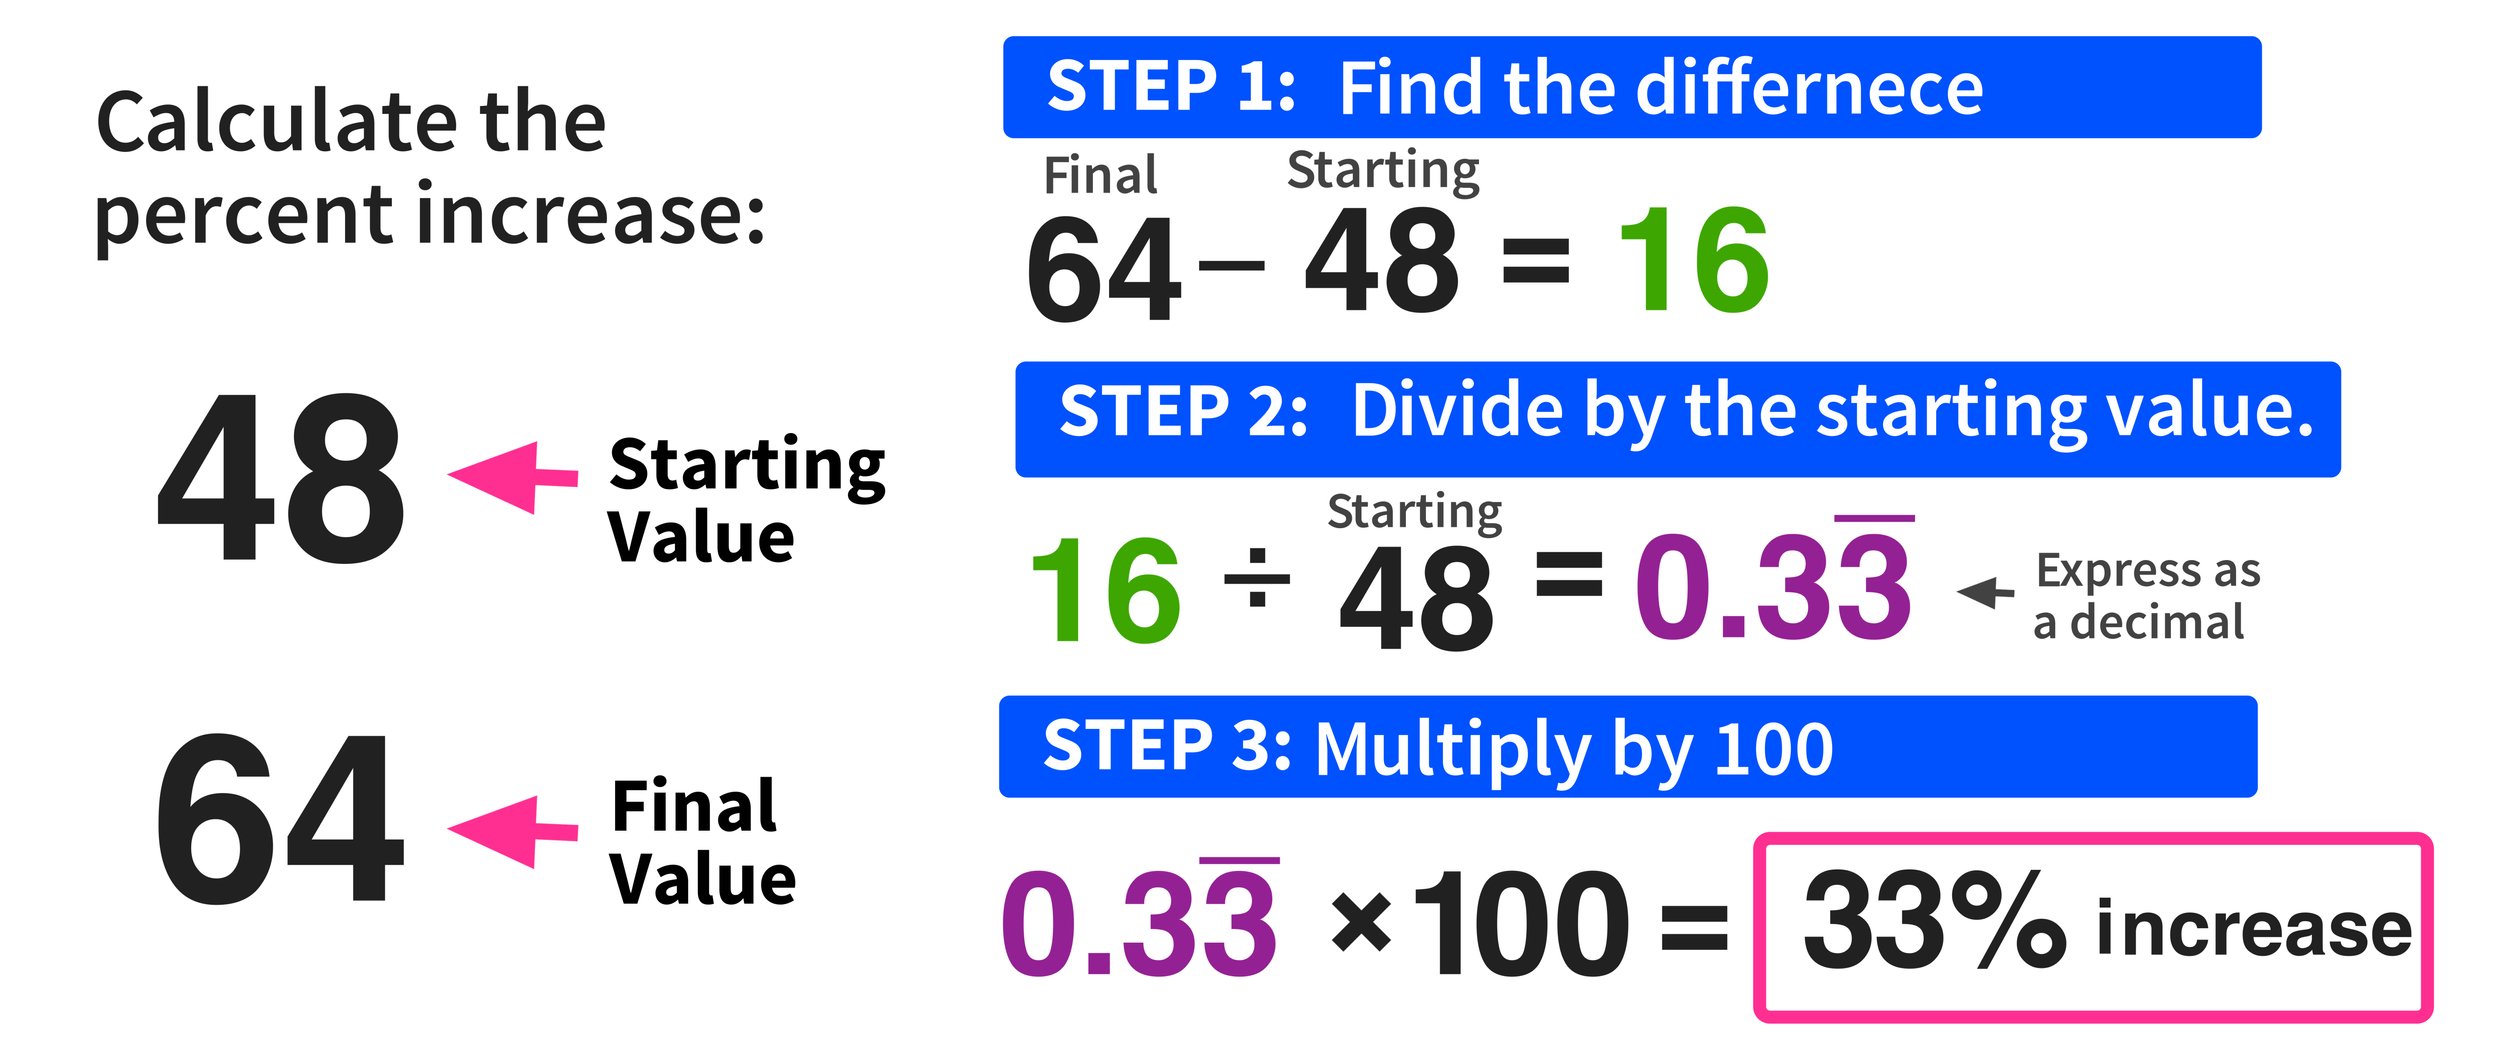
To calculate the percentage increase, you follow a straightforward three-step process. First, subtract the original value (the “old” number) from the new value to find the absolute increase. Second, divide that increase by the original value. Finally, multiply the result by 100 to convert the decimal into a percentage.
The formula is expressed as:
((New Value – Original Value) / Original Value) × 100 = Percentage Increase
Understanding the Importance of the Base Value
The denominator in our formula—the original value—is the most critical component. In financial analysis, this is often referred to as the “base.” The same absolute increase can represent a massive jump or a negligible ripple depending on the base. For instance, a $1,000 increase on a $1,000 investment is a 100% gain, whereas a $1,000 increase on a $100,000 investment is a mere 1% gain. Precision in selecting the correct starting point is vital for accurate reporting.
Distinguishing Between Increase and Decrease
While this guide focuses on growth, the formula is versatile. If the result of your calculation is negative, you have identified a percentage decrease. In the context of “Money,” distinguishing between these two is the difference between reporting a profit or a loss. In financial statements, these are often color-coded—green for increases and red for decreases—to provide an immediate visual cue of financial health.
Measuring Investment Performance and Portfolio Growth
For the individual investor, the percentage increase is the primary metric for evaluating the success of an asset allocation strategy. It allows for an “apples-to-apples” comparison between disparate asset classes, such as real estate, equities, and bonds.
Tracking Asset Appreciation and ROI
Return on Investment (ROI) is perhaps the most common application of percentage increase in the financial sector. If you purchased a share of a tech company at $150 and it is now trading at $210, the absolute gain is $60. By applying the formula—((210 – 150) / 150) × 100—you determine a 40% increase. This percentage allows you to compare that stock’s performance against a savings account or a mutual fund, regardless of the initial dollar amount invested.
The Role of Dividends in Total Return
When calculating growth in a financial context, it is important to distinguish between price appreciation and “total return.” Total return includes the percentage increase of the asset price plus any dividends or interest earned. For a comprehensive financial analysis, an investor would add the dividends received to the “New Value” before performing the calculation. This provides a more holistic view of how much wealth the investment has actually generated.
Simple Growth vs. Compound Annual Growth Rate (CAGR)
While a simple percentage increase tells you how much an investment grew over a total period, it doesn’t account for the fluctuations that happen in between. This is where the Compound Annual Growth Rate (CAGR) becomes relevant. While the basic percentage increase formula gives you the “what,” CAGR provides the “how fast” by smoothing out the growth over a specific number of years. For long-term wealth building, understanding both metrics is essential for setting realistic expectations for retirement or capital expenditures.
Navigating Corporate Finance and Business Metrics
In the corporate world, percentage increases are the Key Performance Indicators (KPIs) that dictate strategy, hiring, and scaling. Businesses use these calculations to communicate their trajectory to stakeholders and to identify areas of inefficiency.
Revenue and Profit Margin Expansion
A company’s health is often judged by its Year-over-Year (YoY) revenue growth. If a startup generated $500,000 in its first year and $1.2 million in its second, the 140% increase is a powerful signal to venture capitalists. However, sophisticated business finance also looks at the percentage increase in expenses. If expenses increased by 200% in that same period, the revenue growth might be unsustainable. Calculating the percentage change in profit margins—rather than just raw revenue—reveals whether a company is becoming more efficient as it grows.
Benchmarking Against Industry Competitors
Percentages allow a small business to compare itself to a global conglomerate. If a local boutique increases its online sales by 50%, it is outperforming a retail giant that only saw a 5% increase, even if the giant’s absolute dollar growth was much higher. Using percentage increases as a benchmark helps business owners understand their market share and “velocity”—the speed at which they are capturing new segments of the economy.
Customer Acquisition Cost (CAC) and Lifetime Value
In modern business finance, particularly in SaaS (Software as a Service) and e-commerce, the percentage increase in Customer Acquisition Cost is a dreaded metric. If the cost to acquire a customer increases by 20% while the Lifetime Value (LTV) of that customer only increases by 5%, the business is heading toward a liquidity crisis. Monitoring these percentages allows managers to pivot their marketing strategies before the absolute losses become unmanageable.
The Impact of Macroeconomics on Personal Wealth
Financial planning does not happen in a vacuum. External economic forces constantly shift the value of money, and calculating percentage increases is the only way to track these shifts accurately.
Calculating the Erosion of Purchasing Power (Inflation)
Inflation is defined as the percentage increase in the price of a basket of goods and services over time. If the Consumer Price Index (CPI) shows a 7% annual increase, your money is effectively losing 7% of its value if your income remains stagnant. By calculating the percentage increase in your own cost of living—comparing last year’s utility and grocery bills to this year’s—you can determine your “personal inflation rate.” This is a crucial step in personal finance to ensure your savings goals are still sufficient to cover future costs.
Adjusting for “Real” vs. “Nominal” Gains
In the “Money” niche, professional analysts distinguish between nominal growth (the raw percentage increase) and real growth (the increase after adjusting for inflation). If your high-yield savings account offers a 4% interest rate, but inflation is at 5%, your “real” percentage change is actually a 1% decrease in purchasing power. Learning to calculate these relative differences prevents the “money illusion,” where individuals feel wealthier because they have more currency, even though that currency buys less.
The Dynamics of Interest Rates and Debt
For those managing debt, such as mortgages or credit cards, the percentage increase in interest rates can have a massive impact on monthly cash flow. When a central bank raises rates from 3% to 4%, it is not a “1% increase” in the traditional sense; it is a 33.3% increase in the cost of borrowing. Understanding how to calculate the percentage change between two interest rates helps homeowners decide when to refinance and helps businesses decide when to take on leverage for expansion.
Financial Tools and Automated Calculation Methods
While the manual formula is vital for understanding the logic, the modern financial landscape offers various tools to automate these calculations, reducing the risk of human error in complex spreadsheets.
Mastering Excel and Google Sheets
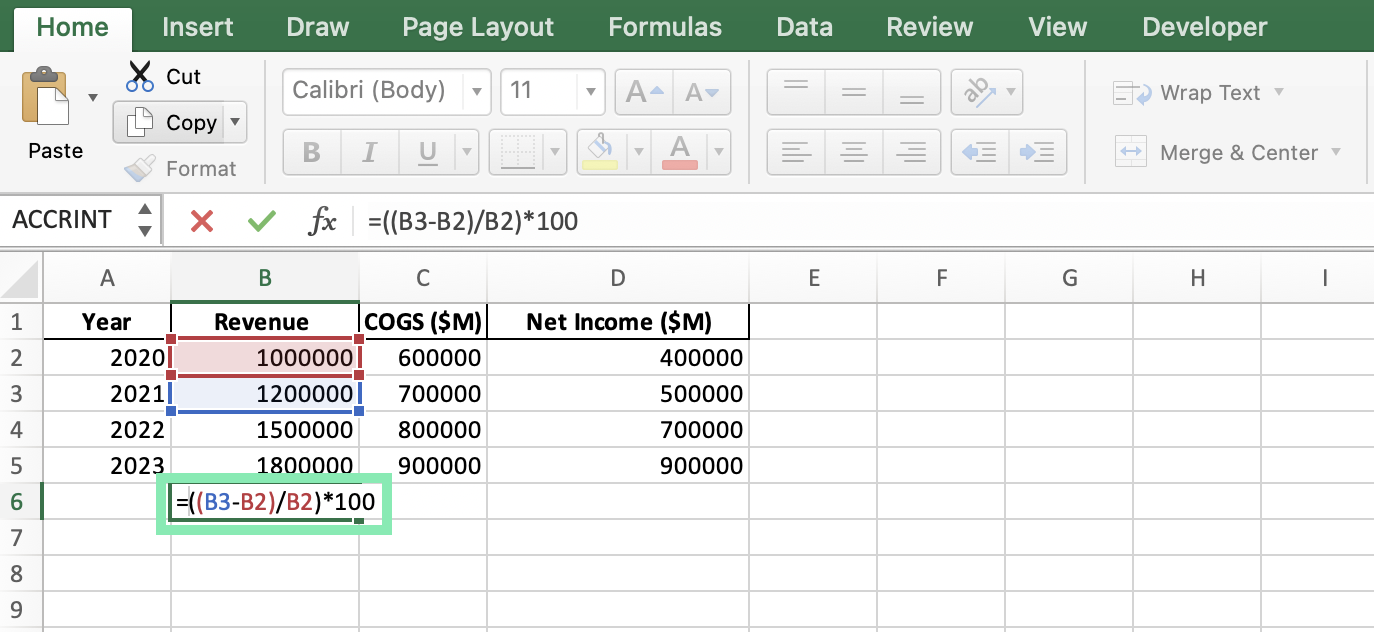
For anyone serious about business or personal finance, Excel is the ultimate tool. To calculate percentage increase in a spreadsheet, you would use a formula like =(B2-A2)/A2, where A2 is the original value and B2 is the new value. After entering the formula, you simply format the cell as a percentage. This allows you to track thousands of data points—such as daily stock price changes or monthly inventory costs—with perfect accuracy and speed.
Leveraging Financial Apps and FinTech
Today’s FinTech ecosystem is built on the automated calculation of percentage increases. Apps like Mint, YNAB (You Need A Budget), or brokerage platforms like Robinhood and Fidelity provide real-time percentage updates on your net worth and portfolio performance. These tools often use “Time-Weighted Returns” to ensure that your own deposits or withdrawals don’t skew the percentage increase of the underlying investments, providing a professional-grade analysis for the everyday user.

The Importance of Verification
Regardless of the tool used, a savvy financial mind always performs a “sanity check.” By understanding the manual calculation—(New-Old)/Old—you can quickly spot errors in a software output. In the high-stakes world of investing and business, a misplaced decimal point in a percentage calculation can lead to catastrophic misallocations of capital. Being able to run the numbers mentally or on a scratchpad remains an indispensable skill for anyone looking to master their money.
aViewFromTheCave is a participant in the Amazon Services LLC Associates Program, an affiliate advertising program designed to provide a means for sites to earn advertising fees by advertising and linking to Amazon.com. Amazon, the Amazon logo, AmazonSupply, and the AmazonSupply logo are trademarks of Amazon.com, Inc. or its affiliates. As an Amazon Associate we earn affiliate commissions from qualifying purchases.