
The S&P 500 is arguably the most important financial benchmark in the world. Often cited as the definitive barometer for the health of the United States equity market, it tracks 500 of the largest publicly traded companies in the country. For the individual investor, understanding how this index is calculated is not merely an academic exercise; it is essential for grasping how trillions of dollars in passive investment capital flow through the global economy. Unlike a simple average of stock prices, the S&P 500 utilizes a sophisticated methodology designed to reflect the true investable market value of the American corporate landscape.
The Foundation: Understanding the Market-Cap Weighting Methodology
The primary mechanism behind the S&P 500 is a float-adjusted market capitalization weighting system. To understand this, one must first distinguish between total market capitalization and float-adjusted market capitalization. Total market capitalization is the simple product of a company’s total outstanding shares multiplied by its current share price. However, the S&P 500 seeks to represent the portion of the market that is actually available for public trading.
What is Float-Adjusted Market Capitalization?
Not all shares of a company are available for purchase on the open market. Many are held by founders, directors, government agencies, or other corporations with controlling interests. These shares are considered “locked up” and do not contribute to the daily liquidity of the stock. To provide a more accurate representation of the market, S&P Dow Jones Indices calculates the “float”—the number of shares available to the public.
By multiplying the float shares by the share price, the index determines the “investable” market cap. This ensures that a company with a high valuation but very few shares available for trade does not disproportionately influence the index. This methodology makes the S&P 500 a “valuation-weighted” index, meaning that as a company’s market value grows, its influence on the index increases proportionally.
The Difference Between Price-Weighted and Cap-Weighted Indices
To appreciate the complexity of the S&P 500, it is helpful to contrast it with the Dow Jones Industrial Average (DJIA). The DJIA is a price-weighted index, meaning it simply adds up the stock prices of its 30 components and divides by a factor. In a price-weighted system, a stock trading at $200 has twice the influence of a stock trading at $100, regardless of the actual size of the companies.
In contrast, the S&P 500’s market-cap weighting ensures that a 1% move in a trillion-dollar company like Microsoft or Apple has a much larger impact on the index than a 1% move in a company at the bottom of the list. This reflects the reality of the economy: larger companies have a more significant impact on the financial system and investor portfolios.
The Mathematical Framework: The Divisor and the Index Value
The actual number you see on financial news outlets—such as 4,500 or 5,000—is not a dollar amount. It is a ratio. To convert the massive sum of the market caps of 500 companies into a manageable number, S&P Dow Jones Indices uses a proprietary figure known as the “Index Divisor.”
The Role of the S&P Divisor
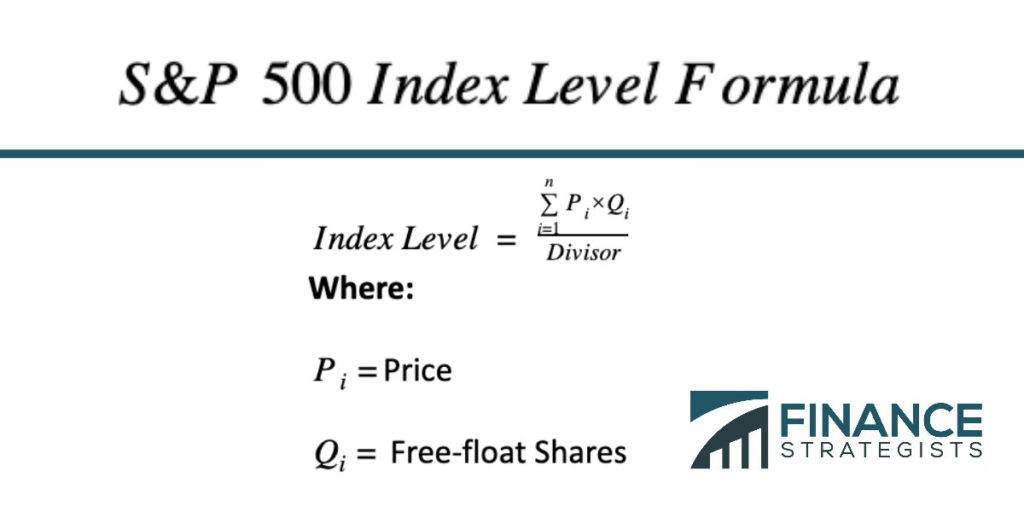
The formula for the S&P 500 index value is relatively straightforward in theory: the sum of the float-adjusted market capitalizations of all 500 companies is divided by the Index Divisor.
[ text{Index Level} = frac{sum (Pi times Qi)}{text{Divisor}} ]
Where (Pi) is the price of the individual stock and (Qi) is the number of float-adjusted shares. The divisor is the “secret sauce” that ensures the index remains consistent over time. Without it, the index value would jump or drop every time a company issued a stock split, performed a share buyback, or issued new shares, even if the underlying value of the market hadn’t changed.
Adjusting for Corporate Actions
Corporate actions occur daily. When a company in the index undergoes a merger, a spin-off, or a significant change in its share structure, the total market capitalization of the index changes due to these administrative shifts rather than market sentiment. To prevent these changes from distorting the index level, the S&P Index Committee adjusts the divisor.
For example, if a large company issues new shares to fund an acquisition, the total market cap of the 500 companies increases. To keep the index level the same, the divisor is increased. This adjustment process ensures that the S&P 500 tracks only the price performance and organic growth of the constituent companies, providing a “clean” look at market trends over decades.
Eligibility and Selection: Who Makes the Cut?
Despite its name, the S&P 500 does not simply include the 500 largest companies in America. Inclusion is governed by a strict set of eligibility criteria managed by a committee. This ensures that the index represents the “large-cap” segment of the market while maintaining quality and liquidity.
Quantitative Requirements: Liquidity and Size
To be eligible for the S&P 500, a company must meet specific financial thresholds. As of recent updates, the minimum unadjusted market capitalization for a candidate is typically in the range of $14 billion to $15 billion, though this number is adjusted periodically to reflect market conditions.
Furthermore, liquidity is paramount. A stock must have a high trading volume to ensure that index funds and institutional investors can buy and sell large blocks of the stock without causing extreme price volatility. Specifically, the ratio of annual dollar value traded to the float-adjusted market capitalization should be greater than 0.75. This filter prevents “zombie” companies or illiquid giants from skewing the index.
The Qualitative Human Element: The Index Committee
Unlike some indices that are purely algorithmic, the S&P 500 involves a human element. The S&P Dow Jones Indices Index Committee meets monthly to review the index. They look beyond the raw numbers to ensure the index remains a representative sample of the U.S. economy.
One of the most critical requirements is “financial viability.” A company must report four consecutive quarters of positive earnings according to Generally Accepted Accounting Principles (GAAP). This “profitability rule” is why some massive companies, like Tesla or Amazon, were not added to the index immediately after they became large enough; they had to prove consistent profitability first. The committee also ensures sector balance, preventing the index from becoming over-saturated with tech or finance firms, thereby maintaining its status as a diversified economic indicator.
Maintaining the Index: Rebalancing and Reconstitution
The S&P 500 is not a static list. It is a living entity that evolves as the economy shifts. The process of keeping the index current involves quarterly rebalancing and periodic reconstitution.
Quarterly Rebalancing vs. Annual Reconstitution
Rebalancing occurs on the third Friday of March, June, September, and December. During this time, the share counts and float factors of the existing constituents are updated to reflect the current reality of the market. This accounts for share buybacks and secondary offerings that have occurred over the previous three months.
Reconstitution, or the adding and removing of companies, happens as needed. When a company’s market cap falls significantly or its financial health declines, it may be removed. Conversely, rising stars that meet all eligibility requirements are added. When a company is added, a “cascading” effect often occurs in the market, as hundreds of billions of dollars in passive index funds must simultaneously purchase shares of the new entrant, often driving up its price temporarily—a phenomenon known as the “S&P 500 effect.”
Sector Neutrality and Economic Representation
A key goal of the S&P calculation and maintenance is to reflect the GICS (Global Industry Classification Standard) sectors accurately. Currently, the index is divided into eleven sectors: Information Technology, Health Care, Financials, Consumer Discretionary, Communication Services, Industrials, Consumer Staples, Energy, Utilities, Real Estate, and Materials.
The weighting of these sectors within the index fluctuates based on market performance. For instance, in the late 1970s, Energy companies made up a massive portion of the index. Today, Information Technology holds the largest weight. This shifting balance is not a manual choice by the committee but a result of the market-cap weighting; it allows the index to naturally evolve alongside the technological and economic shifts of the nation.
Why the Calculation Matters for Individual Investors
For most people, the S&P 500 is the “market.” When you buy a low-cost S&P 500 ETF or mutual fund, you are effectively buying a slice of the American economy. The calculation methodology dictates how your money is distributed.
Impact on Index Funds and ETFs
Because the S&P 500 is market-cap weighted, index funds are “self-cleansing.” As successful companies grow, they automatically take up a larger percentage of your portfolio. Conversely, as failing companies shrink, they automatically become a smaller part of your holdings until they are eventually removed from the index entirely. This “winners win” dynamic is one reason why the S&P 500 has historically been difficult for active fund managers to beat over long periods.
However, investors should also be aware of “concentration risk.” In a cap-weighted index, a handful of the largest companies can drive the entire index’s performance. If the top five companies account for 25% of the index’s weight, the index may appear to be doing well even if the other 495 companies are struggling. Understanding the calculation helps investors realize that they are more heavily exposed to the “mega-cap” tech giants than they might assume.

The S&P 500 as a Macroeconomic Barometer
Finally, the S&P 500 calculation provides insights into global capital flows. Because the index is float-adjusted and liquidity-tested, it represents the most “efficient” part of the equity market. Financial institutions use the S&P 500 to price derivatives, hedge risk, and benchmark performance. By understanding that the index is a float-adjusted, divisor-corrected representation of corporate America, investors can better interpret market movements not as random numbers, but as the collective valuation of the most productive assets in the world.
aViewFromTheCave is a participant in the Amazon Services LLC Associates Program, an affiliate advertising program designed to provide a means for sites to earn advertising fees by advertising and linking to Amazon.com. Amazon, the Amazon logo, AmazonSupply, and the AmazonSupply logo are trademarks of Amazon.com, Inc. or its affiliates. As an Amazon Associate we earn affiliate commissions from qualifying purchases.