
In the world of finance, numbers tell a story, but percentages provide the context. Whether you are tracking the growth of a retirement portfolio, analyzing the profitability of a small business, or simply trying to understand how inflation is eating into your monthly budget, knowing how to find percent increase and decrease is an essential skill. While absolute dollar amounts show you the “what,” percentages show you the “how much” in relation to where you started.
Understanding these calculations allows investors and savers to compare different financial instruments on an even playing field. A $500 gain on a $1,000 investment is vastly different from a $500 gain on a $100,000 investment. This guide will walk you through the fundamental formulas, their applications in personal and business finance, and the nuances of interpreting these figures to make better money decisions.

Understanding the Mechanics of Financial Growth and Decline
At its core, calculating a percentage change is about measuring the “distance” between two points in time. In financial terms, this usually refers to the change in value of an asset, an expense, or a revenue stream.
The Formula for Percent Increase: Measuring Your Gains
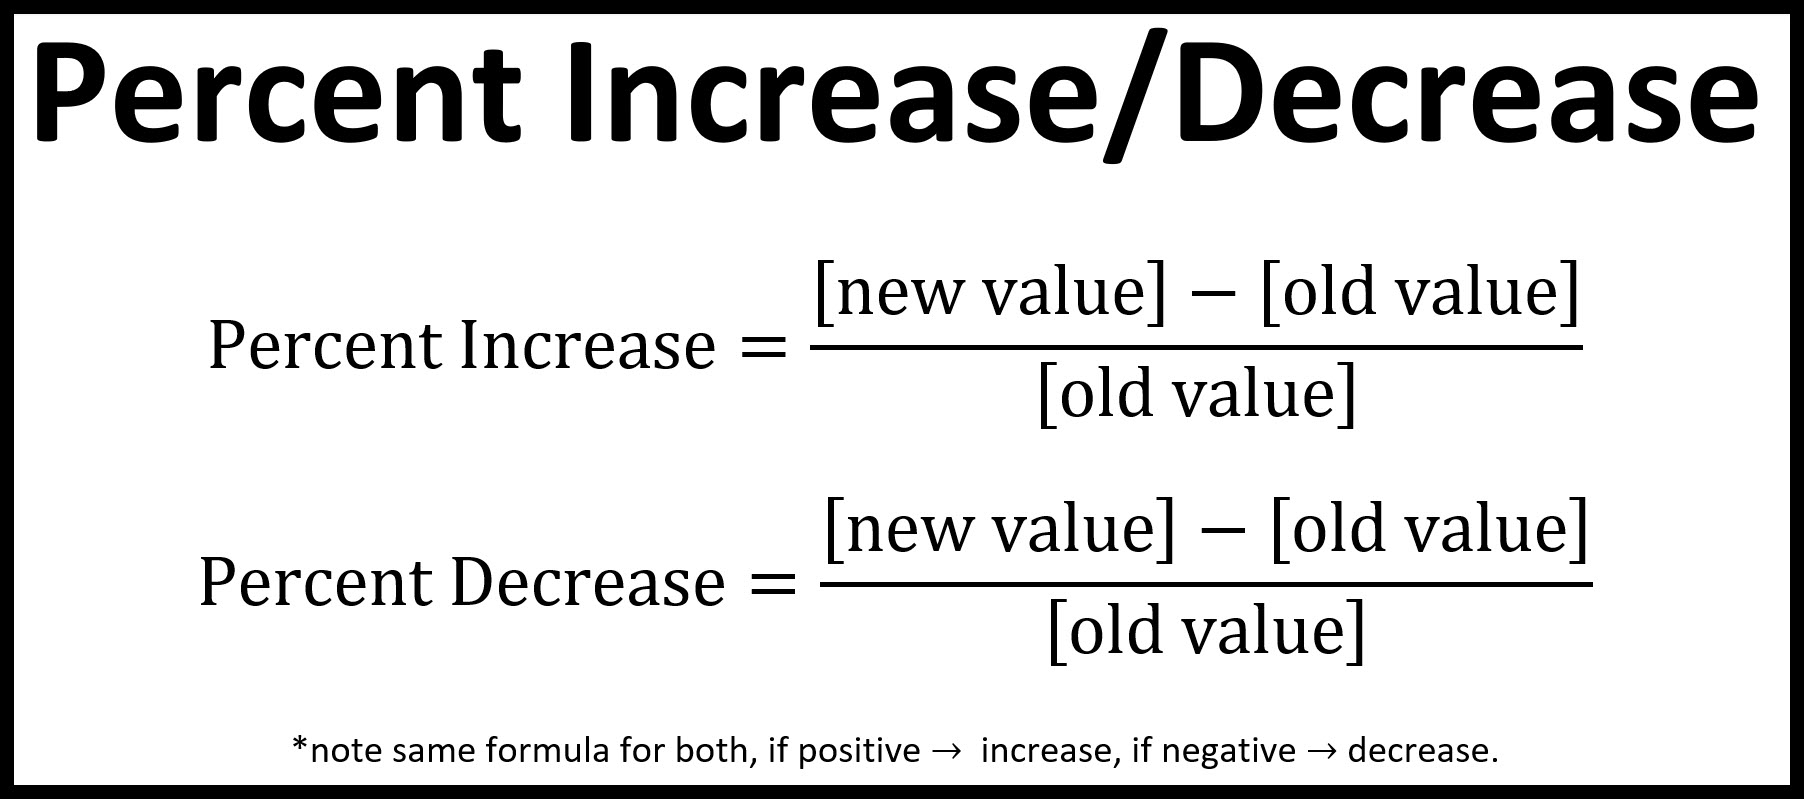
A percent increase represents how much a value has grown relative to its original starting point. This is the primary metric used to track capital gains, interest earnings, and revenue growth.
The formula is straightforward:
((New Value – Original Value) / Original Value) × 100 = Percent Increase
For example, if you purchased a share of a tech company for $150 and its value rose to $187.50, the calculation would look like this:
- Subtract the original price from the new price ($187.50 – $150 = $37.50).
- Divide that gain by the original price ($37.50 / $150 = 0.25).
- Multiply by 100 to get the percentage (25%).
In this scenario, your investment has seen a 25% increase. For a personal finance enthusiast, this figure is more useful than the $37.50 gain because it allows you to compare the stock’s performance against a benchmark, like the S&P 500.
The Formula for Percent Decrease: Tracking Losses and Reductions
Conversely, a percent decrease measures the loss in value or the reduction in costs. In a bearish market or a period of economic contraction, understanding this formula is vital for risk management.
The formula remains essentially the same:
((Original Value – New Value) / Original Value) × 100 = Percent Decrease
If you are a business owner who managed to reduce monthly overhead from $5,000 to $4,200, you have achieved a significant win for your bottom line. The calculation would be:
- Find the difference ($5,000 – $4,200 = $800).
- Divide by the original value ($800 / $5,000 = 0.16).
- Multiply by 100 (16%).
A 16% reduction in expenses is a powerful indicator of improved operational efficiency, providing a much clearer picture of success than simply stating you saved $800.
Applying Percentage Changes to Your Investment Portfolio
For investors, percentages are the universal language of performance. Without them, it is nearly impossible to determine if your asset allocation is working or if you are taking on too much risk for the returns you are receiving.
Evaluating Stock Market Returns and Volatility
When you look at a brokerage statement, you are often met with a sea of green and red percentages. These numbers reflect daily, monthly, or year-to-date (YTD) changes. Professional investors use these percentages to calculate “Volatility,” which is essentially the standard deviation of these percentage changes over time.
A key concept to master here is the asymmetry of gains and losses. If a stock in your portfolio drops by 50%, it requires a 100% increase just to get back to the original “break-even” point. This is why understanding percent decrease is so critical for wealth preservation. Large percentage drops are mathematically harder to recover from than smaller ones, highlighting the importance of stop-loss strategies and diversification.
The Impact of Compound Interest vs. Simple Percentage Shifts
While a one-time percentage increase is great, the real magic in money management comes from compounding. This is where your percentage gains begin to earn their own percentage gains.
When you find the percent increase of an account over a decade, you aren’t just looking at the sum of annual increases. You are looking at the geometric growth. If your portfolio increases by 7% every year for ten years, your total percent increase isn’t a simple 70% (7% × 10); it’s actually about 96.7% due to the “interest on interest.”
Analyzing Real Estate Appreciation and Depreciation
In real estate, percent increase is used to track home equity and market trends. If you bought a property for $300,000 and the market value rises to $450,000, you have a 50% increase in value.
However, investors must also account for the percent decrease in the value of the dollar (inflation) and the physical depreciation of the asset for tax purposes. By calculating the percentage change in net operating income (NOI), real estate investors can determine if a property is becoming more or less profitable over time, regardless of its market price.
Mastering Your Budget Through Percentage Analysis
Personal finance isn’t just about what you earn; it’s about what you keep. Using percentage calculations to analyze your spending habits can reveal trends that absolute numbers might hide.
Tracking Inflation and Cost of Living Adjustments
Inflation is essentially a percent increase in the general price level of goods and services. If the Consumer Price Index (CPI) shows a 5% inflation rate, it means the purchasing power of your money has decreased by roughly that same percentage.
To stay ahead, your income must see a percent increase that meets or exceeds the inflation rate. If you receive a 3% raise in a year where inflation is 5%, you have actually experienced a 2% decrease in “real” income. Calculating these percentages helps you realize when it is time to negotiate a higher salary or look for higher-yielding investment opportunities to protect your wealth.
Measuring Debt Reduction Progress
For those working toward debt freedom, the “percent decrease” of the principal balance is a massive psychological motivator. Whether you are using the “Debt Snowball” or “Debt Avalanche” method, tracking the percentage of the debt paid off—rather than just the dollar amount—can provide a sense of momentum.
For example, paying off $1,000 of a $5,000 credit card bill is a 20% decrease in debt. This milestone feels significant and provides a clear metric of how close you are to the finish line (100% debt reduction).
Salary Negotiations and Merit Increases
When entering a performance review, you should always be prepared to discuss percentages. Asking for a “$5,000 raise” sounds arbitrary. However, asking for a “10% increase based on a 15% increase in department revenue” sounds like a reasoned, data-driven business proposal. Understanding the percentage of your contribution to the company’s bottom line makes you a more formidable negotiator.
Business & Entrepreneurship: Growth Metrics for Business Owners
For entrepreneurs, the ability to calculate and interpret percentage changes is the difference between scaling a business and watching it fail.
Revenue and Profit Margin Fluctuations
Revenue growth is almost always expressed as a percentage. “Month-over-Month” (MoM) and “Year-over-Year” (YoY) growth rates allow business owners to spot seasonal trends and long-term trajectories.
Furthermore, the Profit Margin is itself a percentage:
(Net Profit / Revenue) × 100 = Profit Margin %
If your revenue increases by 20%, but your expenses increase by 30%, your profit margin is actually seeing a percent decrease. This is a common trap for growing businesses; they focus on the “top-line” percent increase (revenue) while ignoring the “bottom-line” percent decrease (profitability).
Customer Acquisition Cost (CAC) and Lifetime Value (LTV)
In modern business finance, particularly in the digital space, success is measured by the relationship between the cost to get a customer and the value that customer brings.
- If your CAC decreases by 10% through better marketing, your ROI increases.
- If your LTV increases by 15% through better product offerings, your business becomes more valuable.
Monitoring these percentage shifts allows a business to pivot quickly. If the percent increase in the cost of advertising begins to outpace the percent increase in customer spend, the business model may need adjustment.
Leveraging Technology to Automate Percentage Calculations
In the modern era, you don’t need to do these calculations by hand every time. Utilizing tools can help you maintain an “at-a-glance” view of your financial health.
Using Spreadsheet Software for Financial Modeling
Programs like Microsoft Excel and Google Sheets are built for percentage analysis. Using a simple formula like =(B2-A2)/A2 and formatting the cell as a percentage allows you to track hundreds of data points simultaneously. This is particularly useful for “What-If” analysis—seeing how a 5% increase in savings rate today could result in a 200% increase in retirement wealth forty years from now.
Financial Apps and Dashboard Integration
Most modern fintech apps (like Mint, YNAB, or Personal Capital) automatically calculate your “Net Worth Percent Change.” By aggregating your bank accounts, loans, and investments, these tools provide a holistic view. They show you the percent decrease in your liabilities and the percent increase in your assets, giving you a “health score” for your personal finances.

Conclusion
Finding the percent increase and decrease is more than just a math exercise; it is a fundamental pillar of financial literacy. By moving beyond absolute numbers and focusing on percentage shifts, you gain the ability to compare different opportunities, protect yourself against the silent erosion of inflation, and measure the true growth of your wealth. Whether you are an investor, a business owner, or someone simply looking to master their household budget, these simple formulas provide the clarity needed to navigate the complex world of money with confidence.
aViewFromTheCave is a participant in the Amazon Services LLC Associates Program, an affiliate advertising program designed to provide a means for sites to earn advertising fees by advertising and linking to Amazon.com. Amazon, the Amazon logo, AmazonSupply, and the AmazonSupply logo are trademarks of Amazon.com, Inc. or its affiliates. As an Amazon Associate we earn affiliate commissions from qualifying purchases.