
In the intricate world of finance, where every decision can have significant monetary implications, the ability to understand and calculate percentages is not merely a mathematical skill—it’s a critical competency. From personal budgeting and investment analysis to business profitability and economic indicators, percentages serve as the universal language for expressing proportions, changes, and relationships between financial figures. Mastering this fundamental concept empowers individuals and businesses alike to make informed decisions, identify trends, and accurately assess financial health. This guide delves into the core mechanics of percentage calculation, rigorously anchoring each explanation within the practical contexts of personal finance, investing, and business operations.

The Foundational Concept of Percentages in Finance
At its core, a percentage is a way of expressing a number as a fraction of 100. The word “percent” literally means “per hundred.” This standardized approach allows for easier comparison and understanding of proportions, regardless of the absolute numbers involved. In finance, this common language is indispensable, transforming raw data into actionable insights.
Understanding What a Percentage Represents
Imagine you’re told a company’s revenue increased by $1 million. Is that good? It depends. If the previous revenue was $10 million, a $1 million increase is a 10% growth, which is significant. If the previous revenue was $1 billion, a $1 million increase is a mere 0.1% growth, which is far less impressive. Here, the percentage provides the essential context.
- Financial Context: When a bank offers a 5% interest rate on a savings account, it means for every $100 you deposit, you will earn $5 in interest annually (simple interest). A 20% discount on an item means you save $20 for every $100 of its original price. Understanding this “per hundred” basis clarifies the impact of these figures instantly. It allows for quick mental calculations and comparisons across different financial products or scenarios.
Why Percentages Are Indispensable in Financial Literacy
Percentages simplify complexity. They allow us to distill large, often disparate financial figures into digestible and comparable metrics. Without percentages, comparing the performance of two investments—one starting at $1,000 and growing by $100, the other starting at $10,000 and growing by $500—would require more mental effort. Expressed as percentages, the first investment grew by 10% ($100/$1,000), while the second grew by 5% ($500/$10,000). The 10% growth clearly outperforms the 5% growth, despite the larger absolute dollar increase of the second investment.
- Decision-Making: Percentages are crucial for comparing investment returns (ROI), evaluating loan interest rates (APR), allocating budget categories (e.g., 50/30/20 rule for budgeting), understanding tax brackets, and analyzing business profitability (e.g., gross profit margin). They enable a clear, objective assessment of financial performance and risk, guiding strategic choices in personal and business finance.
Mastering Basic Percentage Calculations for Financial Success
While calculators and software streamline calculations, a solid grasp of the underlying formulas is vital for truly understanding the figures and spotting potential errors or misrepresentations.
Calculating a Percentage of a Whole Number
This is perhaps the most fundamental percentage calculation. It answers the question: “What part of a whole does this percentage represent?” or conversely, “What percentage is this part of the whole?”
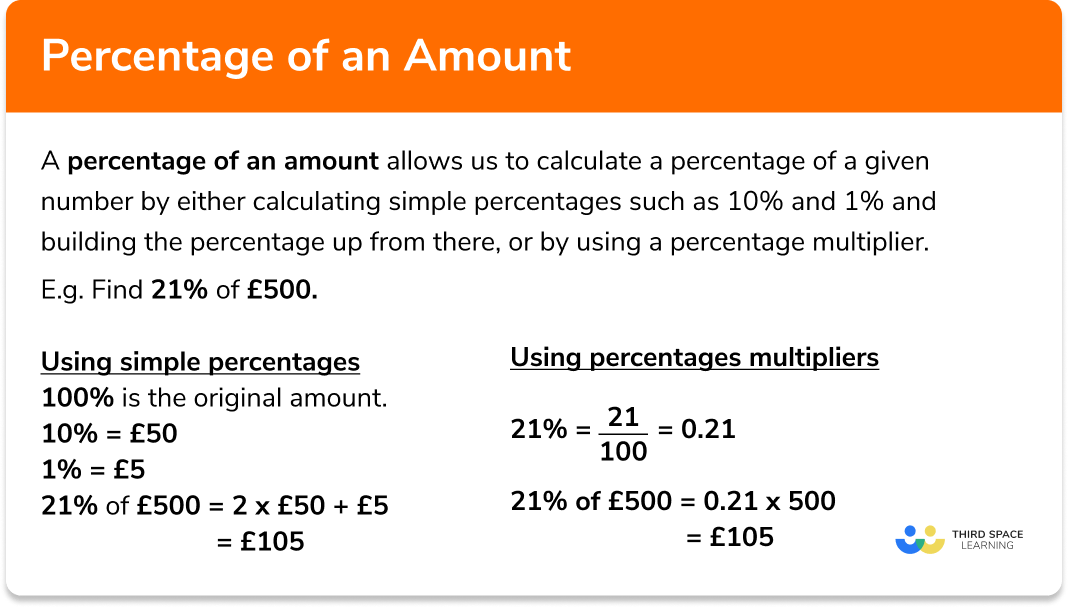
Formula 1: To find a percentage of a number
Percentage (as a decimal) × Whole Number = Part
To convert a percentage to a decimal, divide it by 100. So, 25% becomes 0.25.
Financial Example: You want to save 15% of your $4,000 monthly income.
0.15 × $4,000 = $600
You should save $600 each month.
Formula 2: To find what percentage a part is of a whole
(Part / Whole) × 100 = Percentage
Financial Example: Your monthly rent is $1,200, and your net monthly income is $4,000. What percentage of your income goes to rent?
($1,200 / $4,000) × 100 = 30%
30% of your income is allocated to rent. This calculation helps you assess if you’re within your budgeting goals or industry benchmarks, such as keeping housing costs below 30% of income.
Finding the Percentage of Increase or Decrease
Understanding growth or decline is critical in finance, whether tracking investment performance, sales figures, or inflation rates. This calculation shows the relative change between two values over time.
Formula: ((New Value – Old Value) / Old Value) × 100 = Percentage Change
- If the result is positive, it’s a percentage increase.
- If the result is negative, it’s a percentage decrease.
Financial Example (Increase): Your investment portfolio grew from $50,000 to $57,500 over a year. What is the percentage increase?
(($57,500 - $50,000) / $50,000) × 100 = ($7,500 / $50,000) × 100 = 0.15 × 100 = 15%
Your portfolio saw a 15% return.
Financial Example (Decrease): A stock you own dropped from $100 per share to $85 per share. What is the percentage decrease?
(($85 - $100) / $100) × 100 = (-$15 / $100) × 100 = -0.15 × 100 = -15%
The stock decreased by 15%. This is vital for calculating losses, assessing market corrections, or evaluating asset depreciation.
Reverse Percentage Calculations: Working Backwards
Sometimes you know the result after a percentage change and need to find the original value. This is common with sales, taxes, or commission-based earnings.
Formula 1: To find the original value before a percentage increase
Original Value = New Value / (1 + (Percentage Increase / 100))
Financial Example: You earned a bonus this month, which was a 10% increase over your usual base pay. If your bonus check was $3,300, what was your usual base pay?
Original Pay = $3,300 / (1 + (10 / 100)) = $3,300 / (1 + 0.10) = $3,300 / 1.10 = $3,000
Your usual base pay is $3,000.
Formula 2: To find the original value before a percentage decrease
Original Value = New Value / (1 - (Percentage Decrease / 100))
Financial Example: You bought a designer bag for $1,600 after a 20% discount. What was the original price of the bag?
Original Price = $1,600 / (1 - (20 / 100)) = $1,600 / (1 - 0.20) = $1,600 / 0.80 = $2,000
The original price of the bag was $2,000. This is invaluable for identifying true value and verifying discounts.
Practical Applications of Percentages in Personal Finance and Investing
The financial implications of percentages permeate nearly every aspect of our economic lives, from managing daily expenses to planning for long-term wealth creation.
Budgeting and Expense Management
Effective personal finance hinges on smart budgeting, and percentages are the backbone of most budgeting frameworks.
- The 50/30/20 Rule: A popular budgeting guideline suggests allocating 50% of your after-tax income to needs (housing, groceries, utilities), 30% to wants (dining out, entertainment, hobbies), and 20% to savings and debt repayment. This percentage-based approach makes budgeting flexible and scalable, adapting to different income levels.
- Tracking Spending: By calculating what percentage of your income each expense category consumes, you can identify areas of overspending or opportunities for saving. For instance, if dining out consumes 15% of your income, you might decide to reduce that percentage to free up funds for investment.
Understanding Loans, Interest, and Debt
Percentages are critical to deciphering the true cost of borrowing and the growth of savings.
- Annual Percentage Rate (APR): This is the annual rate charged for borrowing or earned by an investment. A higher APR on a loan means higher interest payments, directly impacting your repayment schedule and total cost of debt.
- Compound Interest: Often called the “eighth wonder of the world,” compound interest refers to earning interest on your initial principal and the accumulated interest from previous periods. Understanding how a percentage interest rate compounds over time (e.g., annually, monthly, daily) is key to maximizing savings and investments or recognizing the exponential growth of debt.
- Debt-to-Income Ratio (DTI): Lenders use this ratio to assess your ability to manage monthly payments and repay debts. It’s the percentage of your gross monthly income that goes toward paying your monthly debt payments. A lower DTI percentage is favorable for loan approvals.
Investment Analysis and Portfolio Management
For investors, percentages are the primary metrics for evaluating performance and managing risk.
- Return on Investment (ROI): This common metric calculates the profitability of an investment as a percentage of its initial cost. A 10% ROI means for every dollar invested, you gained 10 cents.
- Portfolio Diversification: Investors often allocate their portfolios using percentages (e.g., 60% stocks, 30% bonds, 10% cash) to manage risk and align with their financial goals. Regular rebalancing ensures these percentages remain consistent.
- Yields: Dividend yield (for stocks) and bond yield express the income generated by an investment as a percentage of its current market price, allowing investors to compare income-generating assets.
- Tracking Gains/Losses: Investment platforms universally display percentage gains or losses, providing an immediate snapshot of how an asset or entire portfolio is performing relative to its cost.
Percentages in Business Finance and Entrepreneurship
For businesses, percentages are not just analytical tools; they are vital performance indicators that drive strategic decisions, operational efficiency, and long-term viability.
Profitability Metrics
Businesses live and die by their profitability, and percentages offer clear, standardized ways to measure it.
- Gross Profit Margin: This percentage indicates the profit a company makes from its sales after deducting the direct costs of making those goods or services (Cost of Goods Sold). Formula:
((Revenue - Cost of Goods Sold) / Revenue) × 100. A higher percentage signifies greater efficiency in production. - Net Profit Margin: This is the ultimate measure of a company’s profitability, showing what percentage of revenue is left after all expenses, including taxes and interest, have been deducted. Formula:
((Net Income / Revenue) × 100). A robust net profit margin indicates strong financial health. - Operating Margin: This metric reveals how much profit a company makes from its core operations for every dollar of sales, before accounting for interest and taxes.
Sales, Discounts, and Pricing Strategies
Percentages are integral to everyday commercial transactions and strategic pricing.
- Percentage Discounts: Retailers use percentages extensively (e.g., “25% off all items”) to attract customers and move inventory. Businesses must calculate the impact of these discounts on their profit margins.
- Markups: Businesses apply a percentage markup to the cost of their goods to determine the selling price, ensuring they cover costs and achieve desired profit levels.
- Commission Rates: Salespeople often earn a percentage of the sales they generate, incentivizing performance and directly linking compensation to revenue.
- Sales Growth: Tracking month-over-month or year-over-year sales growth as a percentage provides a clear picture of market penetration and business expansion.
Financial Ratios and Performance Indicators
Beyond direct profitability, percentages are used in various financial ratios to assess a company’s liquidity, solvency, efficiency, and market value.
- Liquidity Ratios: The Current Ratio (Current Assets / Current Liabilities) is often viewed as a percentage or ratio (e.g., 2:1 or 200%) to indicate a company’s ability to cover its short-term obligations.
- Debt-to-Equity Ratio: This ratio compares a company’s total liabilities to its shareholder equity, expressed as a percentage, indicating how much debt is used to finance assets relative to the value of shareholders’ equity. A high percentage can signal financial risk.
- Return on Assets (ROA) & Return on Equity (ROE): These percentages measure how efficiently a company uses its assets and equity to generate profits, providing insight into management effectiveness.
Leveraging Digital Tools for Seamless Percentage Calculations
While understanding the manual calculations is crucial, modern finance extensively utilizes digital tools to perform these computations swiftly and accurately, often integrating them into broader financial management.
Spreadsheets: The Power of Excel and Google Sheets
Spreadsheets are ubiquitous in finance for their flexibility and powerful computational capabilities.
- Built-in Formulas: Excel and Google Sheets have native support for percentage calculations. For example, to find 20% of a number in cell A1, you’d type
=A1*0.20. To find the percentage of A1 relative to A2, you’d use=(A1/A2). The ability to drag and apply these formulas across vast datasets makes complex financial analysis manageable. - Financial Modeling: Businesses use spreadsheets to build financial models that project future revenues, expenses, and profits, all heavily reliant on percentage assumptions for growth rates, cost structures, and margins.
- Conditional Formatting: Percentages can be visualized with conditional formatting (e.g., automatically highlighting positive growth percentages green and negative percentages red), enhancing readability and quick analysis of financial reports.
Financial Calculators and Apps
For quick, on-the-go calculations, various digital tools offer immediate solutions.
- Online Percentage Calculators: Numerous websites provide simple percentage calculators, perfect for quick checks on discounts, tips, or simple interest.
- Budgeting Apps: Many personal finance apps automatically categorize spending and present it as percentages of income, providing visual dashboards of budget allocation.
- Investment Platforms: Online brokerage accounts and investment tracking apps constantly display percentage changes in portfolio value, individual stock performance, and dividend yields, allowing investors to monitor their assets in real-time.

Understanding Financial Statements and Reports
Publicly traded companies and even small businesses present their financial data using percentages to make it more meaningful and comparable.
- Comparative Analysis: Financial statements often include year-over-year percentage changes for revenue, expenses, and profit to highlight trends.
- Common-Size Financial Statements: These statements express each line item as a percentage of a base figure (e.g., every income statement item as a percentage of total revenue, every balance sheet item as a percentage of total assets). This allows for easy comparison between companies of different sizes or tracking changes within a company over time. Understanding how these percentages are derived and what they signify is key to interpreting corporate financial health.
In conclusion, the ability to find out a percentage of something is far more than a simple arithmetic exercise; it is a fundamental pillar of financial literacy. Whether you are managing your household budget, strategically investing your savings, or navigating the complexities of business finance, percentages provide the clarity, context, and comparative power needed to make intelligent, data-driven decisions. By mastering these calculations and understanding their myriad applications, you equip yourself with an invaluable tool for achieving financial success and navigating the modern economic landscape with confidence.
aViewFromTheCave is a participant in the Amazon Services LLC Associates Program, an affiliate advertising program designed to provide a means for sites to earn advertising fees by advertising and linking to Amazon.com. Amazon, the Amazon logo, AmazonSupply, and the AmazonSupply logo are trademarks of Amazon.com, Inc. or its affiliates. As an Amazon Associate we earn affiliate commissions from qualifying purchases.