
In the realm of finance, the ability to calculate a percentage is far more than a basic arithmetic skill; it is the fundamental language of value, risk, and growth. Whether you are evaluating a stock’s performance, determining the viability of a business loan, or simply trying to stick to a monthly budget, percentages provide a universal scale to measure progress. Understanding how to figure a percentage allows an individual to move beyond raw numbers—which can often be misleading—and into the realm of relative value, where informed financial decisions are made.

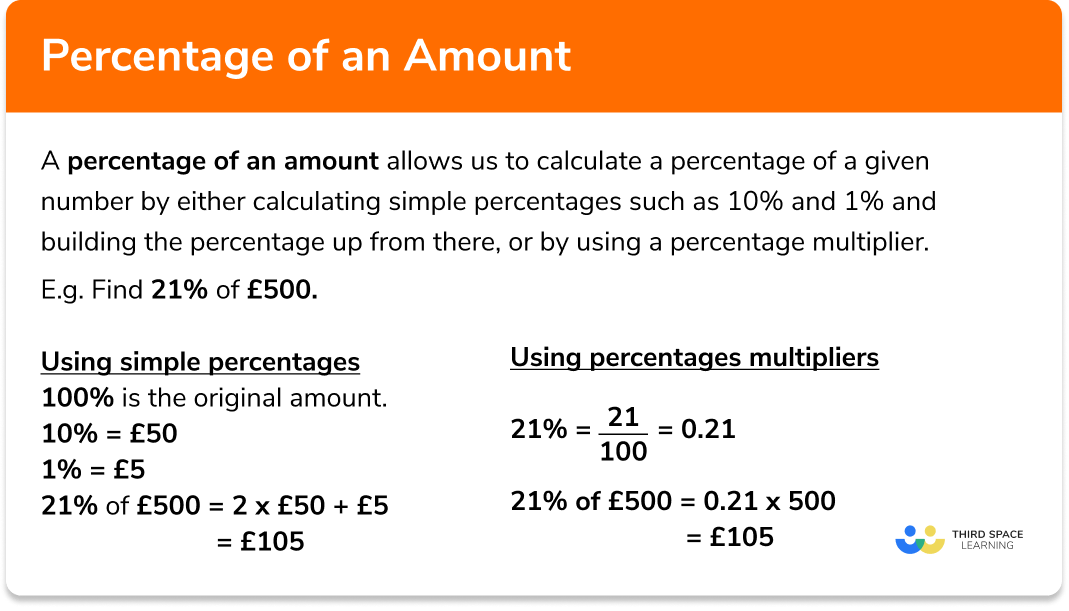
At its core, a percentage represents a fraction of 100. To figure a percentage, the basic formula is simple: divide the “part” by the “whole” and then multiply the result by 100. For example, if you saved $200 out of a $1,000 paycheck, the calculation is (200 / 1,000) * 100 = 20%. While the math is straightforward, the application of this logic across personal finance, investing, and business management is where the true complexity and utility reside.
Mastering Your Personal Budget Through Percentages
When managing personal finances, looking at raw dollar amounts can sometimes obscure the health of your financial habits. Percentages provide a clearer picture of where your money is going relative to your income. One of the most effective ways to use percentages in daily life is through structured budgeting frameworks, such as the 50/30/20 rule.
The 50/30/20 Budgeting Framework
The 50/30/20 rule is a percentage-based approach to wealth management that suggests allocating 50% of your after-tax income to “needs” (housing, utilities, groceries), 30% to “wants” (entertainment, dining out, hobbies), and 20% to financial goals (savings, debt repayment, or investments). To figure these percentages for your own life, you must first calculate your total net income. If your net take-home pay is $5,000, you would figure your “needs” limit by calculating 50% of that total ($5,000 * 0.50 = $2,500). By using percentages rather than fixed dollar amounts, your budget becomes scalable; as your income increases, your allocations grow proportionally, ensuring you don’t fall victim to “lifestyle creep.”
Calculating Your Debt-to-Income (DTI) Ratio
Lenders and financial institutions rely heavily on percentages to assess your creditworthiness. The most critical metric in this regard is the Debt-to-Income (DTI) ratio. This percentage represents the portion of your gross monthly income that goes toward paying debts. To figure this percentage, add up all your monthly debt obligations—such as car loans, student loans, and credit card minimums—and divide that total by your gross monthly income. A DTI ratio below 36% is generally considered healthy. If you earn $6,000 a month and your debts total $2,400, your DTI is 40% (2,400 / 6,000). Understanding this percentage is vital before applying for a mortgage, as it is often the deciding factor in loan approval.
Savings Rates and Emergency Funds
Your “savings rate” is perhaps the most significant percentage in your financial life. It is calculated by dividing your monthly savings by your total disposable income. A high savings rate is often a better predictor of long-term wealth than a high salary. If you earn $4,000 and save $800, your savings rate is 20%. Monitoring this percentage monthly allows you to see if your financial discipline is improving or slipping over time, regardless of fluctuations in your total income.
The Investor’s Perspective: Yields, Returns, and Growth
In the world of investing, percentages are the primary metric for success. Investors rarely talk about how many dollars they made; instead, they discuss their “rate of return.” This is because a $1,000 profit means something very different depending on whether you invested $10,000 or $100,000.
Calculating Return on Investment (ROI)
The most common percentage used in the market is Return on Investment (ROI). To figure this percentage, you take the current value of the investment, subtract the original cost, and then divide that gain by the original cost.
- Formula: [(Current Value – Original Cost) / Original Cost] * 100
If you bought shares in a company for $1,000 and sold them for $1,250, your profit is $250. To find the percentage gain, you divide 250 by 1,000 to get 0.25, or 25%. This allows you to compare the performance of different assets. You might find that a $500 gain on a small investment is actually a better “win” than a $2,000 gain on a much larger, more stagnant asset.
Understanding Dividend Yields and Expense Ratios
For income-focused investors, the “dividend yield” is a crucial percentage. It represents how much a company pays out in dividends each year relative to its stock price. If a stock is priced at $100 and pays an annual dividend of $4, the yield is 4%. Conversely, when looking at mutual funds or ETFs, you must consider the “expense ratio.” This is the percentage of your investment that the fund management takes annually as a fee. A 1% fee might sound small, but when compounded over 30 years, that single percentage point can eat away nearly a third of your potential portfolio value.
The Mathematics of Percentage Gains and Losses
One of the most counterintuitive aspects of financial percentages is the relationship between losses and gains. If an investment drops by 50%, it requires a 100% gain just to get back to the original starting point. For example, if a $100 stock drops to $50, that is a 50% loss. However, for that $50 stock to return to $100, it must increase by $50, which is a 100% increase of its current value. This mathematical reality is why risk management—focusing on minimizing percentage drawdowns—is often more important than chasing high percentage gains.
Corporate Finance: Using Percentages to Measure Business Health
For entrepreneurs and business owners, figuring percentages is an everyday necessity for survival. Businesses use percentages to track efficiency, set prices, and determine if they are actually making money after all expenses are paid.
Gross vs. Net Profit Margins
Profit margin is a percentage that expresses how much out of every dollar of sales a company keeps in earnings.
-
Gross Profit Margin is figured by taking total revenue, subtracting the Cost of Goods Sold (COGS), and dividing by revenue. This shows how efficiently a company produces its products.
-
Net Profit Margin is the “bottom line” percentage. It takes all expenses into account, including taxes and interest. If a business generates $1 million in revenue but only keeps $100,000 after all costs, its net profit margin is 10%.
Monitoring these percentages allows a business to identify where they are losing money. If revenue is increasing but the profit margin percentage is shrinking, it indicates that expenses are growing faster than sales—a red flag for any business owner.
Markup and Pricing Strategies
To ensure profitability, businesses must master the “markup” percentage. Markup is the percentage added to the cost of a product to derive its selling price. If a product costs $50 to make and you want a 50% markup, you would calculate 50% of $50 ($25) and add it to the cost for a selling price of $75. It is vital not to confuse markup with margin; a 50% markup results in a 33.3% profit margin. Knowing how to figure these specific percentages ensures that a business doesn’t inadvertently price its products too low to cover its overhead.
Tax Obligations and Effective Rates
Businesses and high-net-worth individuals must also figure their “effective tax rate.” Unlike the marginal tax rate (the tax bracket you fall into), the effective tax rate is the actual percentage of your total income that goes to the government after all deductions and credits are applied. To figure this, divide your total tax paid by your total taxable income. In business finance, understanding this percentage is key to cash flow management and long-term capital allocation.
Practical Tools and Mental Math for Financial Decisiveness
While calculators and spreadsheets are ubiquitous, the ability to figure percentages mentally or through simple tools can provide a significant advantage in fast-moving financial situations.
The Rule of 72
The Rule of 72 is a quick way to estimate how long it will take for an investment to double at a fixed annual percentage rate of return. You simply divide 72 by the annual interest rate. If you are earning a 6% return on your savings, it will take approximately 12 years (72 / 6) for that money to double. This mental shortcut helps investors quickly weigh the long-term value of different interest rates without needing a complex financial calculator.
Understanding APR and Interest Accrual
In the world of debt, the Annual Percentage Rate (APR) is the most critical number to understand. However, the APR is often compounded monthly or even daily. To figure the monthly interest on a credit card balance, you divide the APR by 12. If your card has an 18% APR, your monthly interest rate is 1.5%. Applying this percentage to your current balance helps you realize exactly how much of your monthly payment is going toward interest versus the principal balance.

Leveraging Digital Tools and Spreadsheets
In professional finance, spreadsheets like Excel or Google Sheets are the gold standard for figuring percentages. Using formulas like =(B2-A2)/A2 allows for the instantaneous calculation of percentage change across thousands of data points. For those managing complex portfolios or business ledgers, these tools remove human error and allow for “what-if” scenarios—adjusting a single percentage point to see the massive downstream effects on future wealth or corporate liquidity.
Ultimately, figuring a percentage is about gaining perspective. It turns raw data into actionable intelligence. Whether you are a consumer trying to understand a sale price, a homeowner looking at mortgage rates, or an investor analyzing market volatility, the percentage remains the most powerful tool in your financial toolkit. By mastering these calculations, you move from simply spending and saving to strategically managing your economic future.
aViewFromTheCave is a participant in the Amazon Services LLC Associates Program, an affiliate advertising program designed to provide a means for sites to earn advertising fees by advertising and linking to Amazon.com. Amazon, the Amazon logo, AmazonSupply, and the AmazonSupply logo are trademarks of Amazon.com, Inc. or its affiliates. As an Amazon Associate we earn affiliate commissions from qualifying purchases.