In the world of finance, percentages are the universal language of progress, risk, and value. Whether you are analyzing the growth of a stock portfolio, determining the interest rate on a mortgage, or calculating the profit margins of a small business, understanding how to calculate a percentage is a fundamental skill that underpins financial literacy. While the basic math is taught in primary school, the application of these figures in a complex economic landscape requires a deeper level of insight.
To master your money, you must move beyond simple arithmetic and understand how percentages represent the relative change and health of your financial assets. This guide provides a comprehensive look at the mechanics of percentage calculations and their strategic importance in wealth management and business finance.

The Core Mechanics: Understanding the Percentage Formula in Personal Finance
At its most basic level, a percentage is a way to express a number as a fraction of 100. In personal finance, this allows for a “normalized” view of your money, making it easier to compare different financial scenarios regardless of the total dollar amounts involved.
The Fundamental Formula: Part Over Whole
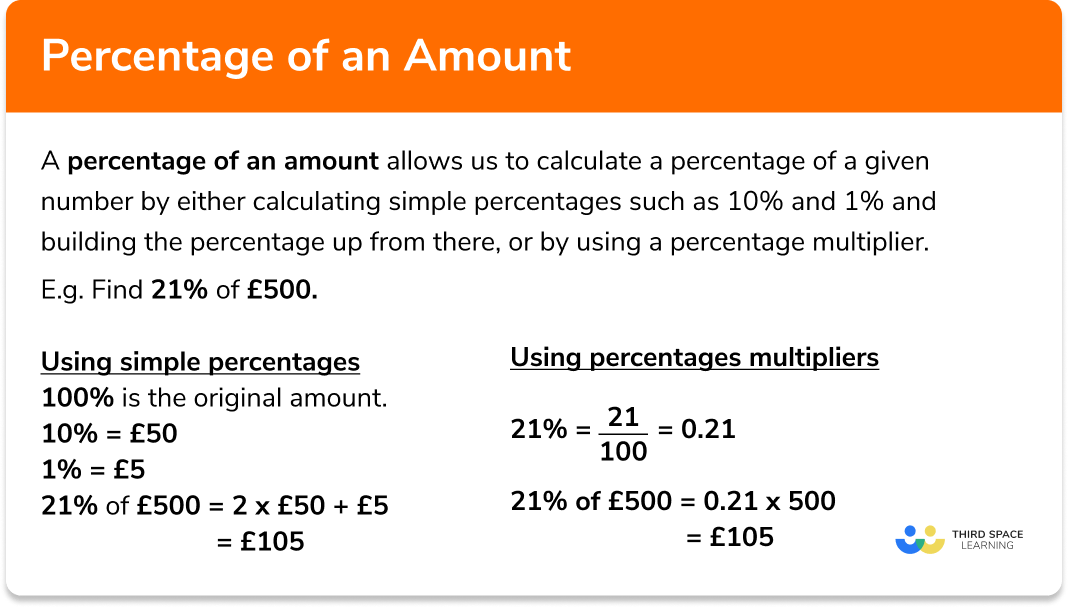
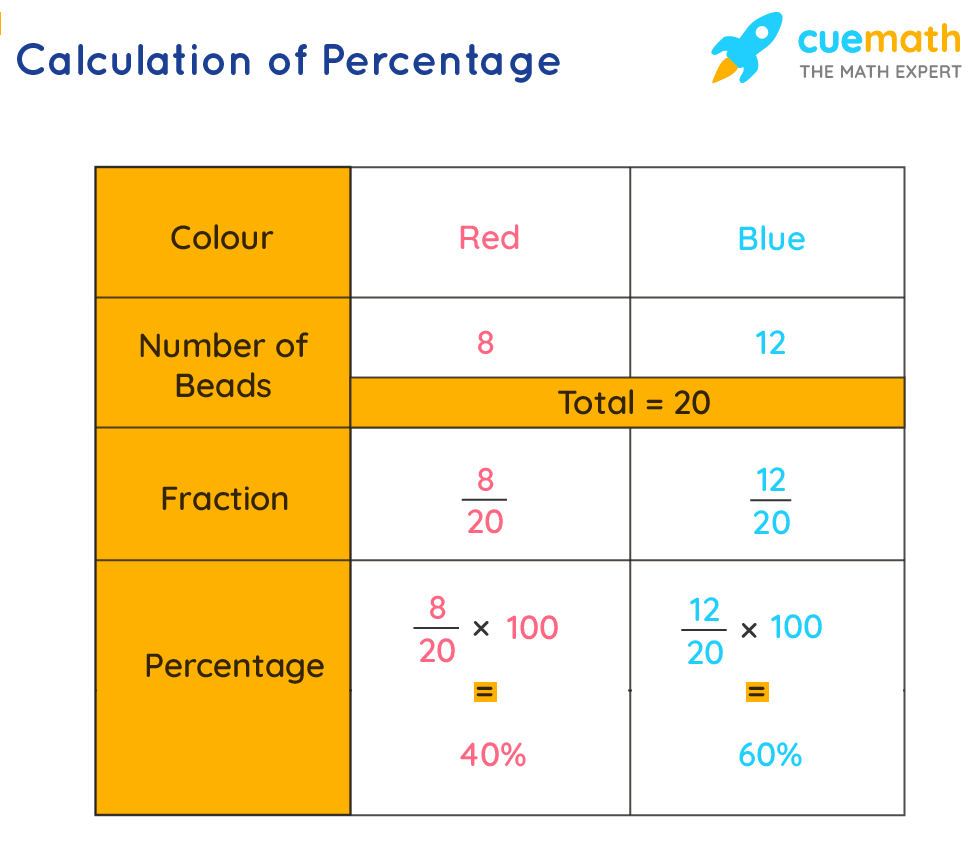
The standard formula to calculate a percentage is:
(Part / Whole) × 100 = Percentage
For example, if you aim to save $500 out of a $4,000 monthly salary, you divide 500 by 4,000 to get 0.125. Multiplying by 100 gives you 12.5%. In financial planning, this simple calculation is the bedrock of the “50/30/20 rule,” where you allocate specific percentages of your income to needs, wants, and savings. By calculating these percentages monthly, you can identify if your spending habits are drifting away from your long-term wealth goals.
Percentage Increase and Decrease
In volatile markets, understanding the percentage of change is often more important than the nominal value. To calculate the percentage increase or decrease between two periods, use the following formula:
[(New Value – Old Value) / Old Value] × 100
If your investment account grew from $10,000 to $11,500, the calculation would be ($1,500 / $10,000) × 100, resulting in a 15% gain. Conversely, if the market dips, knowing the percentage decrease helps in assessing risk tolerance. A 10% drop on a $100,000 portfolio ($10,000) feels more significant than a 10% drop on $1,000 ($100), but the mathematical impact on your “purchasing power” relative to your total net worth remains the same.
Investing Metrics: Calculating Yields and Returns
When you transition from a saver to an investor, percentages become the primary tool for evaluating performance. Since different assets (stocks, bonds, real estate) require different levels of capital, the only way to compare them fairly is through percentage-based metrics.
ROI (Return on Investment) Calculations
Return on Investment (ROI) is the most common percentage used to evaluate the efficiency of an investment. The formula is:
[(Current Value of Investment – Cost of Investment) / Cost of Investment] × 100
However, professional investors often look at “Annualized ROI” to account for the time the money was tied up. A 20% return over five years is significantly less impressive than a 20% return in a single year. By calculating the annualized percentage, you can compare a high-yield savings account (offering perhaps 4.5% annually) against a stock market index (which historically averages 7–10% annually).
Understanding Dividend Yield and APY
For income-focused investors, the “Dividend Yield” is a critical percentage. It is calculated by dividing the annual dividends paid per share by the stock’s price per share. If a stock costs $100 and pays $5 in annual dividends, the yield is 5%.
In the banking sector, you will frequently encounter APY (Annual Percentage Yield). Unlike a simple interest rate, APY reflects the effect of compounding—the process where you earn interest on your interest. When comparing financial tools like CDs or high-yield savings accounts, always look at the APY percentage rather than the nominal interest rate to understand the true growth potential of your cash.
Strategic Debt Management: Percentage-Based Interest Rates
Just as percentages can work for you in investments, they can work against you in the form of debt. Managing debt effectively requires a granular understanding of how interest percentages are applied to your balances.
Credit Card Interest and Annual Percentage Rates (APR)
The Annual Percentage Rate (APR) is the standard way to express the cost of borrowing. However, credit card companies often calculate interest daily. To find your daily periodic rate, you divide your APR by 365. If you have an APR of 24%, your daily interest rate is approximately 0.065%.
When you carry a balance, the bank applies this percentage to your average daily balance. By understanding this calculation, you can see why even small “percentage” increases in your interest rate can lead to hundreds of dollars in additional costs over time. It also highlights the importance of the “debt avalanche” method, where you prioritize paying off the debt with the highest interest percentage first, regardless of the balance size.
The Impact of Basis Points on Mortgage Rates
In the world of mortgages and corporate bonds, you will often hear the term “basis points” (BPS). One basis point is equal to 1/100th of 1%, or 0.01%. While a move from 6.50% to 6.75% might seem negligible, that 25-basis-point increase can result in tens of thousands of dollars in extra interest over the life of a 30-year loan. Calculating the percentage impact of interest rate hikes is essential for home buyers and business owners looking to finance expansion.
Business Finance and Profit Margins
For entrepreneurs and business leaders, percentage calculations are used to determine the viability of a product or service. Miscalculating these figures is one of the most common reasons small businesses fail.
Gross vs. Net Profit Margins
Profitability is rarely measured in absolute dollars; it is measured in margins.
- Gross Profit Margin: This is calculated as [(Revenue – Cost of Goods Sold) / Revenue] × 100. This percentage tells you how much money is left over to cover operating expenses after the direct costs of production are paid.
- Net Profit Margin: This is the “bottom line” percentage, calculated as (Net Income / Revenue) × 100. It represents how much of every dollar earned actually ends up as profit after taxes, interest, and all expenses are deducted.
A business with high revenue but a net profit margin of only 2% is in a precarious position, as a small increase in costs could turn the profit into a loss.
Markup vs. Margin: Avoiding Costly Errors
One of the most frequent mistakes in business finance is confusing “markup” with “margin.”
- Markup is the percentage added to the cost to reach a selling price: [(Price – Cost) / Cost] × 100.
- Margin is the percentage of the selling price that is profit: [(Price – Cost) / Price] × 100.
If an item costs $80 and you sell it for $100, your markup is 25% ($20 is 25% of $80). However, your profit margin is only 20% ($20 is 20% of $100). If a business owner mistakenly uses these terms interchangeably when setting prices or calculating discounts, they may inadvertently erode their profitability.
Practical Tools and Automating Financial Percentages
While manual calculations are vital for conceptual understanding, modern financial management relies on automation and digital tools to track percentages in real-time.
Using Spreadsheets for Percentage Tracking
Programs like Microsoft Excel and Google Sheets are designed around percentage logic. To calculate a percentage in a spreadsheet, you simply use the formula =A1/B1 and then format the cell as a percentage. This allows for dynamic financial modeling. For example, you can create a “What-If” analysis to see how a 1% increase in inflation or a 2% decrease in sales would affect your annual net worth.
Financial Apps and Real-Time Analysis
Most modern fintech apps—from brokerage platforms like Vanguard and Fidelity to budgeting tools like YNAB—automatically calculate percentages for you. They provide visual dashboards showing your “Asset Allocation” (the percentage of your portfolio in stocks vs. bonds) and your “Savings Rate.”
However, the “insight” comes from knowing what these percentages mean. A dashboard showing a 30% spending increase in “Discretionary Expenses” is a call to action. By mastering the calculation behind the visual, you gain the agency to adjust your financial trajectory.
In conclusion, the ability to calculate a percentage is more than a mathematical requirement; it is a strategic necessity in the pursuit of financial independence. From the simple allocation of a monthly paycheck to the complex analysis of a corporate balance sheet, percentages provide the clarity needed to make informed, rational decisions. By viewing your financial world through the lens of percentages, you can accurately measure growth, mitigate risk, and optimize your path to wealth.
aViewFromTheCave is a participant in the Amazon Services LLC Associates Program, an affiliate advertising program designed to provide a means for sites to earn advertising fees by advertising and linking to Amazon.com. Amazon, the Amazon logo, AmazonSupply, and the AmazonSupply logo are trademarks of Amazon.com, Inc. or its affiliates. As an Amazon Associate we earn affiliate commissions from qualifying purchases.