
In the dynamic world of money, numbers tell stories – stories of growth, decline, opportunity, and risk. Among the most potent tools for deciphering these narratives is the percentage change. Far more than a simple mathematical operation, understanding how to calculate and interpret percentage change is fundamental to sound financial decision-making, whether you’re managing personal investments, analyzing business performance, or simply tracking your monthly budget. It transforms raw figures into actionable insights, allowing for meaningful comparisons and a clearer picture of financial evolution over time.
This guide delves into the mechanics of percentage change, emphasizing its crucial role across various financial landscapes. We’ll break down the formula, walk through practical examples rooted in personal and business finance, and highlight the nuances that differentiate a superficial understanding from a truly insightful one. By mastering this concept, you equip yourself with an indispensable analytical skill, empowering you to navigate the complexities of money with greater confidence and precision.
Understanding the Core Concept of Percentage Change
At its heart, a percentage change quantifies the relative shift between two numbers over a period. It expresses this shift as a proportion of the initial value, scaled to a base of 100. This normalization is what makes percentage changes so powerful – they allow for apples-to-apples comparisons regardless of the absolute magnitudes of the numbers involved.
What is a Percentage Change?
A percentage change measures the degree of change over time, specifically the percentage increase or decrease from an initial value to a final value. Unlike absolute change, which simply states the difference (e.g., “$100 more” or “50 units less”), percentage change provides context. It answers the question: “How much did something change relative to where it started?”
For instance, an increase of $100 in a $1,000 portfolio represents a 10% gain, while the same $100 increase in a $10,000 portfolio is only a 1% gain. The absolute change is identical, but the percentage change reveals vastly different financial impacts and rates of growth. This relative measure is paramount because it directly speaks to efficiency, performance, and scale – critical factors in any financial analysis.
Why is Percentage Change Crucial in Finance?
The significance of percentage change in finance cannot be overstated. It is the lingua franca for discussing performance, trends, and risk across virtually all financial disciplines:
- Tracking Growth and Loss: Whether it’s your investment portfolio, a company’s revenue, or the value of a currency, percentage change provides a standardized way to quantify progress or regress. A 15% annual return on investment sounds much more appealing than a $1,500 gain if you don’t know the initial capital.
- Comparing Performance: It allows investors to compare the performance of different assets (stocks vs. bonds), investment managers, or even various business units, irrespective of their starting sizes. A small startup achieving a 50% quarterly revenue growth can be more impressive than a large corporation showing a 5% growth, highlighting their respective trajectories.
- Informing Decision-Making: Understanding the percentage change in interest rates, inflation, or your personal spending helps you make informed decisions about borrowing, saving, and budgeting. A slight percentage increase in mortgage rates can translate to thousands of dollars over the loan’s lifetime.
- Identifying Trends and Volatility: Financial analysts use percentage changes to spot market trends, assess volatility, and understand the magnitude of price movements in securities, commodities, or real estate. Significant percentage swings often signal underlying economic shifts or market sentiment.
In essence, percentage change moves beyond raw data to offer proportional insights, enabling more intelligent analysis and strategic financial planning.
The Fundamental Formula for Financial Analysis
Calculating percentage change is a straightforward process once you understand its core formula. This formula serves as the backbone for countless financial calculations, from basic personal budgeting to complex investment analysis.
Deconstructing the Percentage Change Formula
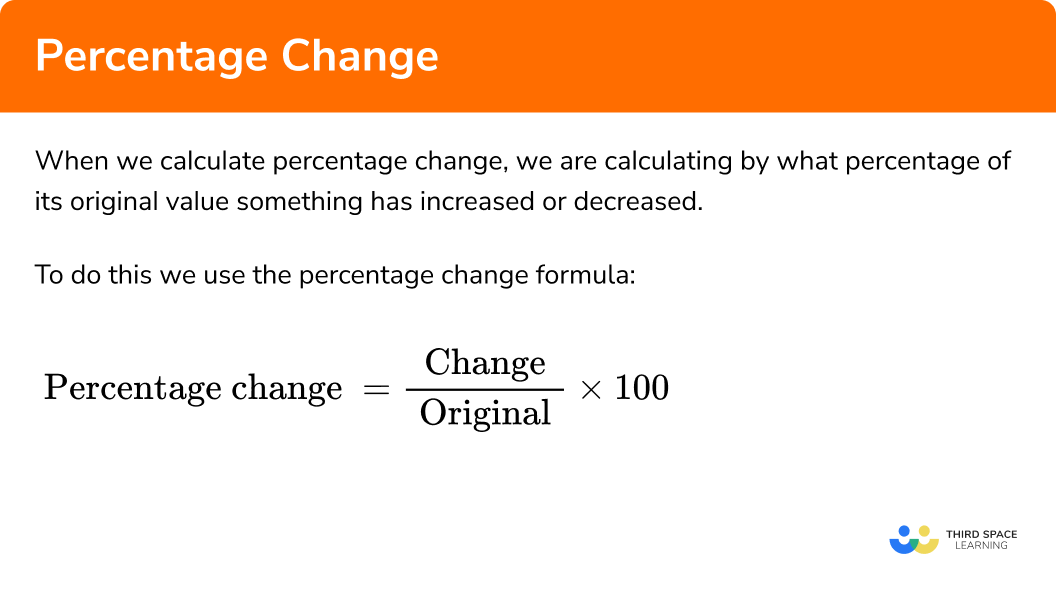
The universal formula for calculating percentage change is:
Percentage Change = ((New Value – Old Value) / Old Value) * 100
Let’s break down each component:
- New Value (or Final Value): This is the quantity after the change has occurred. It could be your current portfolio value, this month’s expenses, or a company’s latest revenue figure.
- Old Value (or Initial Value/Base Value): This is the quantity before the change occurred. It represents the starting point – your initial investment, last month’s expenses, or the previous quarter’s revenue.
- New Value – Old Value: This part of the formula calculates the absolute change or the raw difference between the two values. A positive result indicates an increase, while a negative result signifies a decrease.
- Divided by Old Value: Dividing the absolute change by the old value normalizes the change. It expresses the absolute change as a fraction of the starting amount. This fraction is essentially the decimal representation of the percentage change.
- Multiplied by 100: Finally, multiplying the result by 100 converts the decimal fraction into a percentage, making it easier to read and interpret.
Step-by-Step Calculation Guide
Let’s walk through an example to solidify the process, focusing on a personal finance scenario:
Scenario: You invested $5,000 in a mutual fund. One year later, its value has grown to $5,750. What is the percentage change in your investment?
- Identify the Old Value: Old Value = $5,000 (your initial investment).
- Identify the New Value: New Value = $5,750 (the current value of your investment).
- Calculate the Absolute Change (New Value – Old Value):
$5,750 – $5,000 = $750 - Divide the Absolute Change by the Old Value:
$750 / $5,000 = 0.15 - Multiply by 100 to get the Percentage Change:
0.15 * 100 = 15%
Therefore, your investment experienced a 15% increase.
Differentiating Increases and Decreases
The formula inherently handles both increases and decreases, with the sign of the result indicating the direction of the change:
- Positive Percentage Change: If the New Value is greater than the Old Value, the absolute change will be positive, resulting in a positive percentage. This signifies a growth or increase. (e.g., the 15% increase in the investment example).
- Negative Percentage Change: If the New Value is less than the Old Value, the absolute change will be negative, resulting in a negative percentage. This signifies a decline or decrease.
Example of a Decrease: Your monthly utility bill was $120 last month (Old Value). This month, due to energy-saving efforts, it’s $96 (New Value).
- Absolute Change: $96 – $120 = -$24
- Divide by Old Value: -$24 / $120 = -0.20
- Multiply by 100: -0.20 * 100 = -20%
Your utility bill experienced a 20% decrease. The negative sign clearly indicates a reduction. Always pay attention to the sign to accurately interpret the financial implication.
Practical Applications in Personal and Business Finance
The ability to calculate percentage change isn’t just an academic exercise; it’s a vital skill with direct, tangible applications across the entire spectrum of financial management. From safeguarding your personal wealth to steering a multi-million dollar enterprise, percentage change provides crucial insights.
Analyzing Investment Returns
Perhaps the most common financial application of percentage change is in evaluating investment performance.
- Stocks and Portfolios: Investors constantly calculate percentage gains or losses to assess how well their stocks, mutual funds, or entire portfolios are performing. Knowing that a stock gained 8% in a quarter provides a clear, comparable metric of its growth.
- Cryptocurrencies: Given their volatility, percentage changes are essential for understanding the rapid price swings in the crypto market, allowing traders to gauge risk and potential returns.
- Real Estate: When buying or selling property, percentage appreciation or depreciation over time helps in understanding market trends and making informed decisions about equity.

For example, comparing a 7% return on a bond fund with a 12% return on an equity fund (calculated as percentage change over the same period) provides clear evidence of which asset class outperformed, helping to guide future asset allocation strategies.
Tracking Budgetary Shifts
On a personal finance level, percentage change is invaluable for managing your income and expenses effectively.
- Income Growth/Decline: Has your salary increased by 5% year-over-year? Or has your side hustle income seen a 10% decrease? These percentage figures provide a vital reality check on your earning potential.
- Expense Management: By calculating the percentage change in categories like groceries, utilities, or entertainment month-over-month or year-over-year, you can quickly identify where your spending is increasing or decreasing. A sudden 20% spike in dining out expenses might prompt you to re-evaluate your habits.
- Savings Rate: If your savings increased by 15% from last year, it’s a clear indicator of improving financial discipline.
These insights empower you to adjust your budget, identify areas for cost-cutting, or celebrate financial progress.
Evaluating Business Performance
In the corporate world, percentage change is a fundamental metric used by executives, analysts, and investors to gauge a company’s health and trajectory.
- Revenue Growth: A company’s quarter-over-quarter or year-over-year percentage revenue growth is a primary indicator of market penetration and sales effectiveness. A consistent 10%+ growth is often highly valued.
- Profit Margins: Changes in gross or net profit margins (e.g., net profit increased by 15% while revenue only increased by 5%) can reveal improvements in operational efficiency or cost management.
- Operational Costs: Tracking the percentage change in expenses like manufacturing costs, marketing spend, or administrative overhead helps businesses control expenditures and optimize profitability.
- Market Share: Percentage change in market share indicates a company’s competitive standing and whether it’s gaining or losing ground against rivals.
Financial reports are replete with percentage changes because they offer a standardized, easily digestible overview of a company’s financial story, crucial for strategic planning and investor relations.
Understanding Inflation and Purchasing Power
Percentage change also plays a critical role in understanding broader economic phenomena.
- Inflation Rate: Inflation is typically expressed as a percentage change in the Consumer Price Index (CPI) over a period, indicating how quickly the cost of living is rising. A 3% inflation rate means that, on average, goods and services cost 3% more than they did a year ago.
- Real Returns: To understand the true growth of your investments, you must consider the inflation rate. If your investment yields a 7% return, but inflation is 3%, your “real return” (the actual increase in your purchasing power) is effectively 4%. This requires a slightly more complex calculation, but it underscores how percentage changes in different financial metrics interact.
By applying percentage change calculations, individuals and businesses can make more informed decisions, adjust strategies proactively, and gain a clearer perspective on their financial standing relative to the economic environment.
Common Pitfalls and Nuances to Consider
While the percentage change formula is straightforward, its application in real-world financial scenarios often comes with nuances that can lead to misinterpretations if not carefully considered. Awareness of these subtleties is key to truly insightful analysis.
The Importance of the Starting Point (Base Value Matters)
The “Old Value” or base value in the percentage change formula is critically important. A small absolute change can appear as a massive percentage change if the base value is very small, potentially leading to an exaggerated perception of growth or decline.
- Example: A business goes from $100 in monthly revenue to $200. This is a 100% increase. Impressive, but the absolute gain is only $100. If the business then goes from $1,000,000 to $1,000,100, that’s only a 0.01% increase, even though the absolute gain is the same $100.
- Implication: Always consider the absolute values alongside the percentage changes, especially when comparing vastly different scales. Contextualizing the base value helps temper overly optimistic or pessimistic conclusions drawn solely from percentages.
Dealing with Zero or Negative Base Values
A significant mathematical limitation arises when the Old Value (the denominator in the formula) is zero or negative.
- Zero Old Value: If the initial value is zero, the division by zero is undefined. For example, if a startup had $0 revenue last year and $100,000 this year, a percentage change cannot be calculated. In such cases, it’s more appropriate to report the absolute change or state that growth was from zero.
- Negative Old Value: Calculating a percentage change from a negative value (e.g., a company going from a loss of -$500,000 to a loss of -$250,000, or even to a profit of $100,000) can yield results that are mathematically correct but intuitively misleading. For instance, moving from -$500,000 to -$250,000 technically represents a 50% increase (less negative), but it’s still a loss. Converting from a loss to a profit often results in very large, hard-to-interpret percentages.
- Workarounds: In situations with negative or zero bases, consider using absolute changes, reporting revenue instead of profit percentages, or employing alternative metrics like profit improvement in dollars rather than percentages. Explain the context thoroughly.
Annualized vs. Period-Specific Changes
Financial data often comes with specific timeframes, and understanding whether a percentage change is annualized or specific to a shorter period is vital.
- Period-Specific: A 2% increase in your stock portfolio over one month is very different from a 2% increase over one year. The monthly increase, if consistent, suggests a much higher annualized return.
- Annualized Change: To compare returns across different timeframes, financial professionals often annualize returns. This involves projecting a shorter period’s growth over a full year. For example, a 2% monthly return annualizes to approximately (1+0.02)^12 – 1 = 26.8% per year.
- Implication: Always clarify the period over which the percentage change is being reported. Misinterpreting a quarterly gain as an annual gain can lead to wildly inaccurate financial projections.
Combining Multiple Percentage Changes
A common mistake is assuming that multiple percentage changes can simply be added together. They cannot.
- Example: If your investment increases by 10% in year one and then decreases by 10% in year two, it does not return to its original value.
- Start with $100.
- Year 1: $100 + (10% of $100) = $100 + $10 = $110.
- Year 2: $110 – (10% of $110) = $110 – $11 = $99.
- You are left with $99, a 1% loss from the original $100.
- Correct Approach: To combine multiple percentage changes, you must apply each change sequentially to the new base created by the previous change. For cumulative returns, one typically multiplies the factors (1 + percentage change as a decimal).
- Implication: When calculating cumulative growth or decline over several periods, always apply changes in sequence or use compounded growth formulas to avoid significant errors in your financial calculations.
By being mindful of these pitfalls and nuances, you can move beyond simple calculation to derive more accurate, meaningful, and context-aware financial insights from percentage changes.
Leveraging Financial Tools for Efficiency
While the manual calculation of percentage change is essential for understanding the concept, modern financial tools can automate and simplify the process, especially when dealing with large datasets or complex scenarios. Utilizing these tools not only saves time but also reduces the likelihood of human error.
Spreadsheet Software (Excel, Google Sheets) for Automation
Spreadsheets are arguably the most ubiquitous and powerful tools for financial calculations, including percentage change.
- Formulas: Both Excel and Google Sheets allow you to easily set up formulas. If your old value is in cell A1 and your new value is in cell B1, the formula for percentage change would simply be
=(B1-A1)/A1*100. - Batch Processing: For tracking multiple investments, monthly expenses, or different business metrics, you can quickly drag formulas down columns or across rows to apply the calculation to hundreds or thousands of data points instantly.
- Charting and Visualization: Once calculated, percentage changes can be easily plotted on charts (line graphs, bar charts) to visualize trends and compare performance over time, making financial analysis more intuitive and engaging.
- Conditional Formatting: You can set up rules to automatically highlight positive (green) or negative (red) percentage changes, providing immediate visual cues for performance.
For anyone regularly working with financial data, proficiency in spreadsheet software is non-negotiable for efficient and accurate percentage change analysis.
Online Calculators and Financial Apps
For quick, one-off calculations or on-the-go analysis, a plethora of online calculators and financial mobile apps are readily available.
- Dedicated Percentage Change Calculators: Many websites offer simple interfaces where you input the old and new values, and it instantly spits out the percentage change. These are great for immediate needs without opening a full spreadsheet.
- Budgeting Apps: Most personal finance and budgeting apps automatically track your spending categories and often provide month-over-month or year-over-year percentage changes for your expenses and income, helping you monitor your financial health effortlessly.
- Investment Platforms: Brokerage accounts and investment management apps frequently display percentage gains/losses for individual holdings and your overall portfolio, updating in real-time or near real-time.
These tools offer convenience and accessibility, making financial calculations less daunting for everyday users.
When to Seek Professional Financial Advice
While calculating a percentage change is a fundamental skill, interpreting its implications within a broader financial context can be complex. There are situations where professional financial advice becomes invaluable:
- Complex Investment Strategies: If you’re dealing with multi-asset portfolios, international investments, or complex financial instruments, understanding how various percentage changes interact and contribute to overall risk and return requires expertise.
- Tax Implications: Percentage gains and losses on investments have tax consequences. A financial advisor or tax professional can help you understand these implications and plan accordingly.
- Retirement Planning and Wealth Management: Long-term financial planning involves projecting percentage growth rates, factoring in inflation, and making assumptions about future market performance. A professional can help build robust models and personalized strategies.
- Business Financial Analysis: For small business owners, interpreting revenue growth percentages, profit margin changes, and cash flow fluctuations can be critical for strategic decision-making, fundraising, or expansion plans. An accountant or business financial advisor can provide deeper insights.
Understanding how to calculate a percentage change is a cornerstone of financial literacy. But knowing when to leverage technology for efficiency and when to consult an expert for nuanced interpretation ensures that your financial decisions are not only numerically sound but also strategically wise.
aViewFromTheCave is a participant in the Amazon Services LLC Associates Program, an affiliate advertising program designed to provide a means for sites to earn advertising fees by advertising and linking to Amazon.com. Amazon, the Amazon logo, AmazonSupply, and the AmazonSupply logo are trademarks of Amazon.com, Inc. or its affiliates. As an Amazon Associate we earn affiliate commissions from qualifying purchases.