
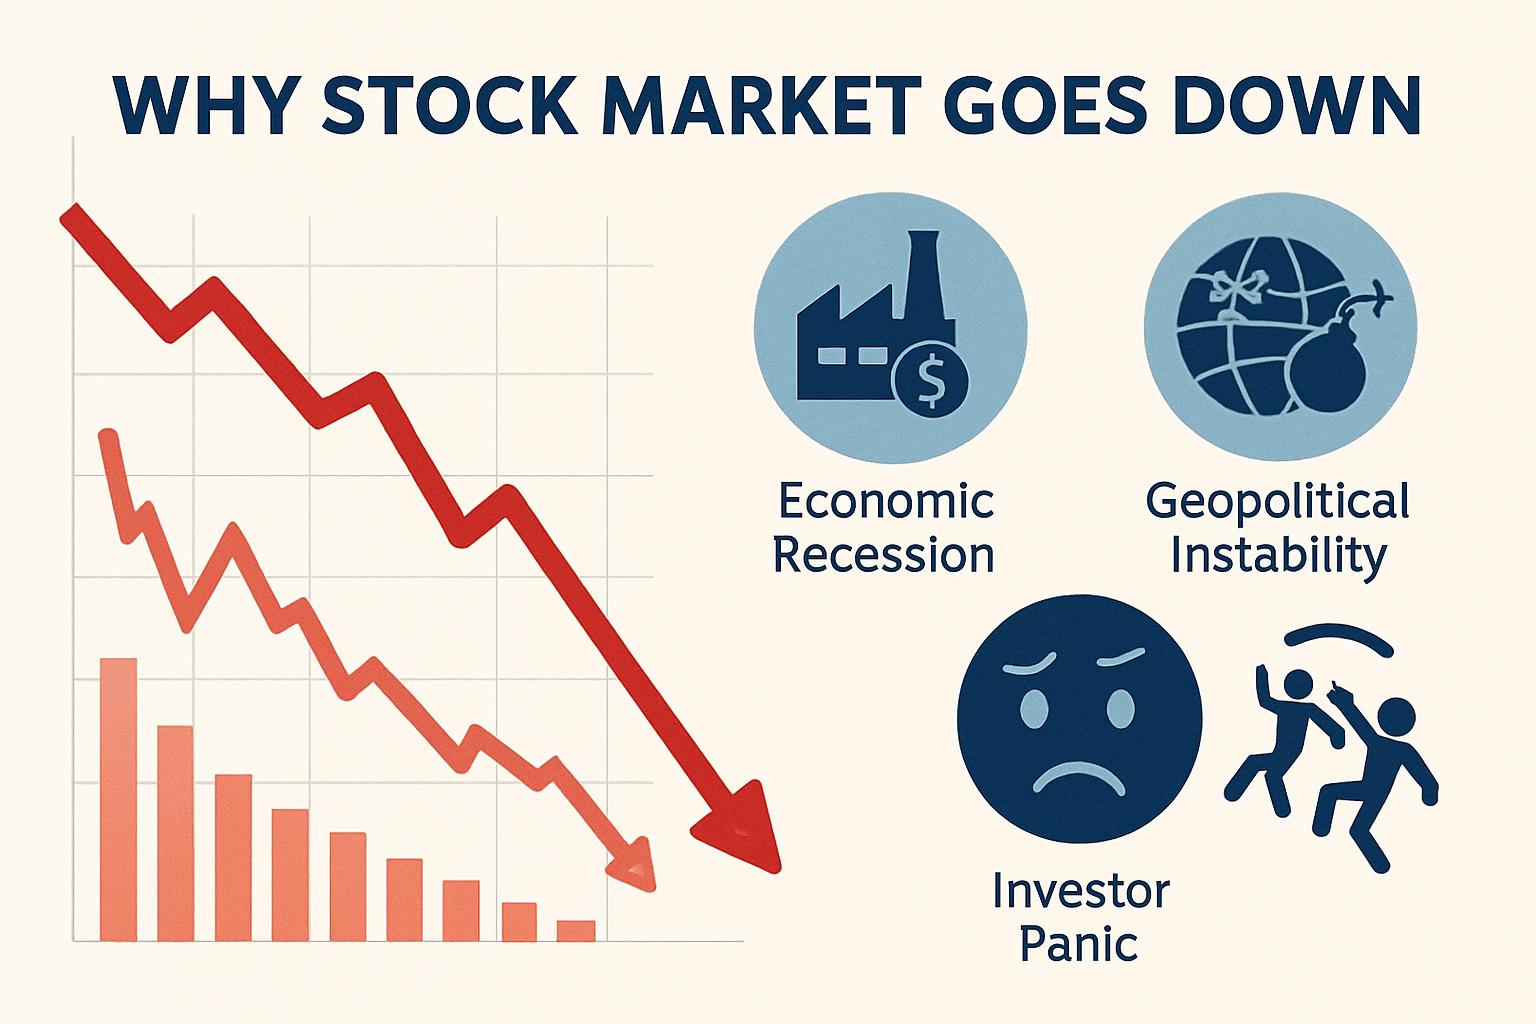
For many investors, opening a brokerage app to find a sea of red can be a jarring experience. While the long-term trajectory of the equity markets has historically been upward, the day-to-day movements are often dictated by a complex web of economic data, psychological triggers, and global events. When the stock market goes down, it is rarely due to a single isolated incident; rather, it is usually a confluence of factors that shift the balance between buyers and sellers.
Understanding why the market is retreating today requires a deep dive into the mechanics of finance, the current state of the global economy, and the shifting expectations of institutional investors.
1. Macroeconomic Drivers: Interest Rates and Inflation
The most significant driver of stock market movement in the modern era is the direction of macroeconomic policy, specifically as it pertains to the cost of borrowing money.
The Federal Reserve and Monetary Policy
At the heart of market fluctuations is the Federal Reserve (or the relevant central bank in other jurisdictions). Investors pay close attention to the “Federal Funds Rate.” When the Fed signals that it may raise interest rates—or keep them higher for longer—the stock market often reacts negatively. Higher interest rates increase the cost of doing business, which can compress profit margins. Furthermore, higher rates increase the “discount rate” used in financial models to value future cash flows. For growth-oriented companies, whose value is largely based on earnings far in the future, a higher discount rate significantly lowers their present-day valuation.
Inflationary Pressures and the CPI
Inflation is the silent enemy of equity markets. When the Consumer Price Index (CPI) or the Producer Price Index (PPI) comes in higher than expected, it signals to the market that the purchasing power of the dollar is eroding. High inflation forces central banks to remain aggressive with rate hikes. Additionally, inflation increases input costs for companies—from raw materials to labor—which can lead to earnings misses if the company cannot pass those costs on to consumers.
Bond Yields and the Equity Risk Premium
There is a constant tug-of-war between the stock market and the bond market. When the yield on the 10-year Treasury note rises, it offers investors a “risk-free” alternative to stocks. If an investor can get a guaranteed 4% or 5% return from government debt, they are less likely to risk their capital in the volatile stock market unless they expect a significantly higher “Equity Risk Premium.” A spike in bond yields often leads to a rotation out of stocks and into fixed-income assets, driving stock prices down.
2. Corporate Fundamentals and Earnings Season
While macroeconomics sets the stage, individual corporate performance provides the script. The stock market is ultimately a collection of businesses, and if those businesses aren’t performing as expected, the market will reflect that reality.
The Impact of Forward Guidance
During earnings season, companies report their profits for the previous quarter. However, the market is forward-looking. A company might report record-breaking profits for the past three months, but if management issues “weak guidance”—suggesting that sales will slow down in the next six months—the stock price will likely tumble. Investors buy stocks for what they will earn tomorrow, not what they earned yesterday. When several bellwether companies (large, influential firms like Apple, Microsoft, or Walmart) issue cautious outlooks, it can drag down the entire index.
Profit Margin Contraction
Even if revenue (total sales) remains high, the market reacts poorly to shrinking profit margins. Margin contraction occurs when the cost of goods sold (COGS) rises faster than the company can raise prices. In a “down” market day, we often see reports of rising labor costs or supply chain disruptions that threaten the bottom line of major corporations.
Sector-Specific Downturns
Sometimes, the market isn’t down because of a general economic malaise, but because a specific heavy-hitting sector is struggling. For example, if the technology sector—which makes up a massive percentage of the S&P 500 and Nasdaq—faces regulatory scrutiny or a slowdown in semiconductor demand, the broader indices will fall even if other sectors like healthcare or utilities are performing well.
3. Geopolitical Tensions and Global Uncertainty
Markets crave stability and predictability. Geopolitical instability introduces “unknown unknowns,” which lead investors to pull back and move into “safe-haven” assets like gold or the US Dollar.
Trade Relations and Tariffs
Global trade is the lifeblood of many multinational corporations. When trade tensions escalate between major economies, such as the US and China, it threatens the global supply chain. The prospect of new tariffs or export bans can lead to a sell-off in sectors ranging from agriculture to high-end electronics. Investors fear that trade wars will lead to higher costs and lower demand, both of which are toxic for stock prices.
Energy Costs and Conflict
Geopolitical conflicts in oil-producing regions often lead to a spike in energy prices. Since energy is a primary input for almost every industry—from transportation to manufacturing—a sudden increase in the price of crude oil acts as a “tax” on the global economy. High energy prices dampen consumer spending and increase corporate overhead, often leading to a broad market retreat.
The “Flight to Quality”
In times of international crisis, institutional investors often engage in a “flight to quality.” This means selling off “riskier” assets like equities (stocks) and moving that money into “cash” or government bonds. This mass exodus of capital from the equity market creates a downward pressure on prices, regardless of how well individual companies are actually performing.
4. Investor Psychology and Technical Market Factors
The stock market is not just a reflection of data; it is a reflection of human emotion and programmed algorithms. Fear and greed are the two primary drivers of short-term price action.
The Role of Algorithmic Trading
In the modern era, a significant portion of daily trading volume is executed by computers using high-frequency trading (HFT) algorithms. These programs are often set to sell automatically when certain “technical levels” are breached. For instance, if the S&P 500 falls below its 200-day moving average, it can trigger a wave of automated selling. This creates a feedback loop where a small decline triggers algorithms to sell, which causes a larger decline, triggering even more selling.
Margin Calls and Liquidity Crunches
Many institutional investors and hedge funds trade on “margin,” meaning they borrow money to increase their position sizes. When the market begins to fall, the value of their collateral decreases. If it falls too far, lenders issue “margin calls,” requiring the investor to either deposit more cash or sell their positions immediately. This forced selling can lead to a “liquidity crunch,” where there are plenty of sellers but very few buyers, causing prices to gap down rapidly.
Fear, Uncertainty, and Doubt (FUD)
Investor sentiment is a powerful force. The “Fear & Greed Index” is a popular tool used to measure the mood of the market. When news headlines are dominated by talk of a looming recession, housing bubbles, or banking crises, retail and institutional investors alike may choose to “wait on the sidelines.” This lack of buying pressure means that even a small amount of selling can have a disproportionate impact on prices.
Conclusion: Maintaining Perspective in a Down Market
When the stock market is going down today, it is easy to succumb to panic. However, for the disciplined investor, these downturns are part of the natural rhythm of the financial world. Whether the decline is driven by a hawkish Federal Reserve, disappointing corporate earnings, geopolitical strife, or technical sell-offs, it is important to remember that volatility is the price of admission for long-term gains.
Market corrections—defined as a 10% drop from recent highs—occur on average about once a year. Bear markets—a 20% drop—occur roughly every three to five years. By understanding the specific “Money” drivers behind today’s decline, investors can move away from emotional reactions and toward a more clinical, strategic approach to their portfolios. In many cases, what looks like a crisis in the short term is merely a valuation adjustment that sets the stage for the next leg of a bull market.
aViewFromTheCave is a participant in the Amazon Services LLC Associates Program, an affiliate advertising program designed to provide a means for sites to earn advertising fees by advertising and linking to Amazon.com. Amazon, the Amazon logo, AmazonSupply, and the AmazonSupply logo are trademarks of Amazon.com, Inc. or its affiliates. As an Amazon Associate we earn affiliate commissions from qualifying purchases.