
In the world of high-stakes finance, few questions are asked more frequently than “Where is the Dow today?” For millions of investors, from institutional hedge fund managers to retail traders checking their 401(k) balances, the Dow Jones Industrial Average (DJIA) serves as the ultimate pulse check for the American economy. While the stock market is a complex web of indices, the Dow remains the most iconic, representing thirty of the most influential “blue-chip” companies in the United States.
Understanding where the Dow stands at any given moment requires more than just looking at a flashing green or red number on a screen. It requires an analysis of the underlying economic forces, corporate health, and investor sentiment that drive the index. In this deep dive, we explore the mechanics of the Dow, the factors currently influencing its position, and how investors should interpret its daily movements to build long-term wealth.

Understanding the Dow Jones Industrial Average: More Than Just a Number
To answer “where the Dow is,” one must first understand what it actually represents. Established in 1896 by Charles Dow and Edward Jones, the index was originally a simple average of twelve industrial stocks. Today, it has evolved into a sophisticated barometer of the modern economy, though it retains some of its idiosyncratic traditional traits.
The Composition of the Dow: The 30 Blue-Chip Titans
The Dow is not a broad market index like the S&P 500. Instead, it is a curated list of 30 large, publicly owned companies based in the United States. These are firms that are leaders in their respective industries, ranging from technology (Microsoft, Apple) and finance (Goldman Sachs, JPMorgan Chase) to healthcare (UnitedHealth Group) and consumer goods (Coca-Cola, Walmart).
When the Dow moves, it reflects the collective performance of these giants. Because these companies are deeply integrated into the global supply chain and consumer habits, their success—or failure—is often viewed as a proxy for the health of the broader U.S. corporate sector.
How the Index is Calculated: The Price-Weighted Model
Unlike most modern indices that are market-capitalization-weighted (meaning larger companies have a bigger impact), the Dow is price-weighted. This means that companies with higher share prices have a more significant influence on the index’s daily movement than those with lower share prices, regardless of their total market value.
This unique calculation method is why a significant price swing in a stock like UnitedHealth or Goldman Sachs can “move the needle” on the Dow more than a similar percentage move in a lower-priced stock. Understanding this distinction is crucial for investors who are trying to decipher why the Dow might be up while other indices are flat.
Factors Influencing Where the Dow Sits Today
The Dow does not move in a vacuum. Its daily position is the result of a constant tug-of-war between various macroeconomic and microeconomic variables. To understand the “where” and “why” of today’s market, we must look at the external pressures currently at play.
Macroeconomic Indicators: Interest Rates and Inflation
Perhaps the most significant driver of the Dow in the current era is the Federal Reserve’s monetary policy. Interest rates are the gravity of the financial markets. When the Fed raises rates to combat inflation, borrowing costs for corporations rise, and the present value of future earnings decreases, often leading to a dip in the Dow.
Conversely, when inflation shows signs of cooling and the prospect of rate cuts emerges, the Dow often rallies. Investors today are hyper-focused on Consumer Price Index (CPI) data and employment reports, as these figures dictate the Fed’s next move. If the Dow is “up” today, it is often because the market perceives a “dovish” (low-rate) environment; if it is “down,” “hawkish” (high-rate) fears may be the culprit.
Corporate Earnings Reports: The Heartbeat of the Index
Every quarter, the 30 components of the Dow release their earnings reports. These documents provide a transparent look at revenue growth, profit margins, and—most importantly—future guidance. Because the Dow only contains 30 stocks, an earnings “miss” by a major component like Boeing or Caterpillar can have a disproportionate impact on the index. Today’s Dow position is frequently a reflection of “Earnings Season” sentiment, where investors react to how well these industrial leaders are navigating challenges like labor costs, supply chain disruptions, and global demand.

Geopolitical Events and Market Sentiment
The Dow is sensitive to global stability. Trade tensions, international conflicts, or shifts in energy prices can cause immediate volatility. Beyond the hard data, “where the Dow is” is also a reflection of investor psychology. Fear and greed are powerful movers. During periods of uncertainty, investors may rotate out of the Dow’s cyclical stocks and into “defensive” sectors, or they may flee the market entirely, causing the index to retreat toward key support levels.
Interpreting Daily Fluctuations: Bullish vs. Bearish Trends
When looking at the Dow’s position today, it is easy to get caught up in the “noise” of daily trading. However, sophisticated investors differentiate between short-term volatility and long-term trends.
Short-Term Noise vs. Long-Term Growth
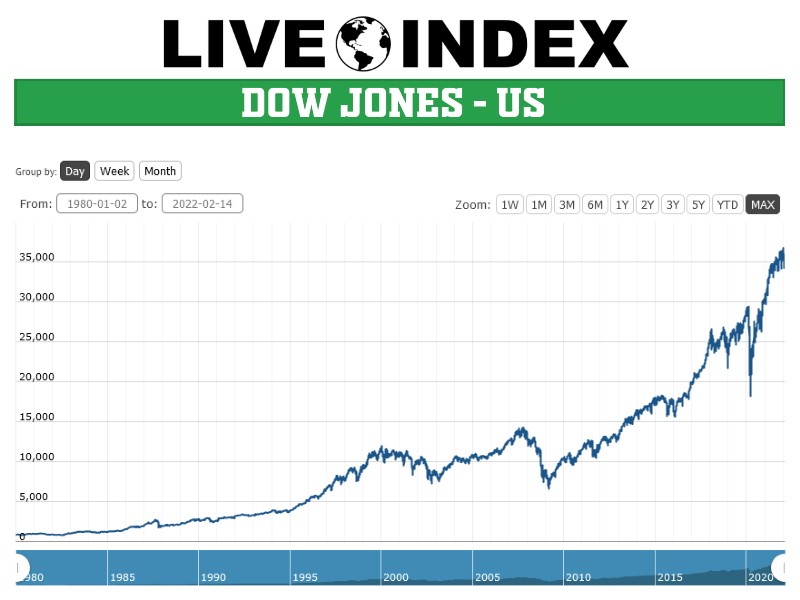
A 300-point drop in a single day might seem catastrophic, but in the context of a 40,000-point index, it represents less than a 1% move. Daily fluctuations are often driven by algorithmic trading, high-frequency “scalping,” or immediate reactions to breaking news. To truly understand where the Dow is, one must look at the 50-day and 200-day moving averages. These technical indicators smooth out the daily “noise” and show whether the index is in a sustained “Bull” market (upward trend) or a “Bear” market (downward trend).
The Role of Institutional vs. Retail Trading
The “where” of the Dow is also influenced by who is doing the buying. Institutional investors—pension funds, insurance companies, and mutual funds—often trade based on long-term fundamentals. Retail investors, empowered by commission-free trading apps, often trade based on momentum and sentiment. When these two groups are in alignment, the Dow sees strong, trending movements. When they are at odds, the index often experiences “choppy” or sideways price action.
How to Use Dow Data for Your Investment Strategy
Monitoring where the Dow is today should not just be an exercise in curiosity; it should inform your personal finance and investment strategy. However, the Dow should be a starting point, not the entirety of your plan.
Diversification Beyond the 30
While the Dow is a great indicator of large-cap industrial strength, it lacks exposure to small-cap companies, emerging technologies, and international markets. An investor who only tracks the Dow might miss out on the growth happening in the broader market. A sound financial strategy involves using the Dow as a benchmark for the “stability” portion of a portfolio while diversifying into other asset classes to capture broader economic growth.
Using Index Funds and ETFs
For those who want their portfolio to mirror the Dow, Exchange-Traded Funds (ETFs) like the SPDR Dow Jones Industrial Average ETF Trust (DIA) allow investors to “buy the Dow.” This provides instant diversification across 30 of the world’s most stable companies. By tracking where the Dow is today, investors can practice “dollar-cost averaging”—investing a set amount of money at regular intervals regardless of the price—to mitigate the risk of buying at a market peak.
The Future Outlook: What Current Positions Signal for Investors
As we look at the Dow today, we must also look ahead. The index is not just a record of the past; it is a forward-looking mechanism that attempts to price in what the economy will look like six to nine months from now.
Technical Analysis and Key Resistance Levels
Market analysts often look at “resistance” and “support” levels. If the Dow is hovering near an all-time high, it may face “resistance” as investors take profits. If it is falling, it may find “support” at previous lows where buyers see value. Understanding these psychological thresholds helps investors avoid the trap of “panic selling” during a dip or “FOMO buying” (Fear Of Missing Out) during a peak.
Psychological Thresholds: The Milestone Mentality
There is a significant psychological component to the Dow. Crossing major milestones—such as 30,000, 35,000, or 40,000—often triggers a wave of media coverage and renewed retail interest. While these numbers are technically arbitrary, they hold power in the collective mind of the investing public. When the Dow sits just below a major milestone, the “where” becomes a matter of momentum; once a milestone is breached, it often becomes a new floor for future growth.
In conclusion, “where the Dow is today” is a snapshot of a living, breathing financial ecosystem. It is a reflection of corporate earnings, federal policy, global stability, and human emotion. For the disciplined investor, the Dow is more than a headline; it is a tool for understanding the present and planning for a prosperous financial future. By looking beyond the daily points and focusing on the underlying trends, you can navigate the complexities of the market with confidence and clarity.
aViewFromTheCave is a participant in the Amazon Services LLC Associates Program, an affiliate advertising program designed to provide a means for sites to earn advertising fees by advertising and linking to Amazon.com. Amazon, the Amazon logo, AmazonSupply, and the AmazonSupply logo are trademarks of Amazon.com, Inc. or its affiliates. As an Amazon Associate we earn affiliate commissions from qualifying purchases.