For investors, watching a portfolio dip into the red can be a visceral, anxiety-inducing experience. Whether it is a minor correction or a sustained bear market, the question on everyone’s mind is invariably the same: “When will stocks go back up?” While the financial markets are notoriously difficult to predict in the short term, they are not entirely mysterious. Market cycles are driven by a combination of macroeconomic data, corporate health, and human psychology.
Understanding when a recovery might begin requires looking past the daily ticker tape and analyzing the fundamental drivers of equity prices. To find the answer, we must examine the mechanics of market cycles, the historical precedents of recovery, and the specific economic indicators that signal a turning point.
Understanding the Mechanics of a Market Downturn
Before we can identify when stocks will rise, we must understand why they fell in the first place. Stock prices are essentially a reflection of two things: the current value of a company’s future earnings and the “risk premium” investors demand for holding those shares. When the outlook for either of these factors worsens, prices drop.
The Role of Interest Rates and Inflation
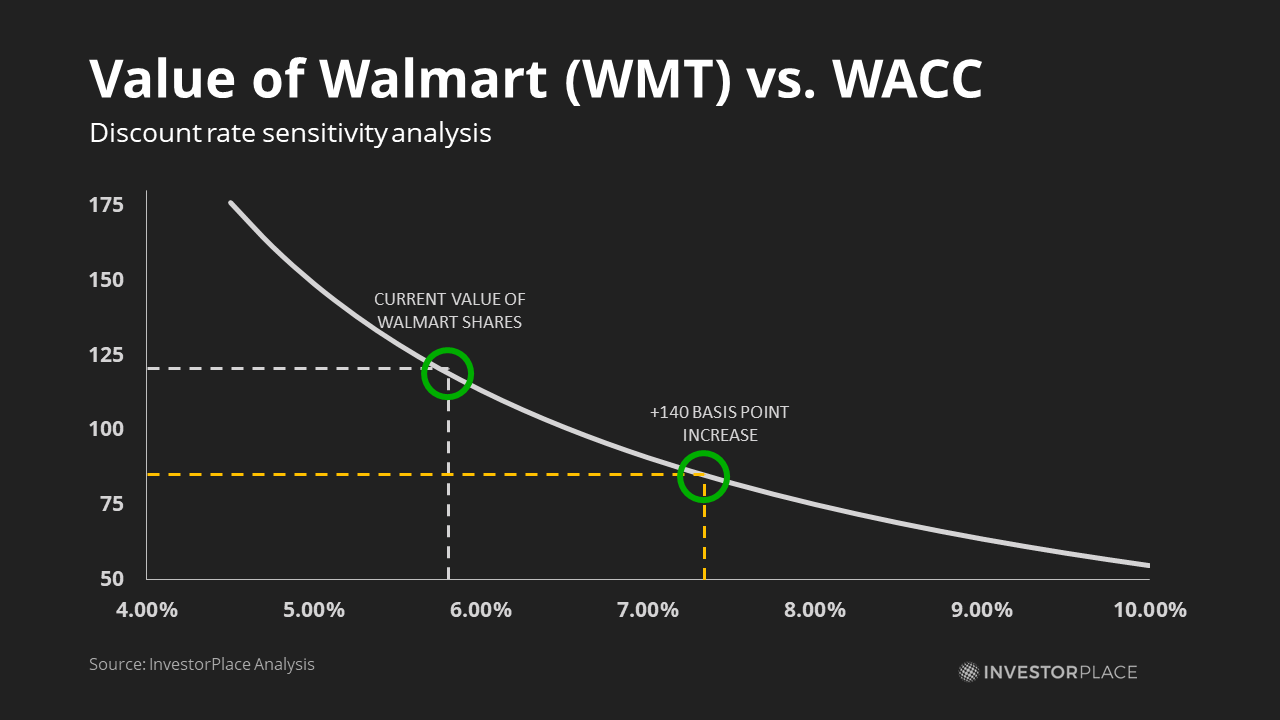
In the modern economic landscape, the Federal Reserve (or equivalent central banks) is often the primary driver of market direction. When inflation rises, the Fed increases interest rates to cool the economy. This has a two-pronged effect on stocks. First, higher rates make borrowing more expensive for companies, which can eat into profit margins and slow down expansion. Second, higher rates increase the “discount rate” used to value future cash flows. For high-growth companies—especially in the tech sector—this makes their future earnings worth less in today’s dollars, leading to sharp price declines.
Corporate Earnings and Growth Expectations
Stock prices eventually follow earnings. If a recession looms, analysts lower their expectations for how much profit companies will generate. When companies report “misses” or provide weak guidance for the coming quarters, investors sell off shares. A sustained market recovery usually cannot happen until earnings estimates stabilize or begin to tick upward again.
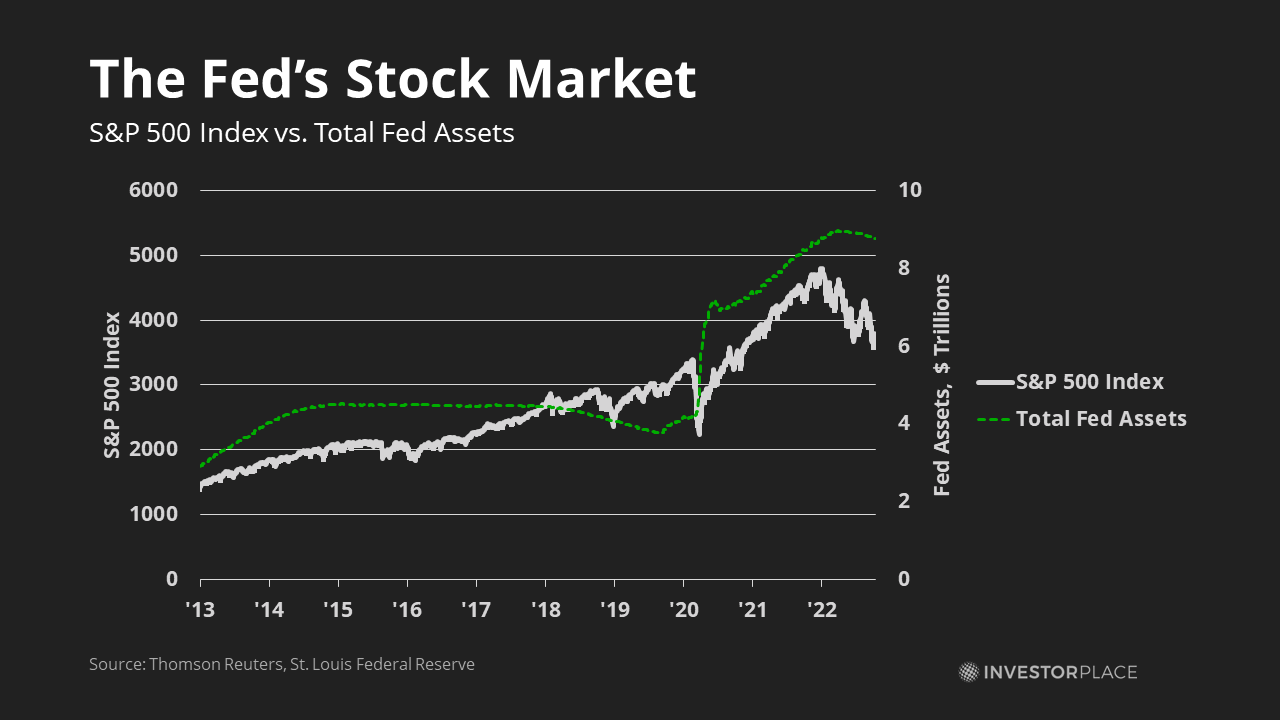
The Impact of Market Liquidity
In periods of high growth, liquidity is abundant. When the central bank shifts from “Quantitative Easing” (pumping money into the system) to “Quantitative Tightening” (pulling money out), there is simply less capital available to bid up asset prices. Stocks go back up when liquidity begins to neutralize, or when investors feel the “valuation” of a stock has finally become attractive enough to justify the risk.
Historical Precedents: How Long Do Bear Markets Last?
History does not repeat itself perfectly, but it often rhymes. Looking at historical data provides a sense of perspective that can help calm the nerves of a worried investor. Since World War II, the S&P 500 has weathered numerous downturns, and in every single instance, the market eventually surpassed its previous all-time highs.
The Difference Between Corrections and Bear Markets
It is important to distinguish between a “correction” (a drop of 10% to 20%) and a “bear market” (a drop of 20% or more). Corrections are relatively common, occurring roughly every 1.2 years on average, and they usually resolve within three to four months. Bear markets are rarer and more painful, typically lasting about 14 to 15 months. Knowing where we are in this timeline can help set expectations for a recovery.
Patterns of Recovery: V-Shaped vs. U-Shaped
Market recoveries typically take one of several forms. A “V-shaped” recovery is a sharp, rapid bounce back, often triggered by a massive policy shift or the resolution of a specific crisis (like the 2020 pandemic crash). A “U-shaped” recovery is more gradual, where the market “bottoms out” for several months as the economy slowly mends. Recognizing these patterns helps investors understand that “going back up” isn’t always a vertical line; it is often a jagged process of higher lows and higher highs.
The “Bottom” Often Happens During Bad News
One of the most counterintuitive aspects of the stock market is that it is a leading indicator. The market usually bottoms out and starts heading up about six months before the actual economy begins to improve. By the time the news headlines are positive and the unemployment rate is falling, the stock market has often already gained 20% or more from its lows. Therefore, waiting for “good news” to buy back in is often a recipe for missing the most explosive part of the recovery.
Key Indicators to Watch for a Potential Reversal
While we cannot time the bottom with precision, there are specific signals that suggest the tide is turning. Savvy investors watch these indicators to gauge when the “floor” has been set.
The Federal Reserve’s “Pivot”
The most significant signal for a market recovery is the “Fed Pivot.” This occurs when the central bank stops raising interest rates and either holds them steady or begins to cut them. Because high rates are a headwind for stocks, the mere anticipation of a pause in rate hikes can cause a massive rally. When the Fed moves from a “hawkish” (inflation-fighting) stance to a “dovish” (growth-supporting) stance, the stock market usually reacts with a sustained upward trend.
Inflation Cooling (CPI Data)
Since inflation is the primary reason for high interest rates, the Consumer Price Index (CPI) reports are arguably the most important monthly data points for investors. If CPI data shows that inflation is consistently cooling month-over-month, the market interprets this as a sign that the Fed can stop tightening. Once the “inflation dragon” is perceived to be slain, the path for stocks to go back up becomes much clearer.
Valuation Metrics and “Capitulation”
Market bottoms are often characterized by “capitulation”—a moment of extreme fear where the last remaining “bulls” give up and sell their shares in a panic. This is often reflected in the CBOE Volatility Index (VIX), often called the “Fear Gauge.” When the VIX spikes to extreme levels (usually above 30 or 40), it often signals that the selling is exhausted. Additionally, when the Price-to-Earnings (P/E) ratios of major indices fall below their historical averages, value investors begin to see “blood in the streets” as an opportunity to buy, creating a floor for prices.
Strategic Investing During a Down Market
Knowing that stocks will eventually go back up is one thing; managing your money while they are down is another. Success in investing is often determined by what you do when the market is at its worst.
The Power of Dollar-Cost Averaging (DCA)
One of the most effective strategies for dealing with a down market is Dollar-Cost Averaging. By investing a fixed amount of money at regular intervals, you automatically buy more shares when prices are low and fewer shares when prices are high. This lowers your average cost basis over time. Instead of trying to guess when the “bottom” is, DCA ensures that you are consistently building a position so that you are perfectly positioned when the eventual recovery occurs.
Portfolio Rebalancing and Quality Control
A down market is an excellent time to “clean house.” It reveals which companies have strong balance sheets and which were merely riding a wave of cheap money. Investors should focus on “Quality” factors: companies with high cash flow, low debt, and “moats” that protect their business models. Rebalancing your portfolio—selling some assets that have held up well to buy those that have been unfairly beaten down—can significantly boost long-term returns.
Tax-Loss Harvesting
For those in taxable accounts, a market downturn provides an opportunity for tax-loss harvesting. This involves selling securities at a loss to offset capital gains in other parts of your portfolio, potentially reducing your overall tax bill. This “silver lining” allows you to turn a market decline into a strategic financial advantage, provided you stay within the “wash-sale” rules.

Conclusion: The Importance of a Long-Term Perspective
The question of “when will stocks go back up” is ultimately a question of timing, but successful investing is a question of time. Market volatility is the “fee” that investors must pay for the long-term returns that equities provide. While the interim periods of decline are uncomfortable, they are also the periods where the greatest wealth is often created.
History shows that the stock market has an upward bias. It is fueled by human ingenuity, corporate productivity, and global economic expansion. While geopolitical tensions, interest rate cycles, and inflationary pressures can cause temporary retreats, they have never permanently halted the progress of the markets.
For the disciplined investor, the current “red” in a portfolio is not a permanent loss unless you sell. Instead, it is a period of consolidation. By focusing on fundamental indicators, maintaining a diversified strategy, and staying committed to a long-term plan, you can navigate the uncertainty. Stocks will go back up; the key is ensuring you are still in the game when they do.
aViewFromTheCave is a participant in the Amazon Services LLC Associates Program, an affiliate advertising program designed to provide a means for sites to earn advertising fees by advertising and linking to Amazon.com. Amazon, the Amazon logo, AmazonSupply, and the AmazonSupply logo are trademarks of Amazon.com, Inc. or its affiliates. As an Amazon Associate we earn affiliate commissions from qualifying purchases.