
The question of “when” is perhaps the most fundamental challenge in the world of finance. Whether you are a retail investor managing a modest 401(k) or a seasoned portfolio manager handling institutional capital, the timing of an entry or exit point determines the ultimate success of an investment strategy. “When stock prices are low” is a common mantra, yet the definition of “low” is subjective, shifting with every economic cycle, interest rate hike, and corporate earnings report. To master the art of timing, one must look beyond the ticker tape and understand the convergence of macroeconomics, fundamental valuation, and human psychology.
Investing is rarely about finding the “perfect” moment—which is often only visible in hindsight—but rather about identifying high-probability windows. This guide explores the multi-faceted layers of when to engage with the stock market, how to identify value, and the mechanisms that drive price action over time.
Understanding Market Cycles: The Macro Perspective
The stock market does not move in a straight line; it breathes in cycles. Understanding where we sit within these cycles is the first step in answering the question of when to buy or sell. These cycles are typically driven by broader economic forces, including central bank policies, inflation rates, and industrial productivity.
The Four Stages of the Market Cycle
Market cycles are generally divided into four distinct phases: accumulation, markup, distribution, and markdown.
-
Accumulation: This occurs after the market has bottomed. Institutional investors begin to buy again, believing the worst is over. Prices are flat, and sentiment is still bearish.
-
Markup: This is the classic “bull market.” Media coverage becomes positive, and retail investors jump in. Prices climb steadily.
-
Distribution: At this peak, volume is high but price progress stalls. Smart money begins to exit, selling to the “late arrivals.”
-
Markdown: This is the “bear market.” A catalyst triggers a sell-off, and prices drop rapidly as panic sets in.
Recognizing these phases helps an investor understand that “when stock prices are falling,” it may be a markdown phase to avoid, or the beginning of an accumulation phase to embrace.
The Role of Interest Rates and the Federal Reserve
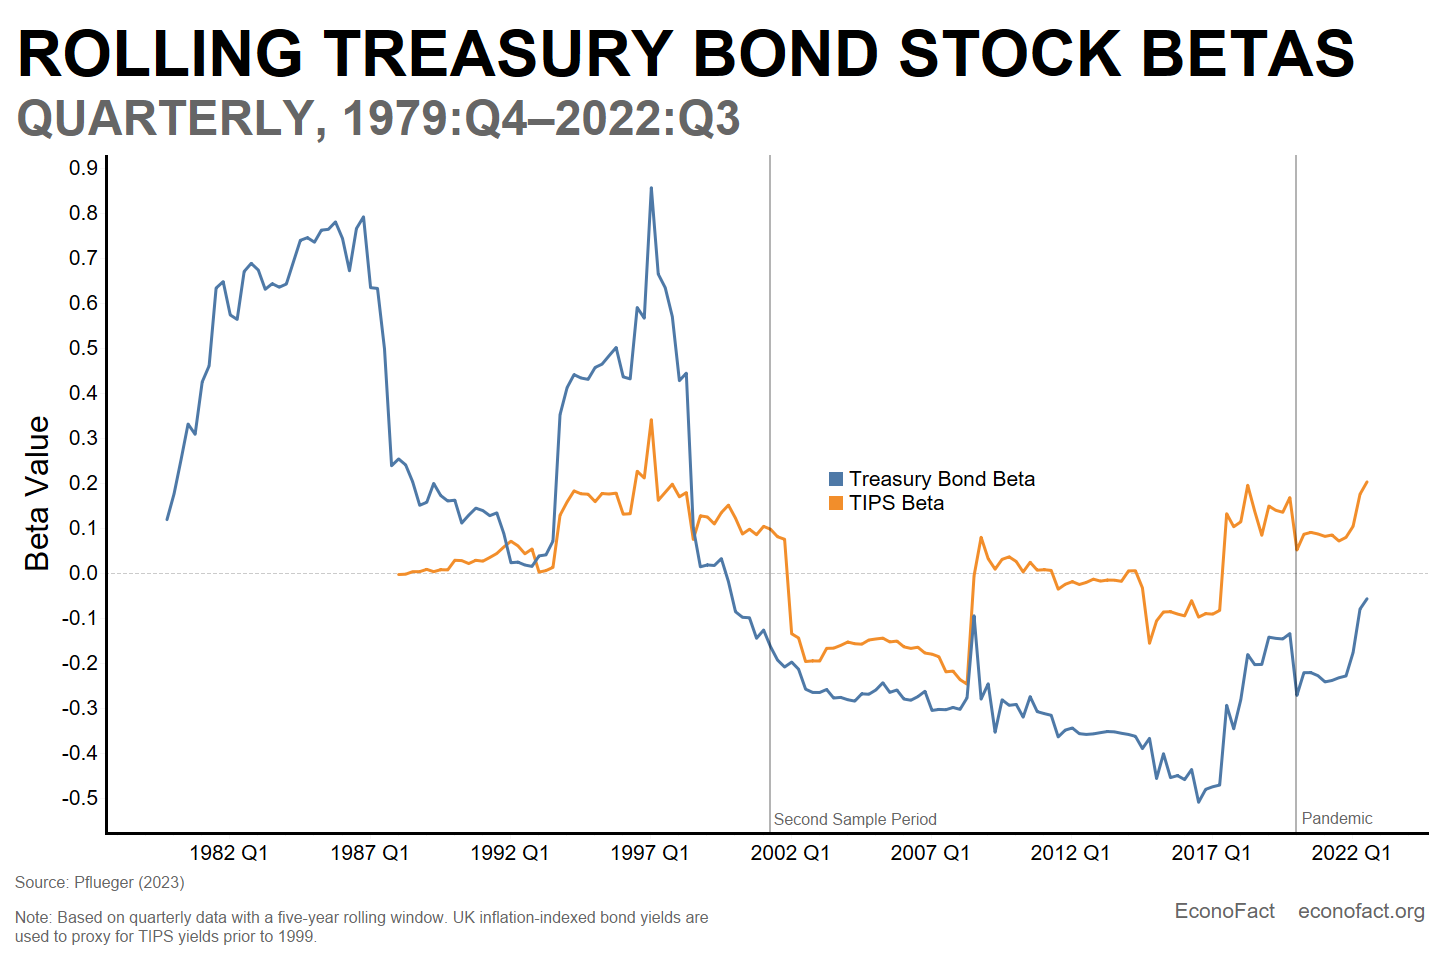
In the modern financial era, the “when” of stock investing is inextricably linked to the Federal Reserve. Interest rates act as the gravity for stock valuations. When rates are low, borrowing is cheap, corporate profits expand, and stocks become more attractive than bonds. Conversely, when the Fed raises rates to combat inflation, the discounted future cash flows of companies—especially growth and tech stocks—become less valuable today. Monitoring the “yield curve” and Fed “dot plots” provides a roadmap for when the macroeconomic environment is shifting from a tailwind to a headwind.
Valuation Metrics: Deciding When a Stock is “Cheap”
While the macro environment sets the stage, fundamental analysis tells you when an individual company is priced appropriately. A stock is not “cheap” simply because its price has dropped from $100 to $50; it is cheap only if its price is low relative to its intrinsic value and earnings potential.
Price-to-Earnings (P/E) and Beyond
The P/E ratio is the most common metric used to determine when a stock is a good value. However, a “low” P/E can sometimes be a “value trap”—a company whose price is low because its business model is failing. To refine this, investors often look at the PEG ratio (Price/Earnings to Growth). A PEG ratio below 1.0 often suggests that a stock is undervalued relative to its expected growth.
Another critical metric is the Price-to-Book (P/B) ratio, which compares a company’s market value to its actual assets. For capital-intensive industries like banking or manufacturing, a P/B ratio under 1.0 can be a strong signal for “when” to initiate a position, as it implies you are buying the company for less than the value of its physical parts.
Discounted Cash Flow (DCF) Analysis
For the sophisticated investor, the ultimate “when” is determined by a DCF analysis. This method involves forecasting a company’s future free cash flows and discounting them back to their present value using a required rate of return. If the current market price is significantly lower than this calculated “intrinsic value,” the stock is considered to have a “margin of safety.” This margin of safety is the quintessential indicator of when to buy, providing a buffer against errors in estimation or unexpected market volatility.
Behavioral Finance and the Psychology of Timing
Market timing is as much a psychological challenge as it is a mathematical one. Humans are evolutionarily wired to seek safety in numbers, which often leads to buying at the top (herd mentality) and selling at the bottom (panic). Mastery over one’s emotions is the secret ingredient to successful market timing.

Overcoming FOMO and Capitulation
The “Fear of Missing Out” (FOMO) often drives investors to buy when stock prices have already peaked. To counter this, disciplined investors utilize “rules-based” systems. For example, a rule might state that one should never buy a stock that is more than 20% above its 200-day moving average.
On the flip side is “capitulation”—the moment when the last remaining bulls give up and sell in a panic. Historically, the best time to buy is when the “VIX” (the market’s fear index) is at extreme highs. As the saying goes on Wall Street, “Buy when there is blood in the streets, even if the blood is your own.”
The Role of Contrarian Investing
Contrarian investing is the practice of going against prevailing market trends. It requires the fortitude to buy when the news cycle is negative and sell when optimism is at an all-time high. This doesn’t mean being stubborn; it means recognizing that when everyone is thinking the same thing, nobody is thinking at all. When stock sentiment is “excessively bullish,” it is often a signal to trim positions and raise cash.
Technical Analysis: Signals for Entry and Exit
While fundamental analysis tells you what to buy, technical analysis often tells you when to buy. By studying price action and volume, investors can identify patterns that suggest where a stock is headed in the short to medium term.
Moving Averages and Trend Lines
The 50-day and 200-day moving averages are the most watched indicators in the world. When a stock’s price crosses above its 200-day moving average, it is often seen as a “Golden Cross,” signaling a long-term shift into a bullish trend. Conversely, a “Death Cross” (when the 50-day drops below the 200-day) suggests a long-term bearish trend. These technical milestones provide objective data points for when to adjust exposure.
Relative Strength Index (RSI) and Momentum
The RSI is a momentum oscillator that measures the speed and change of price movements. It ranges from 0 to 100. Traditionally, a stock is considered “overbought” when the RSI is above 70 and “oversold” when it is below 30. For a swing trader, an RSI dipping below 30 is a primary signal for “when” a stock might be due for a relief rally.
Strategic Execution: Dollar-Cost Averaging vs. Lump Sum
Even after identifying the “when,” the question of “how” remains. How an investor enters a position can be just as important as the timing itself.
Mitigating Risk through Dollar-Cost Averaging (DCA)
For most individual investors, trying to time the exact bottom of a market is a losing game. Dollar-cost averaging—investing a fixed amount of money at regular intervals—removes the emotional burden of timing. By buying more shares when stock prices are low and fewer when they are high, the investor achieves a lower average cost per share over time. This strategy is particularly effective in volatile markets where the “true” bottom is unclear.
The Case for Lump Sum Investing
While DCA is safer emotionally, academic research often suggests that lump sum investing (investing all available capital at once) can yield higher returns because the market tends to go up more often than it goes down. However, this strategy requires a high risk tolerance. The decision of “when” to use a lump sum versus DCA often depends on the current valuation of the market. In a post-crash environment where valuations are historically low, a lump sum might be the superior choice. In a high-valuation, “frothy” market, DCA provides a necessary safety net.

Portfolio Rebalancing: The Systematic “When”
Finally, the most consistent way to handle “when stock” prices change is through systematic rebalancing. If your target allocation is 60% stocks and 40% bonds, and a massive stock market rally pushes your equity holdings to 70%, the market is essentially telling you it is time to sell.
By selling the “winners” (stocks) and buying the “underperformers” (bonds) to return to your 60/40 split, you are forced to sell high and buy low. This removes the need for “prediction” and replaces it with “reaction” based on mathematical targets. Rebalancing ensures that your portfolio stays aligned with your risk tolerance, regardless of whether the market is at a peak or a trough.
Timing the stock market is not a matter of luck; it is a discipline that combines economic awareness, valuation rigor, and emotional control. By understanding these frameworks, investors can stop asking “when stock prices will go up” and start asking “is the current price offering me an asymmetric risk-to-reward ratio?” The answer to that question is the only “when” that truly matters.
aViewFromTheCave is a participant in the Amazon Services LLC Associates Program, an affiliate advertising program designed to provide a means for sites to earn advertising fees by advertising and linking to Amazon.com. Amazon, the Amazon logo, AmazonSupply, and the AmazonSupply logo are trademarks of Amazon.com, Inc. or its affiliates. As an Amazon Associate we earn affiliate commissions from qualifying purchases.