
Predicting the exact moment Bitcoin will embark on its next parabolic move is the “holy grail” of the financial world. Since its inception in 2009, Bitcoin has transitioned from a niche experiment for cryptographers to a multi-trillion-dollar asset class embraced by Wall Street institutions. For the individual investor, the question “when is Bitcoin going up?” is not merely a matter of curiosity—it is a strategic inquiry into the mechanics of supply, demand, and global macroeconomics.
To understand when the next price surge is likely to occur, one must move beyond the noise of daily price fluctuations and examine the fundamental drivers that have historically propelled Bitcoin to new heights. By analyzing the four-year halving cycle, macroeconomic liquidity, and institutional adoption, investors can develop a clearer picture of where the market is headed.
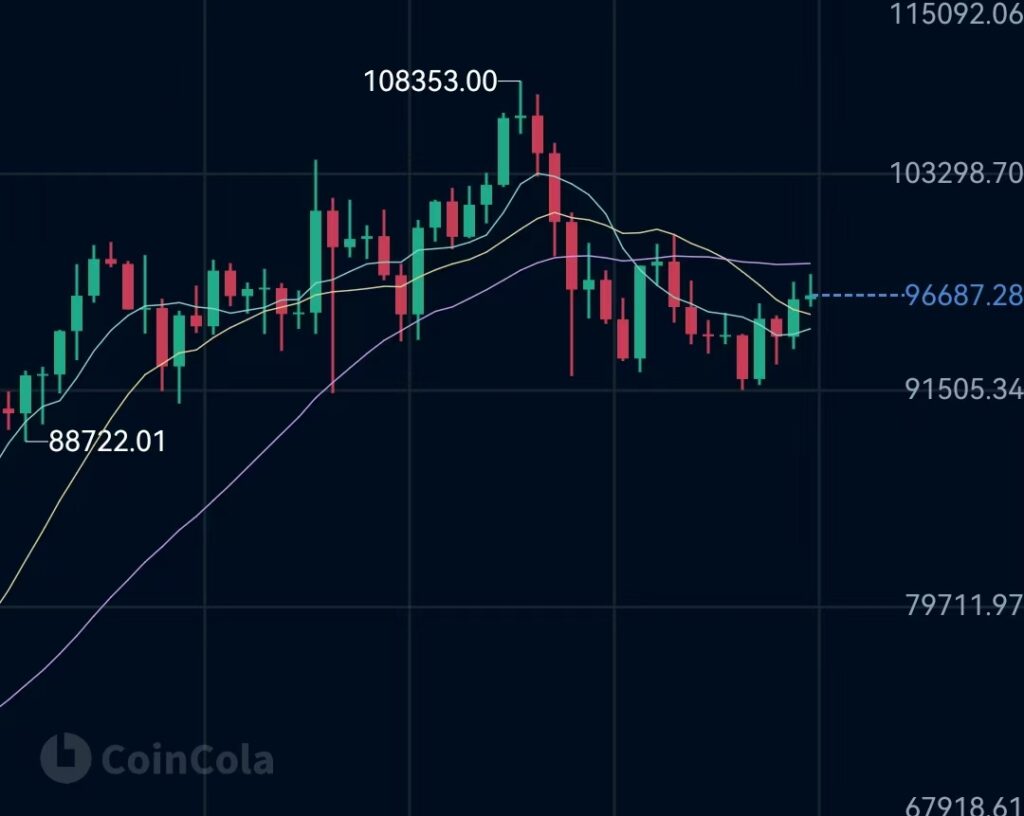
Understanding the Four-Year Cycle and the Halving Event
The most reliable historical indicator for Bitcoin’s price appreciation is the “Halving.” Built into Bitcoin’s underlying code is a mechanism that reduces the reward for mining new blocks by 50% every 210,000 blocks, or roughly every four years. This programmatic scarcity is the antithesis of modern fiat currency systems, where central banks can print money at will.
The Mechanics of Scarcity
The halving creates what economists call a “supply shock.” When the production of new Bitcoin is cut in half, while demand remains constant or increases, the laws of economics dictate that the price must rise. Historically, Bitcoin has operated in four-year cycles: a year of massive growth, followed by a correction (bear market), a period of accumulation, and finally, a recovery leading into the next halving.
Historical Performance Post-Halving
Data from previous cycles shows a consistent pattern. Following the 2012, 2016, and 2020 halvings, Bitcoin reached a new all-time high within 12 to 18 months. While past performance is never a guarantee of future results, the consistency of this cycle has made the halving the primary benchmark for investors timing their entry. The 2024 halving has further reduced the daily issuance of Bitcoin, creating a tightening supply environment that many analysts believe will lead to a significant supply crunch in the coming years.
Macroeconomic Factors Influencing Bitcoin’s Valuation
While the halving dictates the internal supply of Bitcoin, external macroeconomic factors dictate the demand and liquidity available in the global market. Bitcoin does not exist in a vacuum; it has become increasingly correlated with “risk-on” assets like technology stocks, meaning it thrives in environments of high liquidity and low interest rates.
Interest Rates and the Federal Reserve
The actions of the Federal Reserve (the Fed) are perhaps the most significant external driver of Bitcoin’s price. When the Fed lowers interest rates and engages in quantitative easing, the market is flooded with “cheap” money. Investors, seeking higher returns than those offered by traditional savings or bonds, move their capital into riskier assets like Bitcoin. Conversely, when the Fed raises rates to combat inflation, liquidity is sucked out of the market, often leading to a cooling-off period for digital assets. For Bitcoin to go up significantly, the market generally looks for a “pivot” in central bank policy toward a more accommodative stance.
Global Liquidity and Fiat Devaluation
Bitcoin is often referred to as “digital gold” because it serves as a hedge against the devaluation of traditional currencies. When major currencies like the Dollar, Euro, or Yen lose purchasing power due to high inflation or excessive government spending, Bitcoin’s fixed supply of 21 million coins becomes increasingly attractive. Monitoring the Global Liquidity Index (GLI) can provide clues; when global liquidity is on the rise, Bitcoin historically follows suit, often outperforming traditional assets due to its high beta and limited supply.
Technical Analysis and On-Chain Metrics to Watch
For those looking for more immediate signs of a price breakout, technical analysis (TA) and on-chain data offer granular insights into market sentiment and the behavior of large-scale holders.

Moving Averages and Support Levels
Traders often look at the 200-week Moving Average (MA) as a “floor” for Bitcoin’s price. Historically, Bitcoin has rarely stayed below this level for long, often marking the bottom of a bear market. When Bitcoin breaks above its 20-week and 50-week Exponential Moving Averages (EMAs), it typically signals the beginning of a sustained bullish trend. Additionally, the “Relative Strength Index” (RSI) can help identify if Bitcoin is oversold (a buying opportunity) or overbought (a potential peak).
Exchange Inflows vs. Outflows
On-chain metrics allow us to see what is happening “under the hood” of the blockchain. One of the most important metrics to watch is the movement of Bitcoin off exchanges. When large amounts of Bitcoin are moved from exchanges like Coinbase or Binance into private cold storage, it indicates that “whales” (large holders) are planning to hold for the long term, reducing the available supply for sale. A decrease in exchange reserves is often a precursor to a price rally, as it leaves less “sell-side” pressure to meet incoming buy orders.
The Puell Multiple and MVRV Z-Score
More advanced indicators like the Puell Multiple (which looks at mining profitability) and the MVRV Z-Score (which measures the ratio of market cap to realized cap) help identify when Bitcoin is fundamentally undervalued. Historically, when these metrics enter the “green zone,” it has been a signal that the market is at a cyclical bottom and a major move upward is on the horizon.
The Role of Institutional Adoption and Spot ETFs
The current market cycle is fundamentally different from those in the past due to the entry of institutional capital. For years, Bitcoin was driven by retail investors and “early adopters.” Today, it is a line item on the balance sheets of major corporations and a core component of institutional portfolios.
The Impact of Spot ETFs
The approval and launch of Spot Bitcoin ETFs (Exchange-Traded Funds) in the United States marked a watershed moment. These financial products allow pension funds, 401(k) managers, and traditional wealth advisors to purchase Bitcoin without the complexities of managing private keys or navigating crypto exchanges. The resulting “wall of money” creates a persistent bid in the market. When these ETFs see consistent daily net inflows, it creates a floor for the price and accelerates the upward trajectory during bullish periods.
Legal Clarity and Global Standards
As governments around the world develop clearer regulatory frameworks for digital assets (such as the MiCA regulations in Europe), the “risk premium” associated with legal uncertainty begins to fade. Institutional investors who were previously hesitant to enter a “gray market” now have the legal green light to allocate capital. Increased regulatory clarity typically leads to higher valuations, as it reduces the perceived risk of a “black swan” event like a total ban on the asset class.
Preparing Your Portfolio for the Next Bull Run
Understanding when Bitcoin is going up is only half the battle; the other half is positioning your personal finances to benefit from that movement while managing the inherent risks of a volatile market.
Risk Management and Dollar-Cost Averaging
Because the exact timing of a “moon mission” is impossible to predict, the most successful investors often utilize a Dollar-Cost Averaging (DCA) strategy. By investing a fixed amount of money at regular intervals, regardless of price, you mitigate the risk of buying the top and benefit from the market’s long-term upward trend. This disciplined approach removes the emotional stress of trying to “time the market” and ensures you are accumulating sats during periods of consolidation.
The Psychological Cycle of Investing
Investing in Bitcoin requires a high degree of emotional intelligence. Markets often move higher when the “Fear and Greed Index” is in extreme fear, and they often peak when the general public is in a state of euphoria. To profit, one must often act counter-cyclically: buying when the news cycle is negative and holding steady when the “FOMO” (Fear Of Missing Out) begins to drive prices to unsustainable levels.

Diversification Within the Digital Asset Class
While Bitcoin is the leader, a rising Bitcoin price often acts as a “rising tide that lifts all boats.” Many investors use Bitcoin as their core holding but allocate a small percentage of their portfolio to “Altcoins” or digital infrastructure projects that may offer higher volatility (and thus higher potential returns) during a bull market. However, for most personal finance strategies, Bitcoin remains the primary focus due to its proven resilience and institutional backing.
In summary, Bitcoin “goes up” when a combination of programmatic supply constraints (the halving), favorable macroeconomic conditions (liquidity and low rates), and institutional demand (ETFs and corporate adoption) converge. While the path is never a straight line, the structural trend for Bitcoin has consistently pointed toward higher valuations over multi-year horizons. By staying informed on these key indicators, investors can navigate the volatility and position themselves for the next phase of the digital gold rush.
aViewFromTheCave is a participant in the Amazon Services LLC Associates Program, an affiliate advertising program designed to provide a means for sites to earn advertising fees by advertising and linking to Amazon.com. Amazon, the Amazon logo, AmazonSupply, and the AmazonSupply logo are trademarks of Amazon.com, Inc. or its affiliates. As an Amazon Associate we earn affiliate commissions from qualifying purchases.