
The Dow Jones Industrial Average (DJIA) stands as the most recognizable symbol of the American stock market. For over a century, it has served as the primary shorthand for the health of the U.S. economy, appearing on the nightly news and the front pages of financial journals worldwide. However, to understand its significance in the modern financial landscape, one must look back to the late 19th century—a time of rapid industrialization, burgeoning corporate power, and a desperate need for transparency in the nascent world of stock trading.
The Dow Jones Industrial Average officially debuted on May 26, 1896. It was the brainchild of Charles Dow, a journalist and co-founder of Dow Jones & Company, and his business partner Edward Jones. While the index is now a sophisticated tool tracked by trillions of dollars in capital, its beginnings were humble, rooted in a desire to simplify the chaotic movements of the stock market for the average investor.
The Visionaries Behind the Index: Charles Dow and Edward Jones
Long before the DJIA became a household name, Charles Dow was a reporter with a keen interest in the mechanics of the market. In 1882, he founded Dow Jones & Company along with Edward Jones and Charles Bergstresser. Their first major publication was the “Customer’s Afternoon Letter,” a two-page summary of the day’s financial news that eventually evolved into The Wall Street Journal in 1889.
During this era, the stock market was often viewed as a “black box” by the general public. Stock prices moved erratically, influenced by rumors, manipulation, and a lack of centralized data. Charles Dow believed that the market was not just a collection of individual stocks, but a reflection of the broader business climate. He sought a way to quantify this “mood” of the economy.
His first attempt at an index occurred in 1884 with the creation of a transportation-heavy average. However, as the United States transitioned from an agrarian and railroad-focused economy to an industrial powerhouse, Dow realized that the railroads no longer told the full story. He needed a new metric that focused on the backbone of American industry: manufacturing, energy, and materials. This realization led to the birth of the Dow Jones Industrial Average in 1896.
The Original Twelve: A Snapshot of 1890s Industry
When the Dow Jones Industrial Average launched, it consisted of just 12 companies. These were the “blue chips” of their day, representing the sectors that were fueling the nation’s growth. On its first day of trading, the index closed at a level of 40.94.
The original twelve components included:
-
American Cotton Oil: Now part of Unilever.
-
American Sugar: Now Domino Foods.
-
American Tobacco: Broken up into several companies, including Reynolds American.
-
Chicago Gas: Now part of Integrys Energy Group.
-
Distilling & Cattle Feeding: Now Millennium Chemicals.
-
General Electric: The only original member to remain in the index for over a century (until its removal in 2018).
-
Laclede Gas: Now Spire Inc.
-
National Lead: Now NL Industries.
-
North American: An electric utility holding company.
-
Tennessee Coal & Iron: Later bought by U.S. Steel.
-
U.S. Leather pfd.: Dissolved in 1952.
-
U.S. Rubber: Now part of Michelin.
Looking at this list today highlights the dramatic shift in the global economy. In 1896, the world was built on sugar, cotton, tobacco, and coal. Today, the index is dominated by technology, healthcare, and financial services.
The Evolution of the Dow: From 12 to 30
As the American economy expanded, the Dow Jones Industrial Average had to adapt to remain relevant. The number of components in the index was increased to 20 in 1916, and eventually to 30 in 1928. It has remained at 30 companies ever since.
The selection of these 30 companies is not based on a rigid quantitative formula, unlike the S&P 500 or the Nasdaq-100. Instead, the components are selected by a committee at S&P Dow Jones Indices. The goal of the committee is to ensure the index provides a representative sample of the leading companies in the major sectors of the U.S. economy.
Why Only 30 Companies?
Critics often argue that 30 companies are too few to represent the vastness of the modern American economy. However, proponents of the Dow argue that the 30 companies selected are so influential that their performance correlates strongly with the broader market. These companies are leaders in their respective fields, and their fiscal health is often a leading indicator of consumer spending, corporate investment, and global trade.

The Shift Toward Technology and Services
In the latter half of the 20th century and the early 21st century, the composition of the Dow shifted away from “heavy” industry. Names like Sears, Roebuck & Co. and Union Carbide were eventually replaced by tech giants like Microsoft, Intel, and Apple. This evolution reflects the transition from a manufacturing-based economy to an information and service-based one. The inclusion of companies like Visa and UnitedHealth Group underscores how much the financial and healthcare sectors now drive national prosperity.
Understanding the “Price-Weighted” Methodology
One of the most unique—and controversial—aspects of the Dow Jones Industrial Average is its calculation method. Most modern indices, such as the S&P 500, are market-capitalization-weighted. This means that a company with a larger total market value has a greater impact on the index’s movement.
The Dow, however, is price-weighted. In a price-weighted index, the stock price of the individual components determines their influence. If a company with a stock price of $200 moves by 1%, it has a much larger impact on the index than a company with a stock price of $20 moving by 1%, regardless of the total size of the companies.
The Role of the Dow Divisor
In 1896, calculating the Dow was simple: you added up the prices of the 12 stocks and divided by 12. However, this simple arithmetic posed a problem when companies underwent stock splits or issued dividends. If a $100 stock split 2-for-1, its price would drop to $50. Without an adjustment, the index would appear to have crashed simply because of an administrative change.
To solve this, the “Dow Divisor” was introduced. The divisor is a mathematical constant used to maintain the continuity of the index. Whenever a component undergoes a split or a substitution occurs, the divisor is adjusted so that the index value remains the same. As of recent years, the divisor has actually dropped below 1 (specifically around 0.15), meaning that a $1 move in any Dow stock actually translates to a multi-point move in the index itself.
Historical Milestones and Market Barometer
Since its inception in 1896, the Dow Jones Industrial Average has been the primary witness to the highs and lows of American history. Its fluctuations tell the story of the Great Depression, the post-WWII boom, the stagflation of the 1970s, and the digital revolution.
The Great Depression and the 1929 Crash
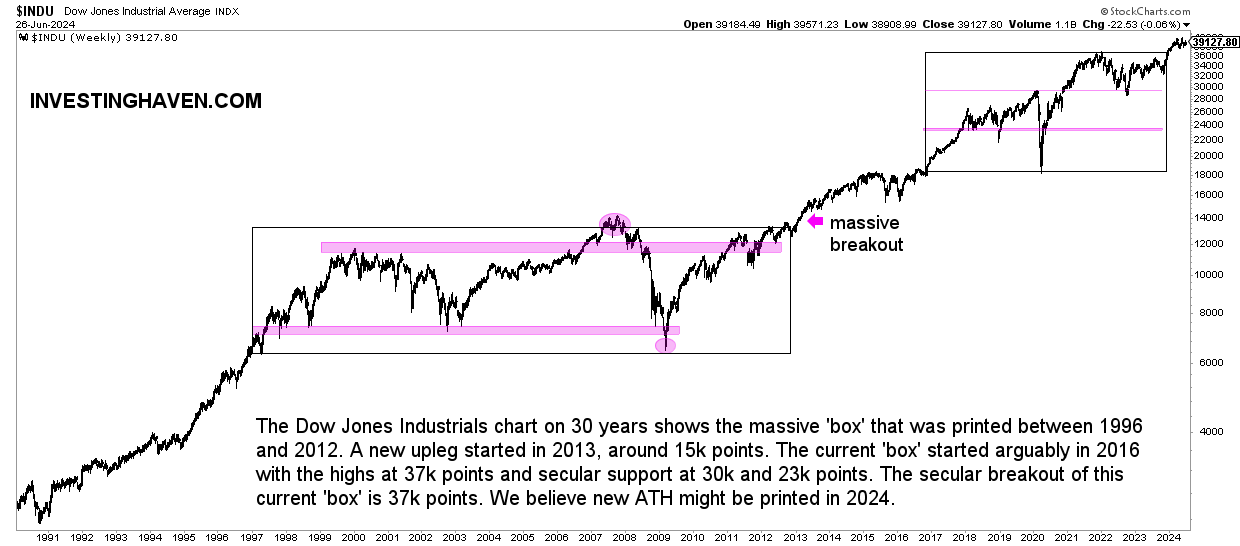
The most famous moment in the Dow’s history remains the “Black Tuesday” crash of 1929. After hitting a peak of 381 in September 1929, the index began a precipitous decline that saw it lose nearly 90% of its value, bottoming out at 41.22 in 1932. It took until 1954—twenty-five years later—for the Dow to return to its 1929 peak.
Modern Milestones
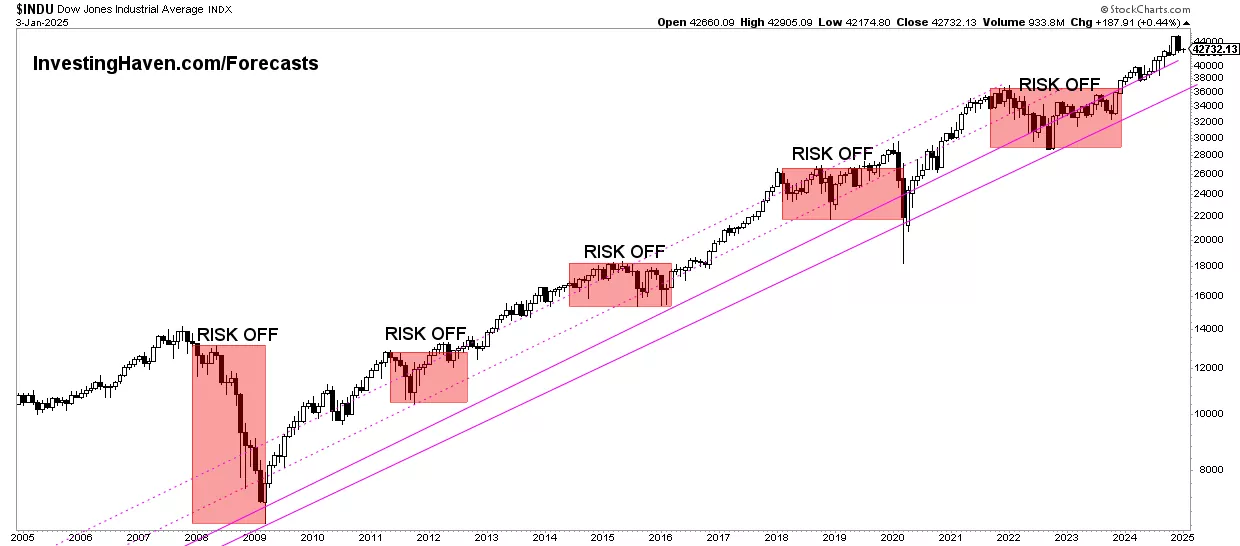
The Dow has crossed several psychological “thousand-point” barriers over the decades. It first hit 1,000 in 1972. By 1999, during the dot-com fever, it crossed 10,000. Despite the Great Recession of 2008, the index showed remarkable resilience, eventually climbing past 20,000 in 2017 and 30,000 in 2020. These milestones are often more symbolic than fundamental, but they serve as powerful indicators of long-term economic growth and the compounding power of the equity markets.
The Dow in Modern Investing
Despite being over 125 years old, the Dow Jones Industrial Average remains a vital tool for modern investors. While professional fund managers often prefer the S&P 500 for its broader diversification, the Dow remains the “people’s index.” It is easy to track, features companies that consumers interact with daily, and provides a clear snapshot of “Big Business” in America.
How to Invest in the Dow
In the early days, an investor would have had to manually buy shares in all 12 (or later 30) companies to track the index. Today, the process is instantaneous. The most common way to invest in the Dow is through Exchange-Traded Funds (ETFs). The SPDR Dow Jones Industrial Average ETF Trust (ticker: DIA), often referred to as “Diamonds,” is one of the most liquid and widely traded funds in the world. By purchasing a single share of DIA, an investor gains exposure to all 30 blue-chip companies in the index.
The Enduring Legacy of 1896
When Charles Dow first published his average in 1896, he could not have imagined a world of high-frequency trading, digital currencies, or globalized supply chains. Yet, his fundamental insight remains true: the collective movement of a nation’s leading enterprises provides a vital pulse check on the health of the economy.
The Dow Jones Industrial Average is more than just a number; it is a historical record of human ingenuity, industrial progress, and the relentless growth of the American financial system. Whether the market is in a “bull” or “bear” phase, the Dow continues to serve as the benchmark that connects our past with our financial future.
aViewFromTheCave is a participant in the Amazon Services LLC Associates Program, an affiliate advertising program designed to provide a means for sites to earn advertising fees by advertising and linking to Amazon.com. Amazon, the Amazon logo, AmazonSupply, and the AmazonSupply logo are trademarks of Amazon.com, Inc. or its affiliates. As an Amazon Associate we earn affiliate commissions from qualifying purchases.