
In the dynamic world of finance, few indicators command as much attention and historical significance as the Dow Jones Industrial Average (DJIA). When investors, analysts, and everyday individuals ask, “What’s the Dow Jones right now?”, they’re seeking more than just a number; they’re looking for a pulse on the American economy, a snapshot of corporate health, and a hint at the prevailing investor sentiment. While the precise, real-time figure fluctuates second by second during trading hours, understanding what that number represents and what drives its movements is far more crucial than any single tick. This article delves into the essence of the Dow, its current relevance, and how to interpret its daily dance in the broader financial landscape.

Understanding the Dow Jones Industrial Average (DJIA)
The Dow Jones Industrial Average is arguably the most recognized stock market index in the world, often serving as a shorthand for the overall performance of the U.S. stock market. However, its composition and calculation method make it unique and, at times, misunderstood.
A Historical Perspective: Birth and Evolution
Born out of the minds of Charles Dow and Edward Jones in 1896, the DJIA initially comprised just 12 industrial companies. Its creation was revolutionary, providing the first practical means for the public to gauge the health of the burgeoning American industrial sector. Over a century later, the index has expanded and evolved, reflecting the changing nature of the U.S. economy. From railroads and sugar producers to technology giants and healthcare conglomerates, the Dow’s components have transformed, yet its fundamental role as a bellwether has remained constant. Its longevity is a testament to its enduring utility, offering a continuous historical record that spans wars, recessions, and technological revolutions.
The “Blue-Chip” Benchmark: Who’s in the Dow?
Today, the DJIA is an index of 30 large, publicly traded companies based in the United States. These aren’t just any companies; they are typically “blue-chip” firms—well-established, financially sound, and influential industry leaders. The selection process is not based on rigid quantitative rules but rather on the judgment of the editors of The Wall Street Journal, who seek to maintain adequate representation of the broad market and ensure the index remains a relevant measure of the U.S. industrial economy. Consequently, while the word “Industrial” remains in its name, the index now includes companies from a diverse array of sectors, including technology (e.g., Apple, Microsoft), finance (e.g., JPMorgan Chase, Goldman Sachs), healthcare (e.g., Johnson & Johnson, UnitedHealth Group), and consumer goods (e.g., Procter & Gamble, Walmart). This deliberate curation ensures the Dow reflects a wide swath of economic activity, making its daily movements indicative of trends across various crucial sectors.
Price-Weighted vs. Market-Cap Weighted: How it’s Calculated
A critical distinction of the DJIA is its calculation method: it is a price-weighted index. This means that companies with higher stock prices have a greater impact on the index’s movement than companies with lower stock prices, regardless of their total market capitalization (the total value of all outstanding shares). For instance, if a stock trading at $300 moves up by 1%, it will have a larger effect on the Dow’s overall value than a stock trading at $50 that moves up by 1%, even if the $50 stock represents a much larger company by market value. This contrasts sharply with more common market-capitalization-weighted indexes like the S&P 500, where larger companies (by market cap) exert a proportionally greater influence. The price-weighted nature of the Dow is a historical artifact, but it’s essential for understanding why certain individual stock movements might disproportionately sway the entire index. To calculate the Dow, the sum of the prices of its 30 component stocks is divided by a special divisor, known as the “Dow Divisor,” which is adjusted for stock splits, spin-offs, and other structural changes to maintain historical continuity.
Deciphering Today’s Dow Performance
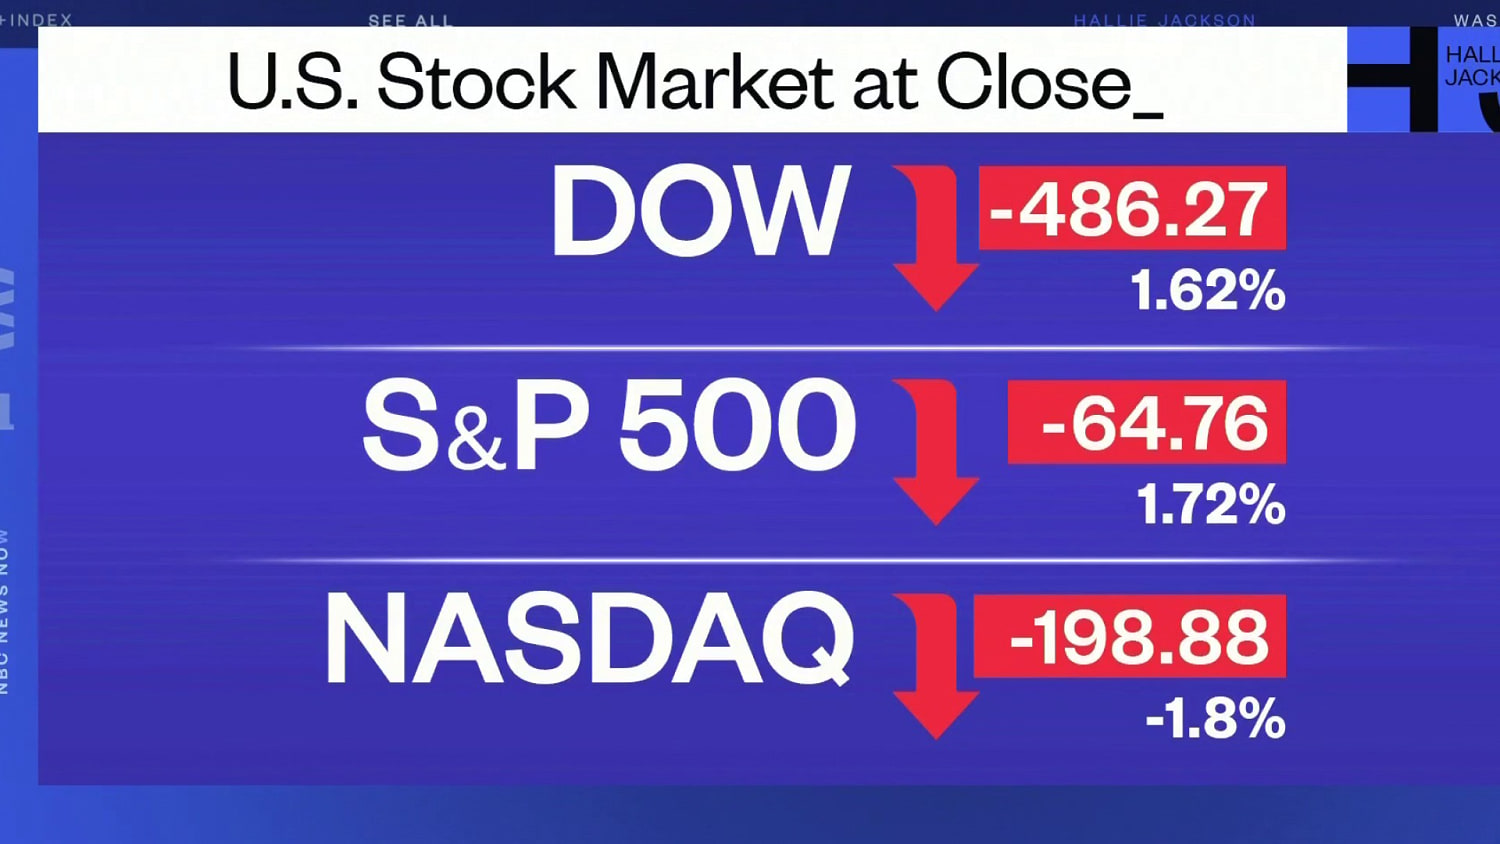
When the news reports the Dow’s performance, they typically refer to its daily change—how many points it has gained or lost since the previous closing bell. But what truly drives these daily fluctuations, and what does a change of a few hundred points really signify?
Key Factors Influencing Daily Fluctuations
The Dow’s daily movements are a complex interplay of numerous factors, both micro and macro, domestic and international. At a fundamental level, the performance of the 30 underlying companies is paramount. Positive earnings reports, new product launches, strategic acquisitions, or increased dividends from these component companies can individually or collectively push the index higher. Conversely, disappointing financial results, regulatory scrutiny, competitive pressures, or internal company challenges can drag it down.
Beyond individual corporate performance, broader economic data plays a significant role. Inflation reports, interest rate decisions by the Federal Reserve, employment figures (like the monthly jobs report), consumer confidence surveys, and GDP growth statistics can all trigger significant shifts in investor sentiment and, consequently, in the Dow. Geopolitical events, such as trade disputes, international conflicts, or shifts in global economic policy, can introduce uncertainty and volatility. Furthermore, market sentiment itself, often driven by fear or greed, herd mentality, or algorithmic trading, can create momentum that amplifies moves in either direction, sometimes seemingly detached from immediate news.
Interpreting Upward and Downward Trends
An upward trend in the Dow, often referred to as a “bull market,” typically signals investor optimism about future economic growth and corporate profitability. It suggests that, on balance, the market participants believe conditions are improving, leading them to buy stocks, which drives prices higher. A sustained period of rising Dow values can reflect strong economic fundamentals, robust corporate earnings, and a generally favorable outlook.
Conversely, a downward trend, or “bear market,” indicates pessimism. Investors might be concerned about slowing economic growth, rising inflation, geopolitical instability, or declining corporate profits. This leads to selling pressure as investors seek to reduce their exposure to perceived risks, pushing stock prices and the index lower. It’s important to differentiate between temporary pullbacks or corrections (which are normal market behaviors) and a sustained bear market, which indicates a more profound shift in investor confidence.
Beyond the Number: What Does a Movement Really Mean?
While a movement of, say, 300 points in the Dow might sound significant, its meaning is relative to the index’s current level. When the Dow was at 10,000 points, a 300-point move represented a 3% change. At 30,000 points, the same 300-point move is only a 1% change. Therefore, it’s more insightful to look at the percentage change rather than just the absolute point change. A 1% movement, whether up or down, generally indicates a notable shift in market sentiment or response to significant news.
More broadly, interpreting the Dow’s movement requires considering the context. Is the move isolated, or is it part of a broader trend across other major indexes like the S&P 500 or Nasdaq? Is it reacting to a specific piece of news, or is it part of a general repositioning by investors? Understanding the “why” behind the movement offers far greater insight than simply knowing the “what.” A deep dive into the underlying economic narratives, company fundamentals, and prevailing market psychology is essential for truly understanding what the Dow’s current position signifies.
The Dow as an Economic Barometer
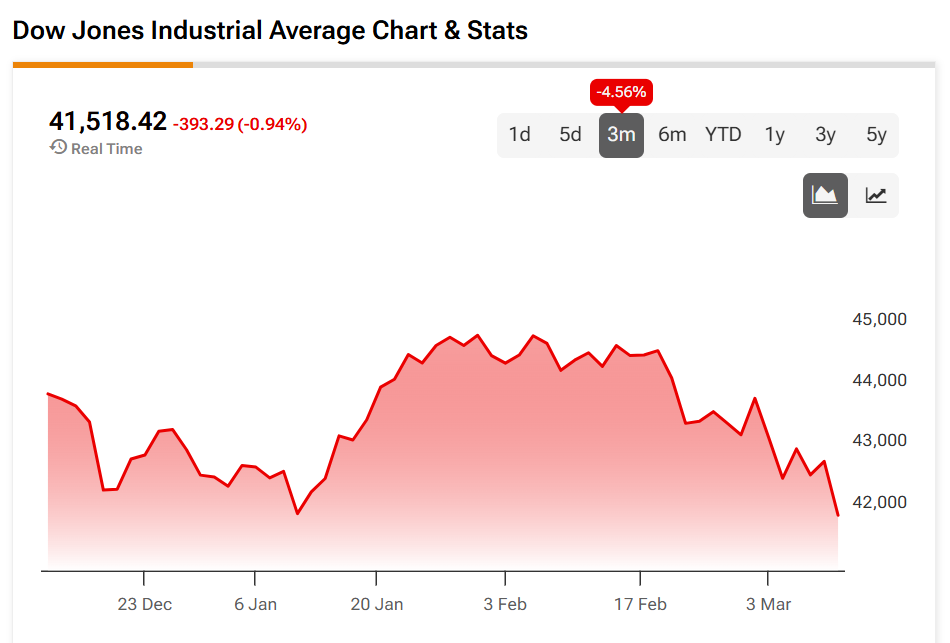
Often referred to as a “barometer” for the U.S. economy, the Dow’s movements are closely watched for insights into the broader financial health of the nation. While it offers valuable signals, it’s also crucial to understand its limitations.
Reflecting Corporate Health and Investor Sentiment
Since the Dow is composed of 30 of America’s largest and most influential companies, their collective performance often mirrors the health of the corporate sector. Strong earnings, robust sales, and positive outlooks from these giants can indicate a thriving business environment. Conversely, widespread struggles among Dow components can signal headwinds for the broader economy. Moreover, the index inherently captures investor sentiment. When investors are confident about the future, they buy, driving the Dow up. When they’re fearful or uncertain, they sell, pulling the Dow down. Thus, the Dow provides a real-time, aggregated measure of how the collective market feels about the present and future economic landscape.
Correlation with Broader Economic Indicators
The Dow’s performance often correlates with other key economic indicators. For example, a rising Dow might coincide with declining unemployment rates, increased consumer spending, and healthy GDP growth, as robust economic activity translates into higher corporate profits. Conversely, periods of economic contraction or recession are typically accompanied by a declining Dow. However, the stock market, including the Dow, is often considered a leading indicator, meaning it tends to anticipate future economic conditions rather than merely reflecting current ones. Investors are constantly looking forward, pricing in their expectations for earnings and economic growth six to nine months down the line. This is why the market might begin to recover while the economy is still officially in a recession, or start to decline before an official downturn is announced.
Limitations of the Dow as a Sole Indicator
Despite its prominence, relying solely on the Dow as the definitive measure of the economy or the entire stock market has its limitations.
Firstly, it only includes 30 companies, which, while influential, represent a small fraction of the thousands of publicly traded companies in the U.S. It primarily reflects the performance of large-cap, established businesses and may not accurately capture the health of smaller companies, emerging industries, or sectors not well-represented in the index.
Secondly, its price-weighted methodology means that a significant movement in a single high-priced stock can disproportionately affect the entire index, potentially distorting the overall picture. For instance, if a Dow component with a high stock price experiences a major event, its impact on the index could overshadow the aggregate performance of the other 29 companies.
For a more comprehensive view, financial professionals typically look at a broader range of indexes, such as the S&P 500 (which tracks 500 large U.S. companies and is market-capitalization-weighted) and the Nasdaq Composite (which has a strong technology focus), alongside the Dow. These, combined with various economic data points, offer a more nuanced and accurate assessment of market and economic health.
Investing and the Dow: Practical Implications
For both seasoned investors and those just starting, understanding the Dow’s role is crucial, though its utility varies depending on investment strategy and time horizon.
For Long-Term Investors: A Big Picture View
Long-term investors, often referred to as buy-and-hold investors, typically view the Dow’s daily fluctuations with less concern. For them, the Dow serves as a general indicator of the long-term trend of the U.S. equity market. Over decades, the Dow has shown a remarkable ability to recover from downturns and reach new highs, reflecting the underlying growth and resilience of the American economy and its leading companies. Long-term investors are more interested in the Dow’s multi-year trajectory, using it to confirm their belief in the sustained growth of the market rather than making decisions based on daily point changes. They understand that market corrections and bear markets are a natural part of the investing cycle and often represent opportunities to accumulate assets at lower prices. Their focus is on the fundamental health of their portfolio companies and the overall economy, using the Dow as a supporting piece of their big-picture analysis.
For Short-Term Traders: Volatility and Opportunity
For short-term traders and day traders, the Dow’s immediate movements are of paramount importance. These individuals seek to profit from the index’s volatility, buying when they anticipate a rise and selling when they expect a fall, often within the same trading day or over a few days. They might use leveraged products like futures contracts or exchange-traded funds (ETFs) that track the Dow to amplify their gains (or losses). For traders, “what’s the Dow Jones right now?” is a constant query, as real-time data and swift interpretation of news events are critical to their strategy. They often employ technical analysis, studying chart patterns, trading volumes, and various indicators to predict short-term price movements. However, this approach carries significantly higher risk due to the inherent unpredictability of short-term market fluctuations and the potential for rapid capital loss.
Diversification Beyond the Dow
Regardless of one’s investment horizon, relying solely on the Dow for investment decisions is generally not advisable. A cornerstone of sound investing is diversification. While investing in an index fund or ETF that tracks the Dow offers some diversification across 30 large companies, it still leaves an investor exposed to the unique risks of large-cap U.S. equities.
True diversification involves spreading investments across different asset classes (stocks, bonds, real estate, commodities), different geographies (U.S., international developed, emerging markets), and different market capitalizations (large-cap, mid-cap, small-cap stocks). It also means not putting all eggs into a single sector basket. By diversifying, investors can mitigate the impact of poor performance in any single company, sector, or even a single index like the Dow, ultimately aiming for a more stable and resilient portfolio over the long term. The Dow is a piece of the puzzle, not the entire picture.
Navigating Market Information and Future Outlook
In an age of instant information, knowing where to find reliable data and how to interpret it is crucial for anyone monitoring the Dow or the broader markets.
Reliable Sources for Real-Time Data
For real-time updates on the Dow Jones Industrial Average, reputable financial news outlets and platforms are the go-to sources. Websites like The Wall Street Journal, Bloomberg, Reuters, Yahoo Finance, Google Finance, and CNBC provide live streaming data, charts, news headlines, and analytical tools. Many brokerage platforms also offer real-time quotes and advanced charting capabilities to their clients. It’s important to choose sources known for their accuracy and timely updates, as even a slight delay in data can be significant for market participants. Furthermore, official exchange websites, while sometimes less user-friendly for continuous tracking, offer the most authoritative data.
Expert Analysis and Your Own Due Diligence
While real-time numbers tell you “what” the Dow is doing, expert analysis helps explain “why.” Financial commentators, market strategists, and economists often provide insights into the forces driving market movements, offering context for daily fluctuations and long-term trends. Their perspectives can be invaluable for understanding the broader narrative. However, it’s equally important to engage in your own due diligence. This means not blindly accepting every forecast or piece of advice. Instead, compare different expert opinions, consider the potential biases, and cross-reference information. For individual investors, understanding their own financial goals, risk tolerance, and time horizon is paramount, as this should always guide investment decisions, even when faced with compelling market analyses.
The Enduring Relevance of the Dow in a Dynamic Market
Despite the proliferation of more sophisticated and broader market indexes, the Dow Jones Industrial Average retains its unique and enduring relevance. It remains a widely cited and understood benchmark, a common language for discussing the stock market and the economy. Its historical depth provides an unparalleled timeline of American enterprise and financial cycles. While it may not be the most precise or comprehensive measure, its simplicity and iconic status ensure it will continue to be the first number many people check when they want to gauge the health of the financial world. As markets continue to evolve with new technologies, geopolitical shifts, and changing economic paradigms, the Dow’s ability to adapt its components while maintaining its core identity ensures its place as a cornerstone of financial reporting and analysis for the foreseeable future. Understanding “what’s the Dow Jones right now” is not just about a numerical value; it’s about connecting with a century-plus legacy of market history and gaining insight into the present economic moment.
aViewFromTheCave is a participant in the Amazon Services LLC Associates Program, an affiliate advertising program designed to provide a means for sites to earn advertising fees by advertising and linking to Amazon.com. Amazon, the Amazon logo, AmazonSupply, and the AmazonSupply logo are trademarks of Amazon.com, Inc. or its affiliates. As an Amazon Associate we earn affiliate commissions from qualifying purchases.