
The question of a solar cataclysm has long been the domain of science fiction, but for the modern technology sector, it represents the ultimate stress test for computational modeling, data visualization, and predictive analytics. To understand what it would look like if the sun exploded, we must move beyond the naked eye and look through the lens of high-performance computing (HPC), advanced sensors, and the sophisticated software architectures that allow us to simulate the unimaginable.
In the realm of technology, “seeing” an event of this magnitude is not about a literal observation—which would be physically impossible for a terrestrial observer—but about the digital reconstruction of physics at an extreme scale. Through the integration of AI-driven simulations and next-generation rendering engines, we can now visualize the end of our star with a degree of precision that was once impossible.
The Computational Power Behind Stellar Simulation
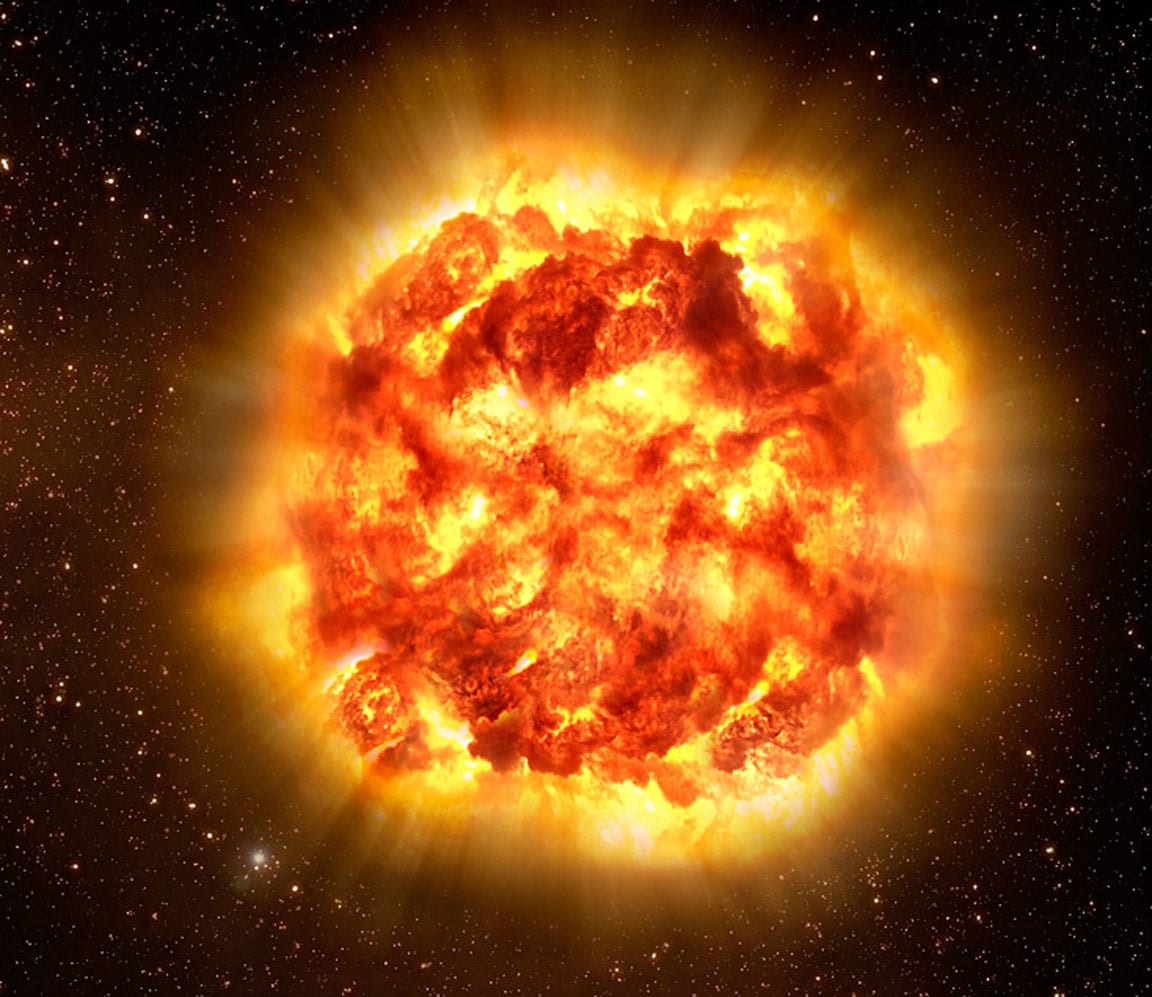
Visualizing a solar explosion requires more than just artistic imagination; it requires the processing of quadrillions of data points. The sun is a complex fluid dynamic system governed by magnetohydrodynamics (MHD). To simulate its destruction, researchers utilize supercomputers capable of executing exascale transitions.
High-Performance Computing (HPC) and Fluid Dynamics
The primary challenge in visualizing a solar explosion lies in the “N-body simulation” problem and fluid dynamics. Software frameworks such as FLASH or ENZO are used to model the behavior of plasma under extreme pressure. These programs break the sun down into a three-dimensional grid, calculating the temperature, density, and velocity of every “cell” in that grid.
When we ask what it would look like, tech provides the answer through “voxels”—three-dimensional pixels. A solar explosion would involve the rapid expansion of these voxels. On a hardware level, this requires massive GPU acceleration. Modern NVIDIA H100 clusters, for instance, are designed to handle the parallel processing required to simulate the turbulent convection zones of a star. Without this level of hardware, the “visual” would be nothing more than a blurry approximation. Instead, we get a granular look at the shockwaves as they rip through the solar atmosphere at supersonic speeds.
AI and Neural Radiance Fields (NeRFs)
Recently, Artificial Intelligence has revolutionized how we visualize cosmic events. By using Neural Radiance Fields (NeRFs), tech developers can take sparse data from solar observatories and “fill in the gaps” to create a 360-degree, photorealistic 3D model of a solar event. If the sun were to undergo a catastrophic failure, AI would be the tool used to synthesize the light-speed data into a coherent visual narrative. Machine learning models can predict the trajectory of Coronal Mass Ejections (CMEs) with high fidelity, allowing us to render the “look” of the explosion’s leading edge as it interacts with the Earth’s magnetosphere.
Visualizing Catastrophe: VR and Immersive Rendering
If we are to answer “what it would look like” from a human perspective, we turn to the world of immersive tech. Real-time rendering engines, such as Unreal Engine 5, have bridged the gap between scientific data and cinematic experience.
Rendering the Unseeable: Volumetric Lights and Ray Tracing
One of the most significant technological hurdles in depicting a solar explosion is the behavior of light. In a vacuum, light doesn’t “glow” unless it has something to reflect off of. However, the sheer volume of matter ejected during a solar explosion would create a dense environment of ionized gas.
Using hardware-accelerated ray tracing, developers can simulate how the light from the dying core would scatter through the expanding nebula. In a professional visualization, this would look like a blinding white flash, followed by an intricate web of “light pillars” and volumetric shadows as the outer layers of the sun are cast off. The use of Lumen and Nanite technologies allows for the rendering of trillions of individual particles of stellar dust, providing a level of detail that shows the gritty, chaotic reality of a star’s death rather than a smooth, clean explosion.
Virtual Reality: The Front Row Seat
For educational and research purposes, VR headsets like the Apple Vision Pro or the Meta Quest 3 provide the platform to experience these simulations. In a VR environment, “what it would look like” is a 1:1 scale immersion. Users can see the scale of the sun—a million times the volume of Earth—collapsing or expanding.
The tech stack here involves low-latency data streaming from cloud-based servers to the headset. Because the math involved in a solar explosion is too heavy for a mobile processor, the visualization is rendered on a remote server and “beamed” to the user. This allows for a smooth, high-frame-rate experience of the sun’s final moments, highlighting the interplay between gravity and thermal pressure.
The Hardware of Observation: Next-Gen Solar Telescopes
To understand what a solar explosion would look like, we must also consider the hardware currently pointed at the sun. Our “eyes” are sophisticated sensors that see in spectrums far beyond human capability.
Sensors and Satellite Infrastructure
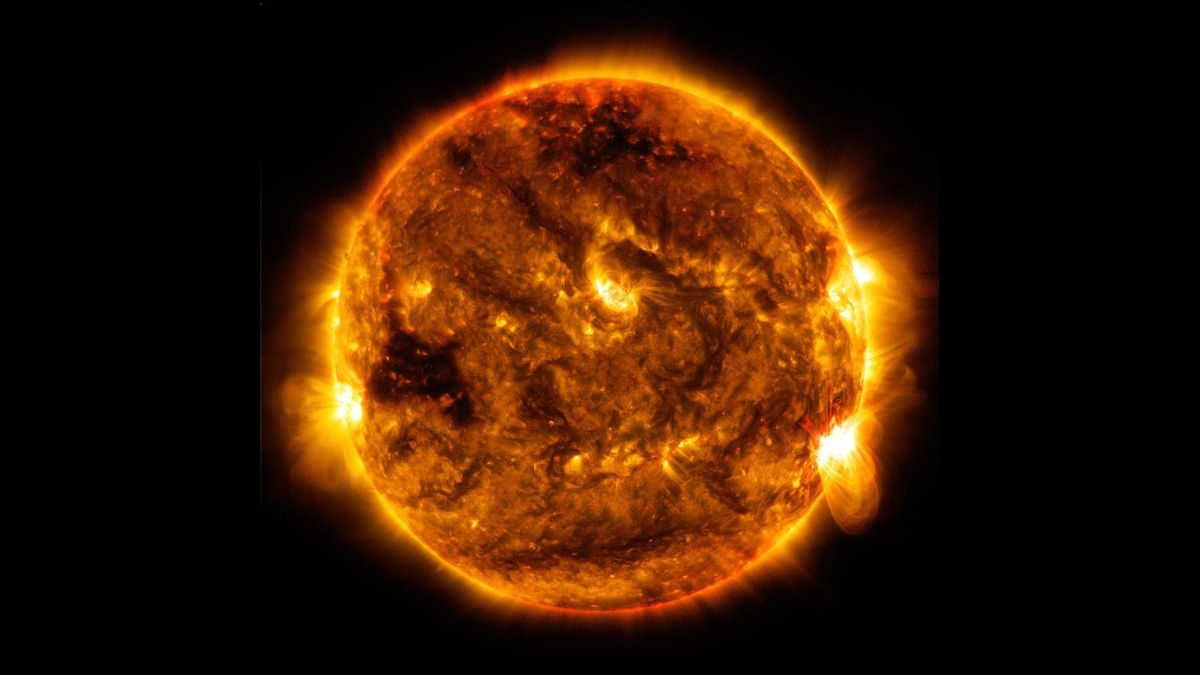
The Parker Solar Probe and the Solar Dynamics Observatory (SDO) are the most advanced “cameras” we have. These devices do not use traditional film or standard digital sensors found in smartphones. Instead, they use specialized CCD (Charge-Coupled Device) and CMOS sensors designed to survive extreme radiation.
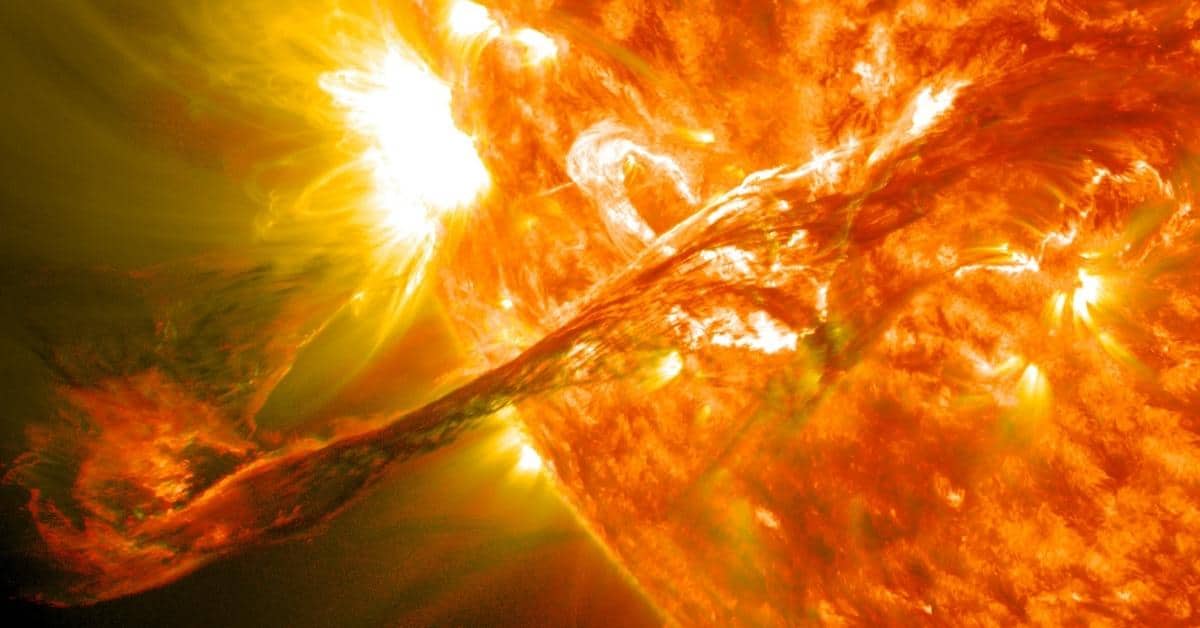
If the sun were to explode, these sensors would be our first and last witnesses. The visual data would be captured in extreme ultraviolet and X-ray wavelengths. Tech professionals analyze this data to see the “invisible” structures of the sun—the magnetic loops and filaments. An explosion, through the lens of this tech, would look like a violent reconfiguration of magnetic lines, appearing as glowing threads snapping and releasing unimaginable amounts of energy.
Edge Computing in Deep Space
The limitation of space-based observation is bandwidth. Sending high-resolution video from a satellite near the sun back to Earth takes time. This is where “Edge Computing” comes into play. Modern solar-observing satellites use onboard AI to filter data, deciding which frames are the most “important” to send back. In the event of a solar anomaly, the software is programmed to prioritize high-cadence imaging of the event, ensuring that even if the satellite is destroyed, the most critical visual data is transmitted first.
Digital Resilience and the Preservation of Human Knowledge
The question “what would it look like” also forces us to consider the technological infrastructure of Earth. A solar explosion would create an unprecedented Electromagnetic Pulse (EMP).
The Threat to Digital Security and Infrastructure
Technically, the “look” of a solar explosion from Earth would be preceded by a massive surge in the global electrical grid. Digital security protocols would be triggered as ionospheric disturbances disrupt satellite communications and GPS. Our screens might flicker with static, not from the light of the explosion, but from the high-energy particles stripping the bits of data as they travel through silicon chips.
From a software engineering perspective, this represents the ultimate “Edge Case.” Developers are currently working on “hardened” systems and decentralized networks that could theoretically survive intense solar activity. The visual reality of the event would be mirrored by the “darkening” of our digital world as systems go offline to protect themselves from the surge.
Long-Term Data Storage and the “Solar Record”
How would future civilizations—or those on other planets—know what it looked like? Technology is moving toward ultra-long-term storage solutions. Glass-based storage (Project Silica by Microsoft) and DNA storage are being developed to hold petabytes of data for thousands of years.
If we were to capture the visual data of a solar explosion, these are the technologies that would store it. The “look” of the explosion would be encoded into a 5D data format inside a quartz glass slab, resilient to the heat and radiation that would destroy traditional magnetic or flash storage. This is the intersection of tech and legacy: the ability to record the end of our world using the most advanced materials science we have.
The Role of Tech in Predicting the Unpredictable
While the sun is not expected to explode for another five billion years, the technology we build today is designed to monitor “Sun-like” stars and smaller solar events that mimic the physics of a total explosion.
Through the use of automated sky surveys and AI-driven telescopes, we observe supernovae in distant galaxies. These digital observations provide the “source material” for our simulations of our own sun. We use deep learning algorithms to analyze the light curves of dying stars, allowing us to map out the visual stages of a solar death: the expansion into a Red Giant, the shedding of the outer envelope, and the final transition into a White Dwarf.
Technologically, the explosion of the sun is a data event. It is a transition from matter to information. As we continue to refine our software, hardware, and networking capabilities, our ability to visualize this event becomes more than just a curiosity; it becomes a testament to the power of human innovation. We use tech to look into the heart of the fire, turning raw physics into a visual narrative that we can study, learn from, and ultimately, use to understand our place in the digital and physical cosmos.
aViewFromTheCave is a participant in the Amazon Services LLC Associates Program, an affiliate advertising program designed to provide a means for sites to earn advertising fees by advertising and linking to Amazon.com. Amazon, the Amazon logo, AmazonSupply, and the AmazonSupply logo are trademarks of Amazon.com, Inc. or its affiliates. As an Amazon Associate we earn affiliate commissions from qualifying purchases.