
In the world of finance, numbers are the language of business, but raw data rarely tells the whole story. A company might report $10 million in revenue, which sounds impressive in isolation. However, if that same company spent $11 million to generate that revenue, the narrative shifts from success to struggle. This is where the concept of a “ratio” becomes indispensable.
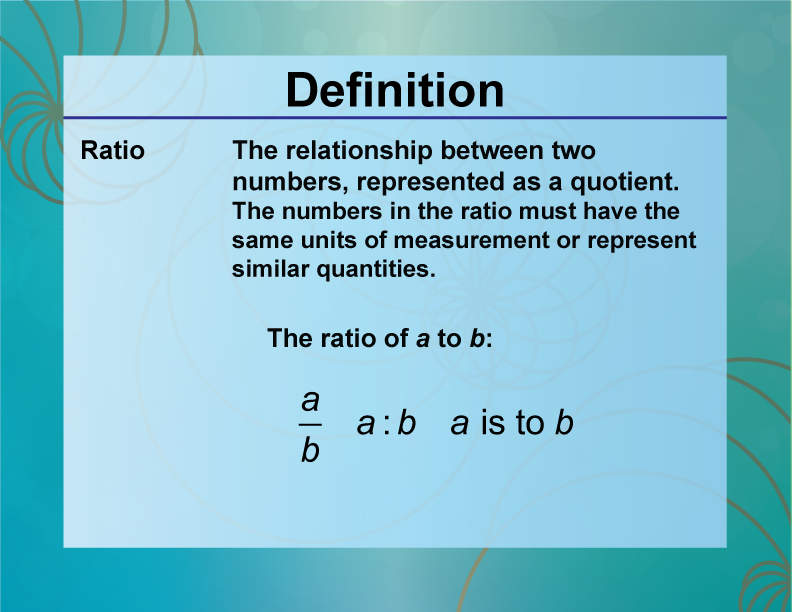
In a financial context, a ratio is a mathematical relationship between two or more figures found in a company’s financial statements—the balance sheet, income statement, and cash flow statement. Understanding what ratio means is the difference between simply reading a ledger and actually diagnosing the health of an enterprise. It is a tool for comparison, allowing investors, creditors, and business owners to evaluate performance against historical data, industry benchmarks, or direct competitors.
The Fundamentals of Financial Ratios: Why Proportions Matter
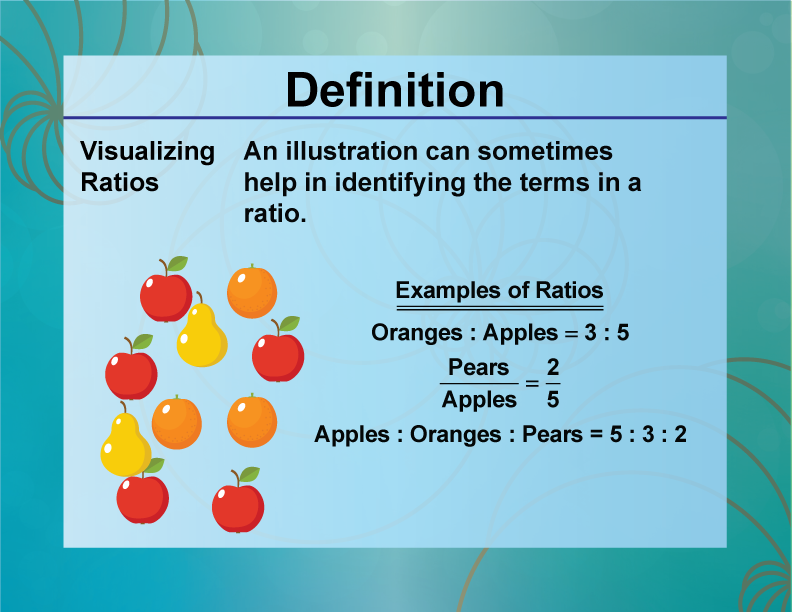
At its core, a ratio is a tool of normalization. It levels the playing field, allowing a small startup to be compared to a multinational corporation. By converting absolute dollar amounts into percentages or proportions, we gain a clearer view of operational efficiency and fiscal responsibility.
Decoding the Language of Numbers
Financial ratios act as a diagnostic lens. For a business owner, they reveal where capital is being trapped or where margins are thinning. For an investor, they serve as a “BS detector,” highlighting whether a company’s growth is sustainable or merely a facade built on mounting debt. A ratio takes two disparate data points—such as net income and total equity—and creates a new metric that represents a specific dimension of business health, such as “Return on Equity.” Without these relationships, financial data remains a static list of figures rather than a dynamic roadmap.
The Importance of Benchmarking
A ratio is only as good as the context in which it is placed. If a company has a profit margin of 10%, is that good? If the industry average is 5%, the company is a market leader. If the industry average is 25%, the company is severely underperforming. Understanding what ratio means involves “benchmarking”—the process of comparing a firm’s ratios to its past performance (trend analysis) or to the averages of its peer group (industry analysis). This context transforms a simple fraction into a strategic insight.
Liquidity and Solvency Ratios: Measuring Business Health
One of the most critical applications of ratios is determining whether a business can stay afloat. Financial health is often categorized into two timeframes: the immediate (liquidity) and the long-term (solvency).
Current Ratio and Quick Ratio
Liquidity ratios measure a company’s ability to meet its short-term obligations—typically those due within one year. The “Current Ratio” is the most common metric here, calculated by dividing current assets by current liabilities. A ratio of 2:1 is often cited as healthy, suggesting the company has twice as many assets as it does debts.
However, not all assets are easily converted to cash. This is where the “Quick Ratio” (or Acid-Test Ratio) comes in. It excludes inventory from the calculation, focusing only on the most liquid assets like cash and accounts receivable. If a company has a high current ratio but a low quick ratio, it means their capital is tied up in unsold goods—a potential red flag for retailers or manufacturers during a market downturn.
Debt-to-Equity: Assessing Long-Term Stability
While liquidity looks at the next twelve months, solvency looks at the next decade. The “Debt-to-Equity (D/E) Ratio” is the primary indicator of a company’s financial leverage. It compares total liabilities to shareholder equity. A high D/E ratio indicates that a company has been aggressive in financing its growth with debt, which can result in volatile earnings due to interest expenses. In the “Money” niche, understanding this ratio is vital for risk assessment; highly leveraged companies are often the first to fail during a credit crunch, while low-leverage companies have the “dry powder” to survive and even acquire competitors during a recession.
Profitability and Efficiency Ratios: Evaluating Performance
Making money is the primary goal of any commercial venture, but “profit” is a nuanced term. Profitability ratios help stakeholders understand how effectively a company is turning a dollar of revenue into a dollar of take-home pay.
Gross and Net Profit Margins
The “Gross Profit Margin” looks at the relationship between revenue and the direct costs of goods sold (COGS). It reveals the core efficiency of the production process. If a software company has a 90% gross margin, it suggests that adding a new customer costs very little.
The “Net Profit Margin” is the ultimate bottom line. It accounts for all expenses, including taxes, interest, and administrative costs. By monitoring the gap between gross and net margins, management can identify “expense creep”—where overhead costs begin to eat away at the profits generated by sales.
Return on Investment (ROI) and Return on Equity (ROE)
For investors, these are perhaps the most significant ratios. “Return on Equity” measures how effectively a company uses the money shareholders have invested. It is calculated by dividing net income by shareholders’ equity. A consistently rising ROE suggests a management team that is adept at reinvesting profits to generate further growth. In the world of personal finance and stock picking, ROE is a hallmark of “quality” companies that possess a competitive advantage or “moat.”
Asset Turnover and Operational Efficiency
Efficiency ratios, such as “Asset Turnover,” measure how well a company uses its assets to generate sales. If two companies both have $1 million in assets, but Company A generates $2 million in sales while Company B generates $500,000, Company A is far more efficient. This ratio is particularly important in capital-intensive industries like shipping or telecommunications, where the cost of maintaining equipment is high.
Valuation Ratios: The Investor’s Perspective
When it comes to the stock market and private equity, the question isn’t just “Is this a good company?” but “Is this a good price?” Valuation ratios provide the answer by comparing the price of an investment to the underlying value of the business.
The Price-to-Earnings (P/E) Ratio
The P/E ratio is the most widely cited metric in the financial world. It relates a company’s share price to its earnings per share (EPS). Essentially, the P/E ratio tells you how much investors are willing to pay for every $1 of profit the company generates. A high P/E might suggest that a company is overvalued, or it might indicate that investors expect massive growth in the future. Conversely, a low P/E could signal a “value” opportunity or a company in terminal decline. Understanding the nuance of the P/E ratio is fundamental to building a successful investment portfolio.
Price-to-Book (P/B) and Dividend Yield
The P/B ratio compares the market’s valuation of a company to its “book value” (the net value of its assets). This is a staple for value investors like Warren Buffett, who look for companies trading for less than their assets are worth.
For those focused on passive income, the “Dividend Yield” ratio is the priority. It shows how much a company pays out in dividends each year relative to its stock price. A 5% yield means that for every $100 invested, the shareholder receives $5 in annual cash flow. However, a yield that is too high (e.g., 15%) can be a “dividend trap,” suggesting the market expects the company to cut its payout soon.
Integrating Ratios into Strategic Decision-Making
Ratios are not just for analysts in high-rise offices; they are practical tools for everyday financial management and strategic planning. Whether you are managing a personal portfolio or running a corporation, ratios provide the objective truth behind the narrative.
Limitations of Ratio Analysis
While powerful, ratios are not infallible. They are based on historical data, and as the disclaimer goes, “past performance is no guarantee of future results.” Furthermore, accounting practices can vary; one company might use aggressive depreciation schedules to inflate its earnings ratio, while another remains conservative. Ratios also fail to capture qualitative factors—such as the quality of a CEO, the strength of a brand’s reputation, or a sudden technological shift that renders a company’s assets obsolete.
Building a Holistic Financial Picture
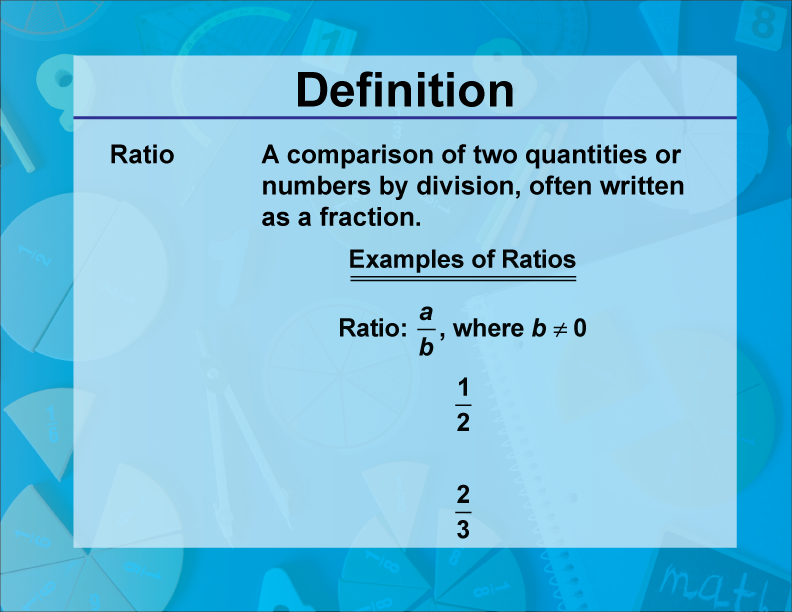
To truly understand what ratio means, one must use them in combination. No single ratio provides a complete picture. A company might have a fantastic P/E ratio but a terrible Debt-to-Equity ratio, meaning its “cheap” price comes with significant risk.
The most successful financial minds use a “balanced scorecard” approach. They look at liquidity to ensure survival, profitability to ensure growth, and valuation to ensure they aren’t overpaying. By synthesizing these different ratios, you move beyond the “what” of the numbers and begin to understand the “why” of the business. In the complex landscape of money and finance, ratios are the compass that ensures you stay on the path toward long-term wealth and stability.
aViewFromTheCave is a participant in the Amazon Services LLC Associates Program, an affiliate advertising program designed to provide a means for sites to earn advertising fees by advertising and linking to Amazon.com. Amazon, the Amazon logo, AmazonSupply, and the AmazonSupply logo are trademarks of Amazon.com, Inc. or its affiliates. As an Amazon Associate we earn affiliate commissions from qualifying purchases.