
The question of “what price oil today” is rarely answered with a simple numerical value found on a ticker symbol. For the modern investor, business owner, and financial strategist, the price of oil represents a sophisticated convergence of geopolitical tension, macroeconomic policy, and a global industrial shift toward sustainability. Crude oil remains the world’s most pivotal commodity, serving as both a primary energy source and a critical barometer for global economic health. Understanding the factors that dictate its daily fluctuations is essential for anyone looking to navigate the contemporary financial landscape.
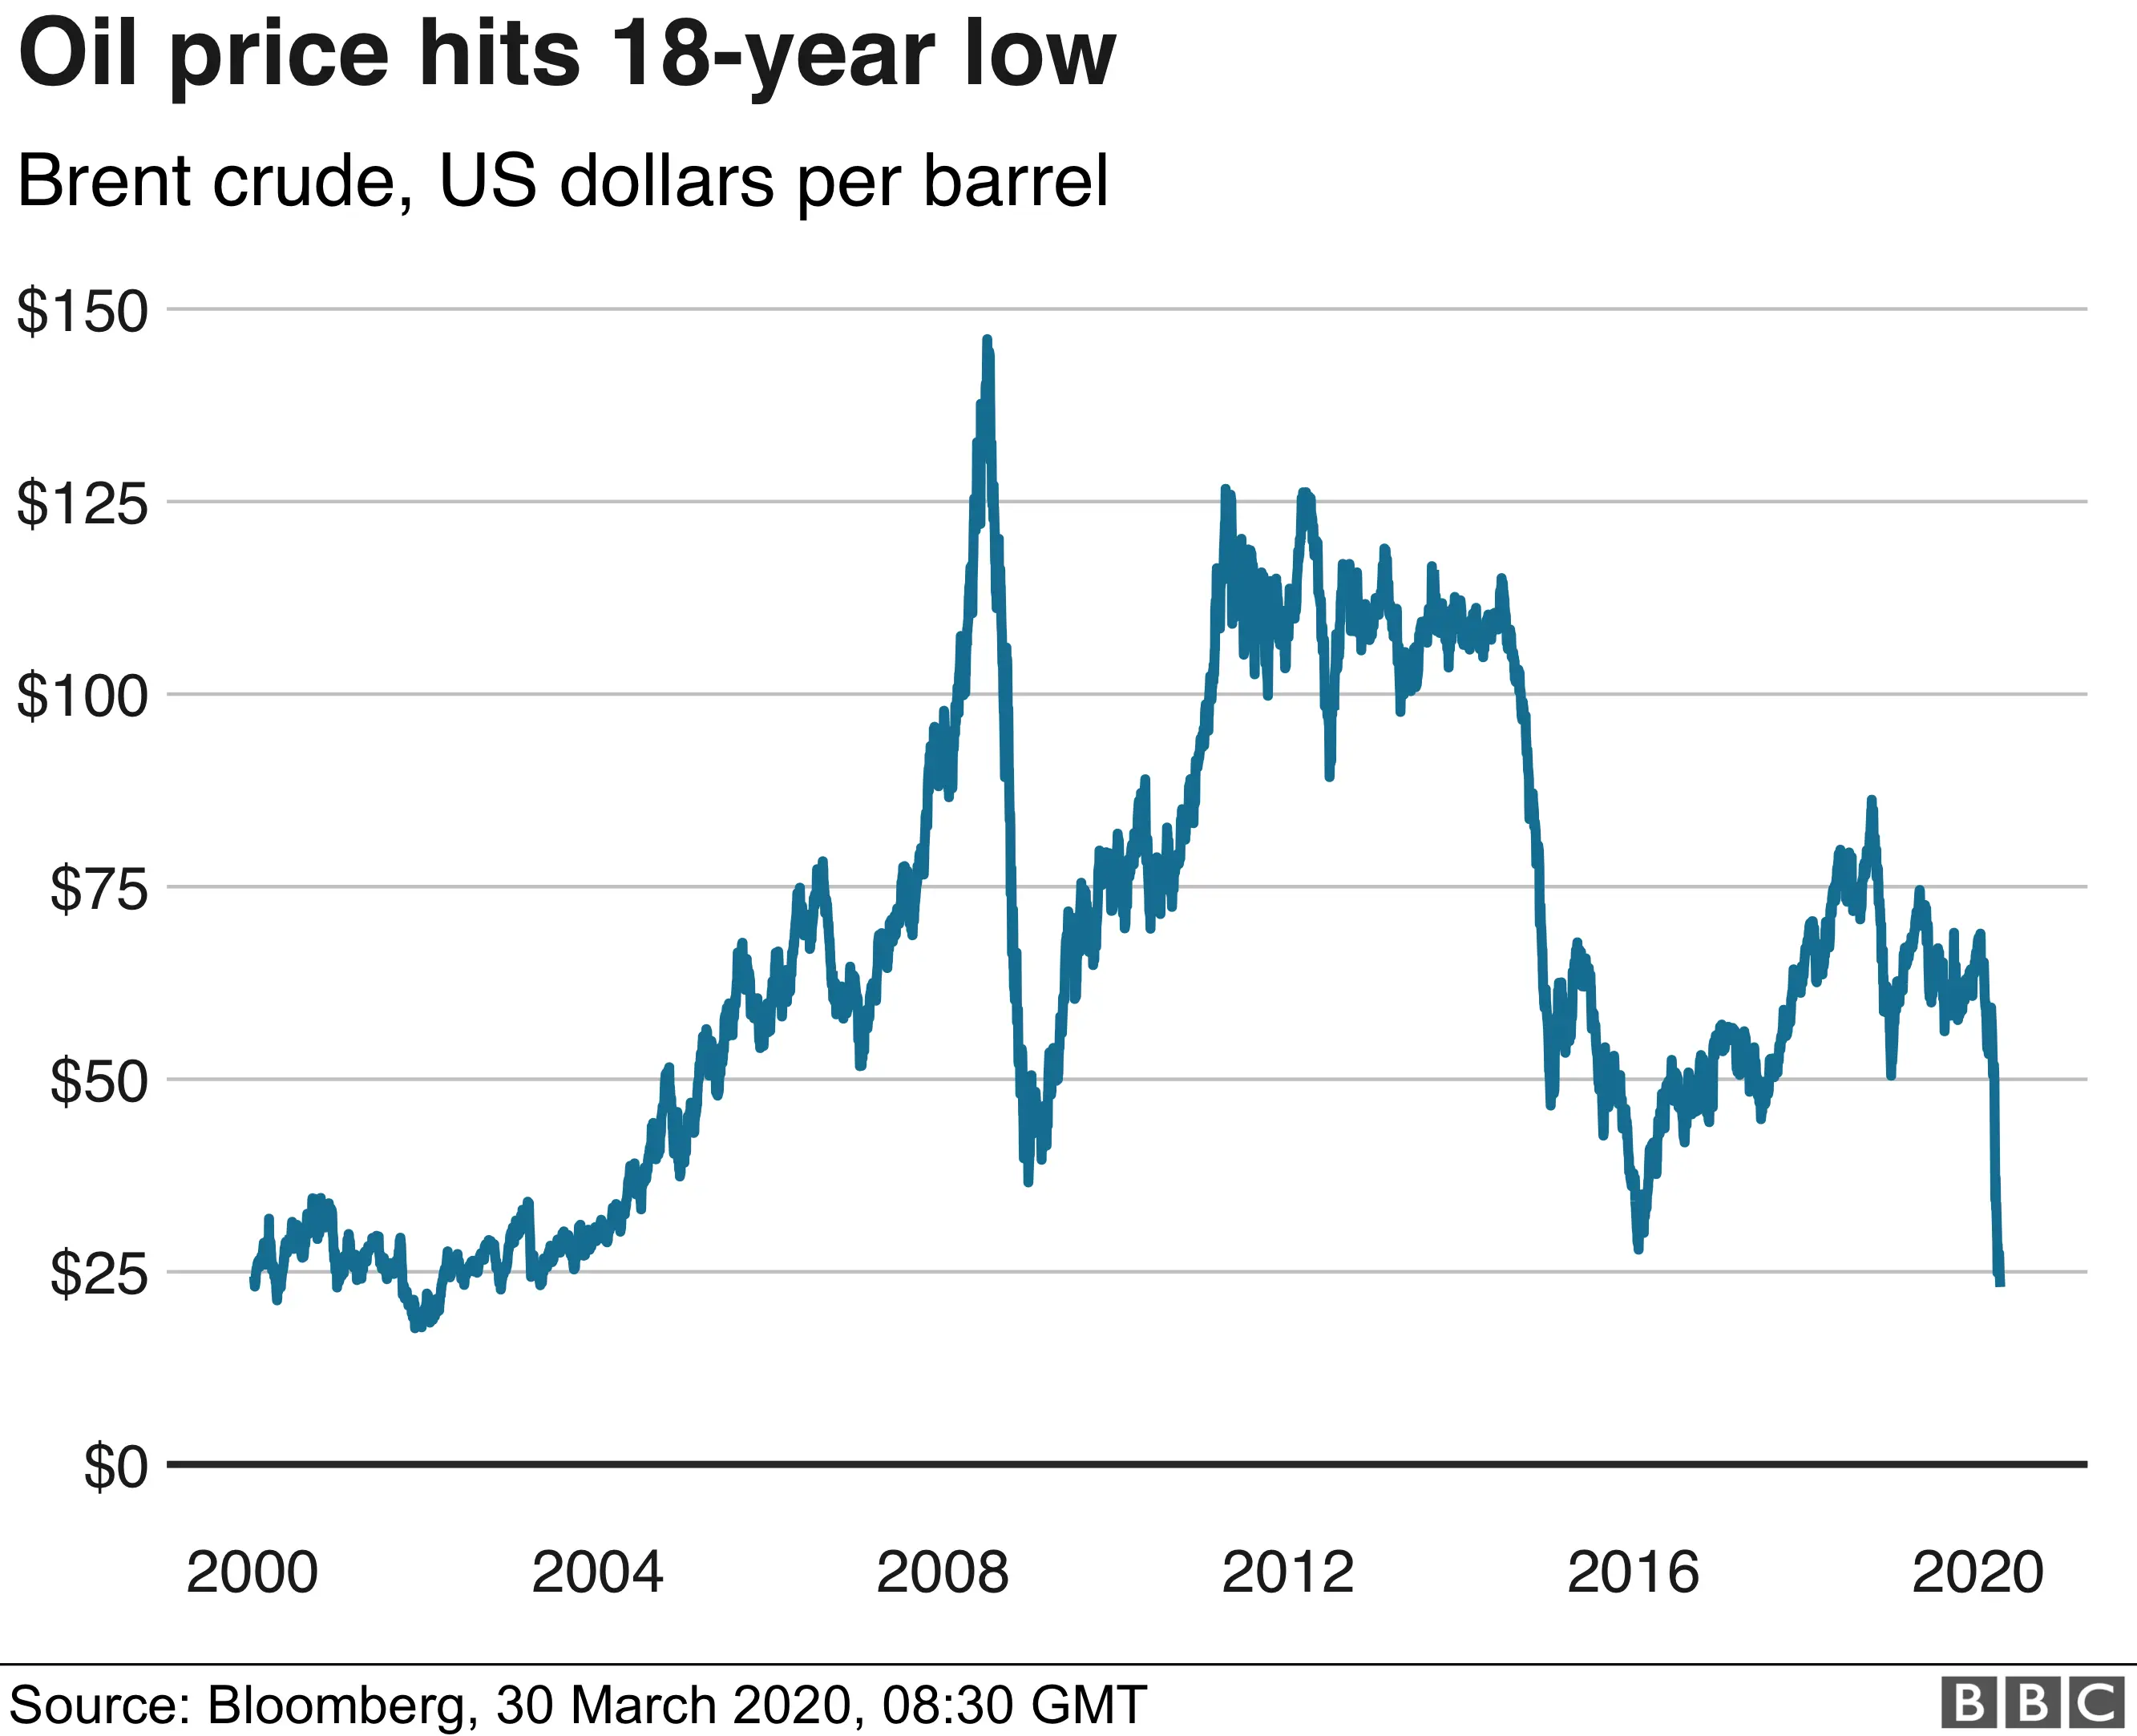
The Fundamental Drivers of Crude Oil Pricing
To understand the price of oil today, one must first look at the bedrock of commodity economics: supply and demand. However, unlike consumer goods, the oil market is subject to artificial constraints and sudden shocks that can decouple price from traditional consumption patterns.
Supply Dynamics and the Role of OPEC+
The Organization of the Petroleum Exporting Countries, along with its allies (collectively known as OPEC+), remains the single most influential force in the oil market. By adjusting production quotas, these nations attempt to manage global inventory levels and maintain price stability. When the market perceives a glut, OPEC+ often implements voluntary production cuts to support prices. Conversely, during periods of high inflation or supply shortages, pressure mounts on these nations to increase output. Investors must monitor the monthly meetings of this group, as their decisions can trigger immediate and significant volatility in both Brent and West Texas Intermediate (WTI) benchmarks.
Demand Elasticity and Global Industrial Output
On the demand side, the price of oil is intrinsically linked to global GDP growth. The “Big Three” consumers—the United States, China, and the European Union—dictate the pace of consumption. In recent years, the market has focused heavily on China’s industrial recovery. As the world’s largest importer of crude, any sign of a slowdown in Chinese manufacturing or a shift in its domestic energy policy sends ripples through the oil futures market. Similarly, in the United States, the summer driving season and winter heating requirements provide seasonal demand floors that analysts use to project price floors and ceilings.
Inventory Levels and the EIA Reports
In the United States, the Weekly Petroleum Status Report from the Energy Information Administration (EIA) is a “must-watch” event for traders. These reports detail the current levels of crude oil and refined products in storage. A “drawdown” (decrease in inventory) typically signals strong demand or tight supply, pushing prices higher. A “build” (increase in inventory) suggests a surplus, often leading to a price retreat. These data points provide the most accurate “real-time” snapshot of the physical market’s health.
The Macroeconomic Landscape and Its Impact on Oil Valuation
Beyond the physical barrels of oil being traded, the financial environment plays a massive role in determining the daily price. Oil is not just an energy source; it is a financial asset that reacts to currency fluctuations and monetary policy.
The Inverse Relationship with the US Dollar
Crude oil is priced globally in US Dollars (USD). This creates a critical inverse relationship: when the US Dollar strengthens against other major currencies, oil effectively becomes more expensive for foreign buyers, which can dampen demand and lead to lower prices. Conversely, a weaker dollar makes oil cheaper for international holders of other currencies, often stimulating demand and driving the price up. For investors, tracking the Dollar Index (DXY) is as important as tracking the oil price itself.
Inflation, Interest Rates, and Capital Costs
Central bank policies, particularly those of the Federal Reserve, have a profound impact on oil. High interest rates are designed to cool the economy and fight inflation. As borrowing costs rise, industrial activity typically slows, and consumer spending on travel and goods decreases, leading to lower oil demand. Furthermore, high interest rates increase the “cost of carry” for physical oil, making it more expensive for companies to hold large inventories. This often leads to selling pressure in the futures market as participants seek more liquid or higher-yielding assets.
The Concept of Backwardation and Contango
Professional oil traders look at the “forward curve” to understand market sentiment. If the price for immediate delivery is higher than the price for delivery in future months, the market is in “backwardation,” signaling a current shortage and high immediate demand. If the future price is higher than the current price, the market is in “contango,” suggesting a surplus and a lack of immediate urgency. These technical structures provide deep insights into how the market views the price of oil “today” versus its value six months from now.
The Energy Transition: Structural Shifts in Long-Term Value
The most significant evolution in the oil market over the last decade is the global transition toward renewable energy and decarbonization. This transition has fundamentally changed how oil companies operate and how investors value energy stocks.
ESG Investing and Capital Allocation
Environmental, Social, and Governance (ESG) criteria have become a mainstay in institutional investing. This has led to a “capital discipline” era for major oil companies (the “Supermajors”). Instead of pouring every cent of profit back into new exploration and drilling—which was the standard for decades—many companies are now returning capital to shareholders through dividends and buybacks or pivoting toward green energy projects. This lack of investment in new oil production can ironically keep the price of oil “today” higher, as supply growth fails to keep pace with even modest demand increases.
The Paradox of Peak Oil Demand
For years, analysts have debated when “peak oil” will occur—the point at which global oil consumption begins a permanent decline. While the adoption of Electric Vehicles (EVs) and improvements in energy efficiency are accelerating, the transition is not uniform. Emerging economies in Asia and Africa continue to see rising demand for oil to power their industrialization. This create a bifurcated market where short-term demand remains resilient despite long-term structural headwinds.
Geopolitical Risk Premium
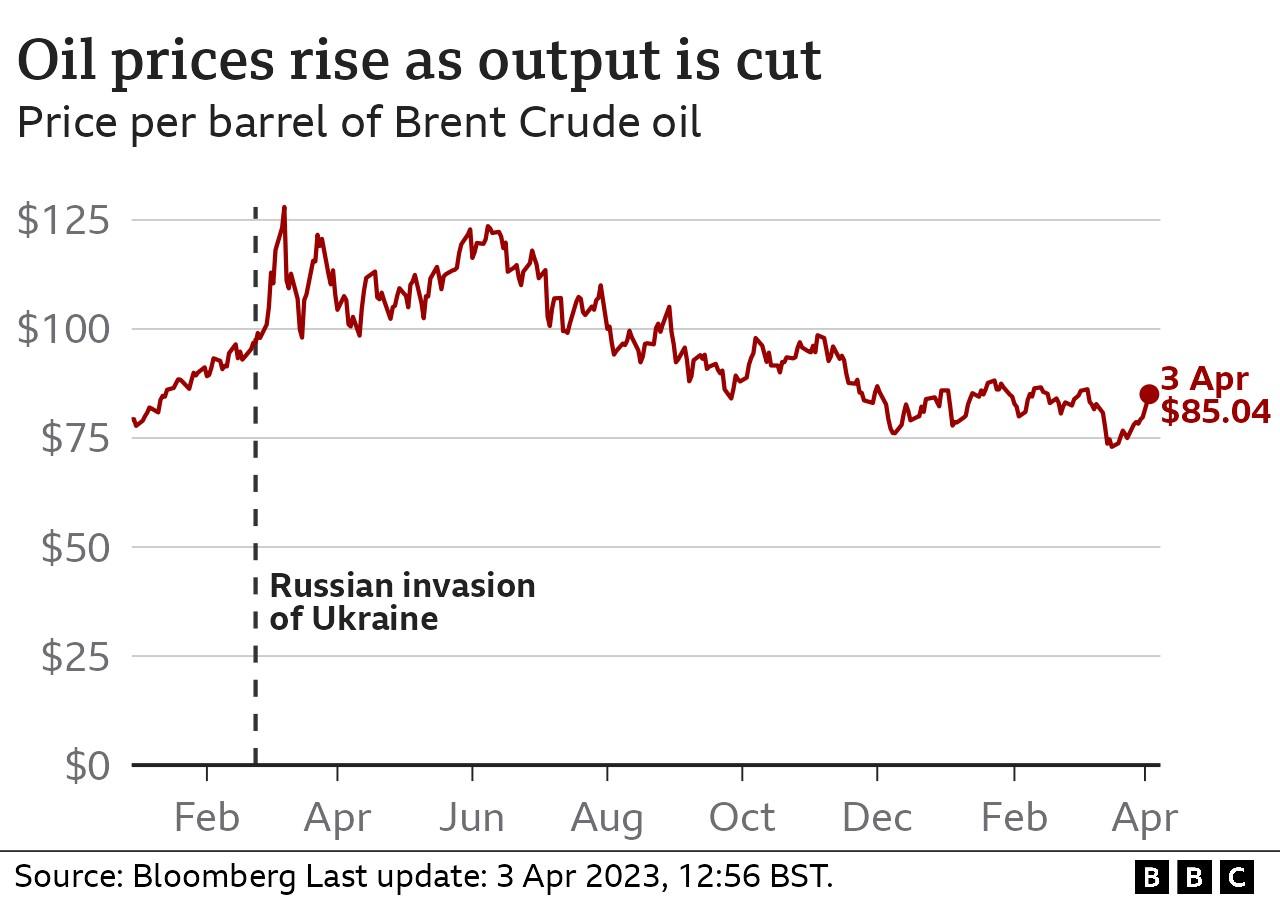
In the modern era, the price of oil often includes a “risk premium.” Conflict in the Middle East, sanctions on major producers like Russia or Iran, and instability in South American oil-producing nations create a permanent state of uncertainty. Even if supply is not currently disrupted, the threat of a disruption at key transit points—like the Strait of Hormuz—forces the market to price in the possibility of a sudden shock. This volatility is a double-edged sword for investors, offering high potential returns alongside significant downside risk.
Strategic Considerations for Individual Investors
For those looking to capitalize on oil price movements, there are several avenues to consider, each with its own risk profile and correlation to the spot price of crude.
Direct vs. Indirect Exposure
Most individual investors do not trade physical barrels of oil. Instead, they gain exposure through Exchange Traded Funds (ETFs) or individual equities.
- Commodity ETFs: Funds like the USO (United States Oil Fund) track the price of oil futures. While they offer direct exposure, they are subject to “roll yield” issues, where the cost of moving from one month’s contract to the next can erode returns over time.
- Energy Equities: Investing in companies like ExxonMobil, Chevron, or Shell provides exposure to oil prices, but these stocks also move based on corporate earnings, management quality, and dividend yields.
- Master Limited Partnerships (MLPs): These companies focus on the “midstream” sector—the pipelines and storage facilities. They are often less sensitive to the daily price of oil and more focused on the volume of oil being moved, offering attractive yields for income-focused investors.
Using Oil as a Hedge
Oil is frequently used as a hedge against inflation. Because energy costs are a primary component of the Consumer Price Index (CPI), rising oil prices often coincide with rising inflation. By holding energy assets, investors can protect their purchasing power when the prices of goods and services are climbing.
Risk Management in Volatile Markets
The oil market is notorious for “black swan” events. Whether it is a global pandemic that halts travel or a sudden geopolitical conflict, oil prices can move 10% or more in a single day. Strategic investors use stop-loss orders and maintain a diversified portfolio to ensure that a sudden drop in the “price of oil today” does not derail their entire financial plan.

The Future Outlook: What to Watch in the Coming Quarters
As we look toward the future, the price of oil will continue to be a battleground between old-world industrial needs and new-world environmental goals. Key indicators to watch include:
- Global Interest Rate Pivots: If central banks begin cutting rates, it could signal a “soft landing” for the economy, potentially sparking a rally in oil prices as industrial demand outlooks improve.
- China’s Economic Policy: Any major stimulus or shift in China’s energy import strategy will have an outsized impact on global benchmarks.
- Technological Breakthroughs: Improvements in carbon capture or long-range battery storage could accelerate the energy transition, putting downward pressure on long-term oil price projections.
In conclusion, “what price oil today” is a question that requires an understanding of the entire global financial ecosystem. From the halls of OPEC+ to the trading floors of New York and the EV factories in Shanghai, a multitude of factors work together to set the price of the world’s most essential commodity. For the informed investor, staying ahead of these trends is the key to successfully navigating the volatility and opportunity of the energy market.
aViewFromTheCave is a participant in the Amazon Services LLC Associates Program, an affiliate advertising program designed to provide a means for sites to earn advertising fees by advertising and linking to Amazon.com. Amazon, the Amazon logo, AmazonSupply, and the AmazonSupply logo are trademarks of Amazon.com, Inc. or its affiliates. As an Amazon Associate we earn affiliate commissions from qualifying purchases.