
Understanding the allocation of national wealth toward defense is more than a matter of geopolitical strategy; it is a fundamental exercise in macroeconomics and fiscal management. As of the current fiscal period, the United States spends approximately 3.4% to 3.5% of its Gross Domestic Product (GDP) on the military. While this figure represents a significant portion of the federal budget, the story of defense spending is one of fluctuating priorities, evolving threats, and deep-seated economic implications.
For investors, business leaders, and taxpayers, this percentage is a barometer for national priorities. It dictates the flow of billions of dollars into the private sector, influences the national debt, and shapes the labor market. To understand where this money goes and what it means for the American economy, we must look beyond the raw numbers and examine the structural mechanics of military finance.
The Historical Trajectory: From Total War to Modern Deterrence
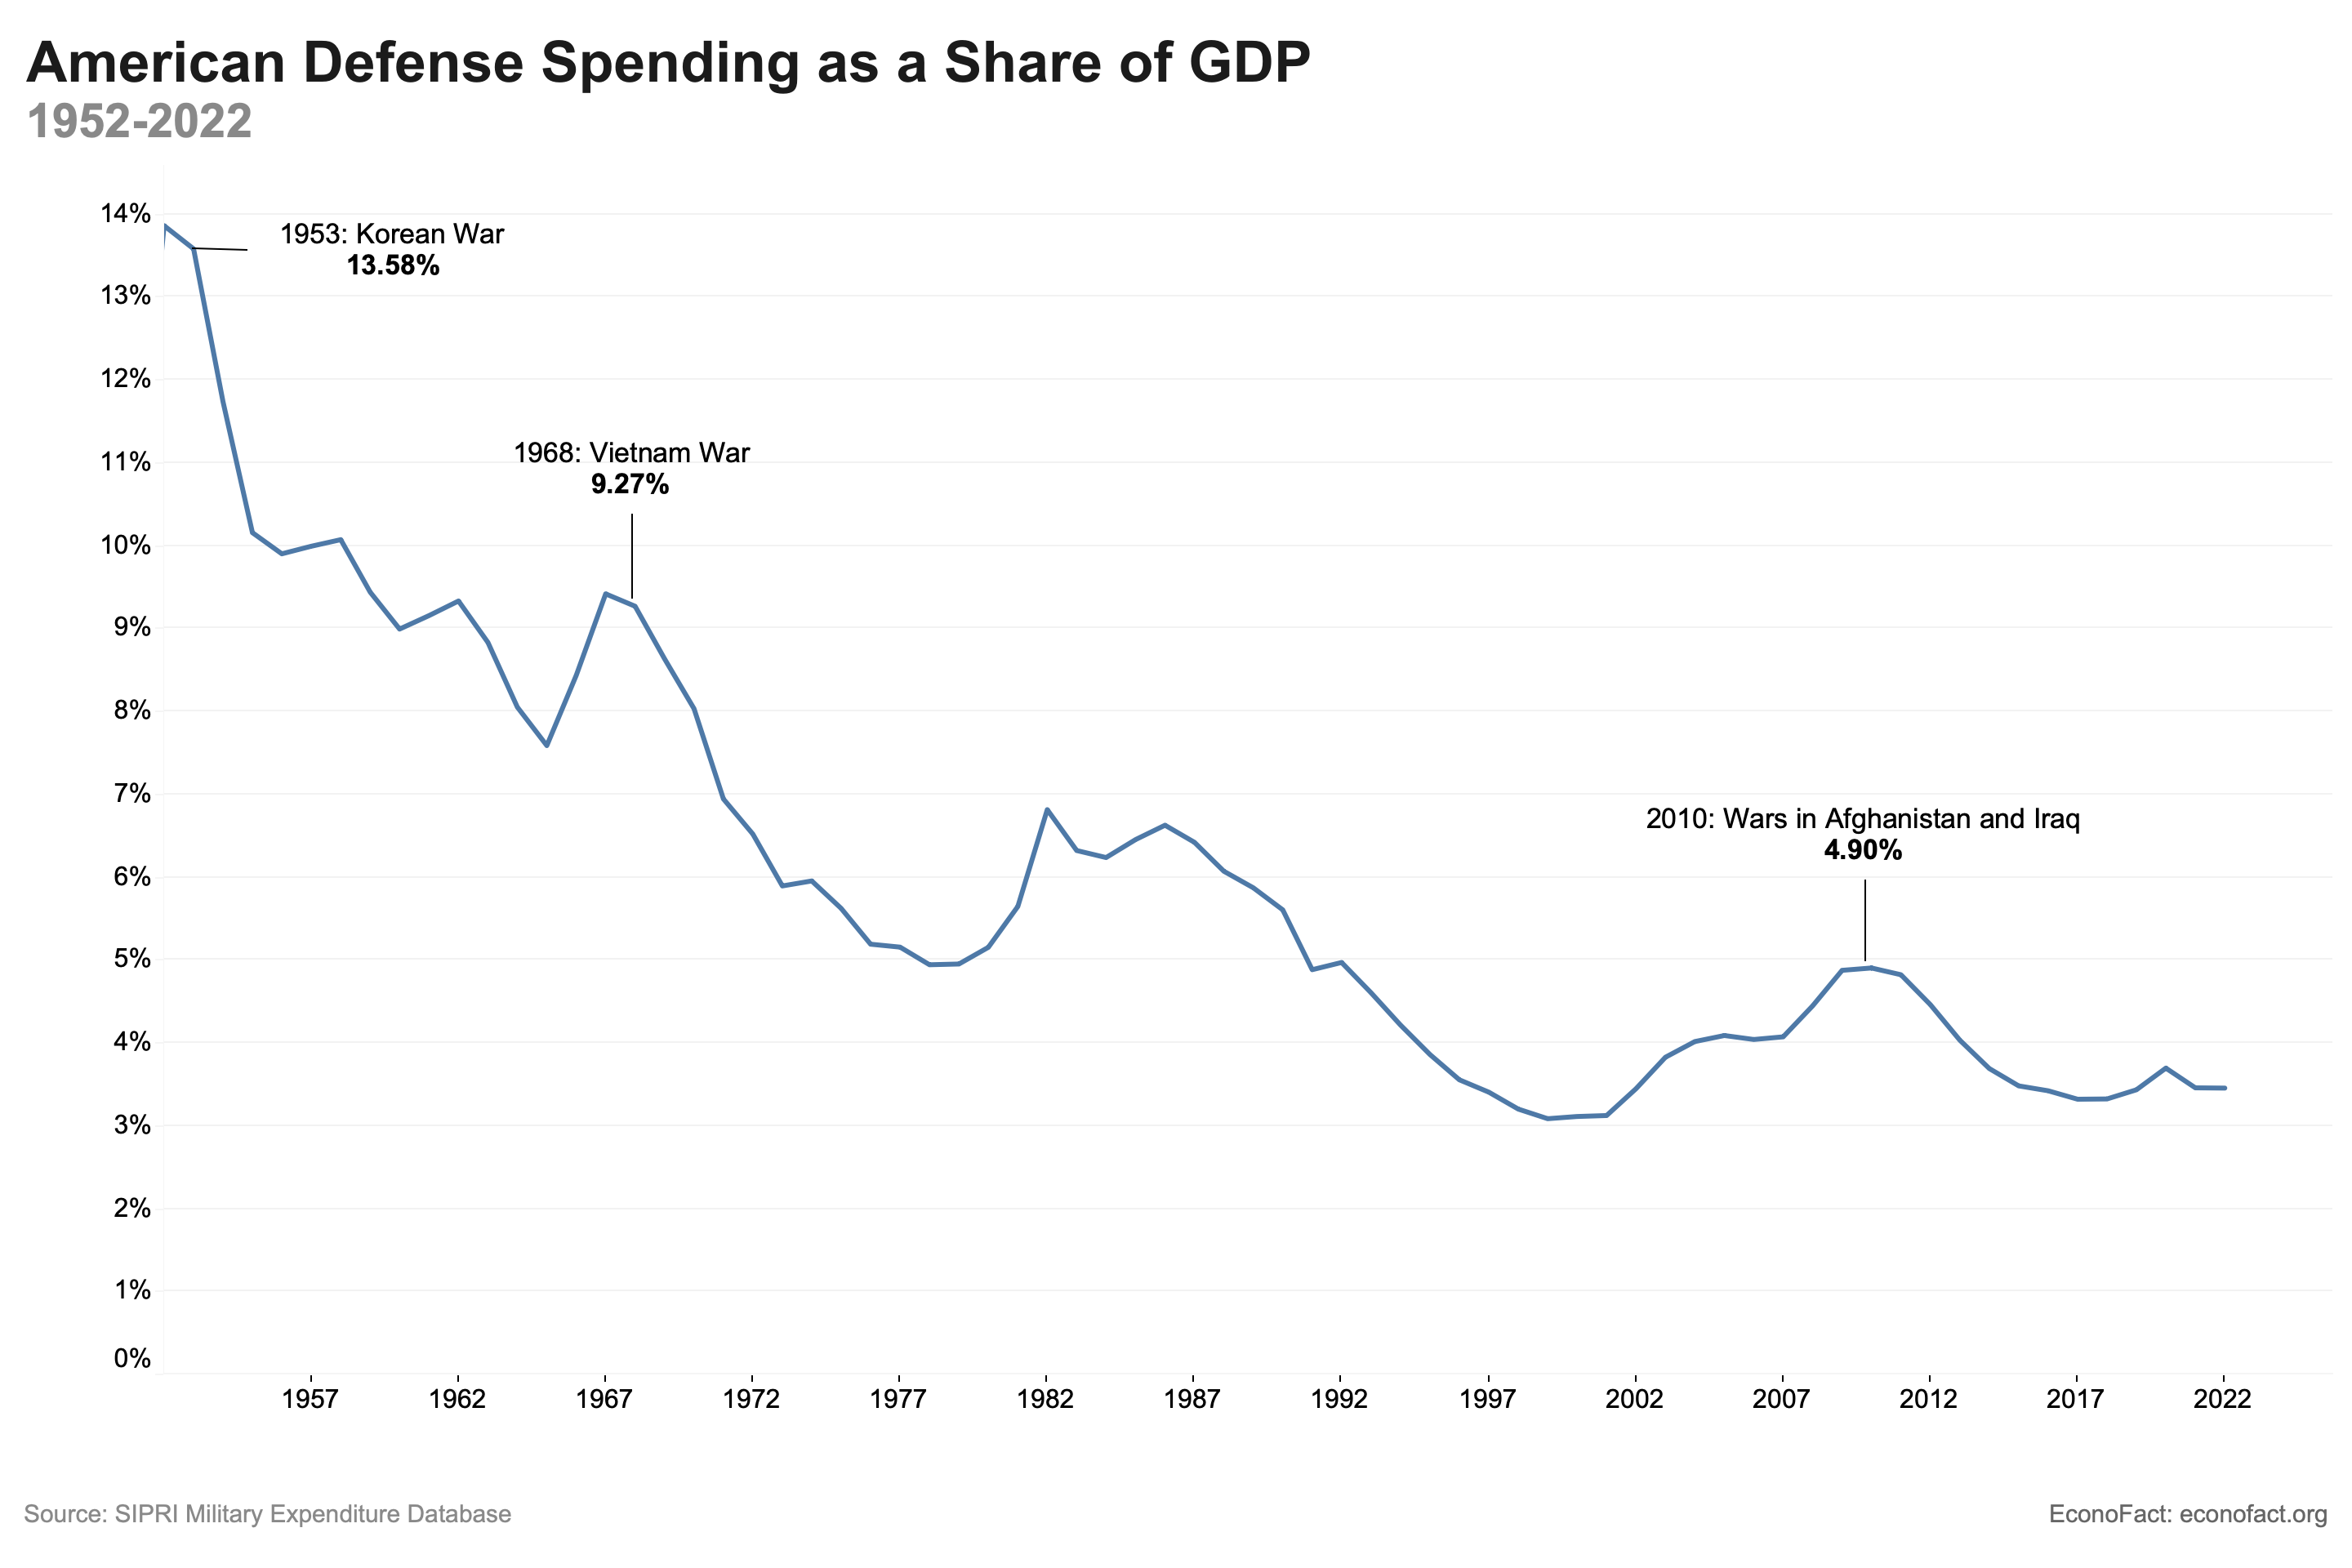
The current spending level of roughly 3.4% of GDP is historically modest when compared to previous eras of American history. To understand the “Money” aspect of defense, one must look at the long-term trend lines that have shaped the U.S. Treasury’s obligations.
The Peak Eras: WWII and the Cold War
During the height of World War II, military spending reached an astronomical 37% of GDP. This was a “total war” economy where the entire industrial capacity of the nation was pivoted toward defense. Following the war, spending dropped, only to rise again during the Cold War. In the 1950s and 1960s, it was common for the U.S. to allocate between 7% and 10% of its GDP to the Department of Defense (DoD). This era established the “Military-Industrial Complex,” a term coined by President Dwight D. Eisenhower to describe the symbiotic relationship between the government and private defense contractors.
The Peace Dividend of the 1990s
Following the collapse of the Soviet Union, the U.S. experienced what economists call the “Peace Dividend.” Defense spending as a percentage of GDP plummeted, reaching a modern low of roughly 2.9% in the late 1990s. This reduction allowed for a brief period of federal budget surpluses and shifted capital toward the burgeoning tech sector and domestic infrastructure.
The Post-9/11 Surge and Stabilization
The geopolitical shifts following 2001 saw a rapid re-escalation of spending. By 2010, at the height of the conflicts in Iraq and Afghanistan, military spending rose to approximately 4.7% of GDP. In the decade since, even as the base budget grew in nominal dollar terms, the percentage of GDP has gradually declined as the broader U.S. economy grew at a faster rate than defense appropriations. Today’s 3.4% represents a stabilized posture that balances “Great Power Competition” with domestic fiscal constraints.
The Economic Mechanics of Defense Spending
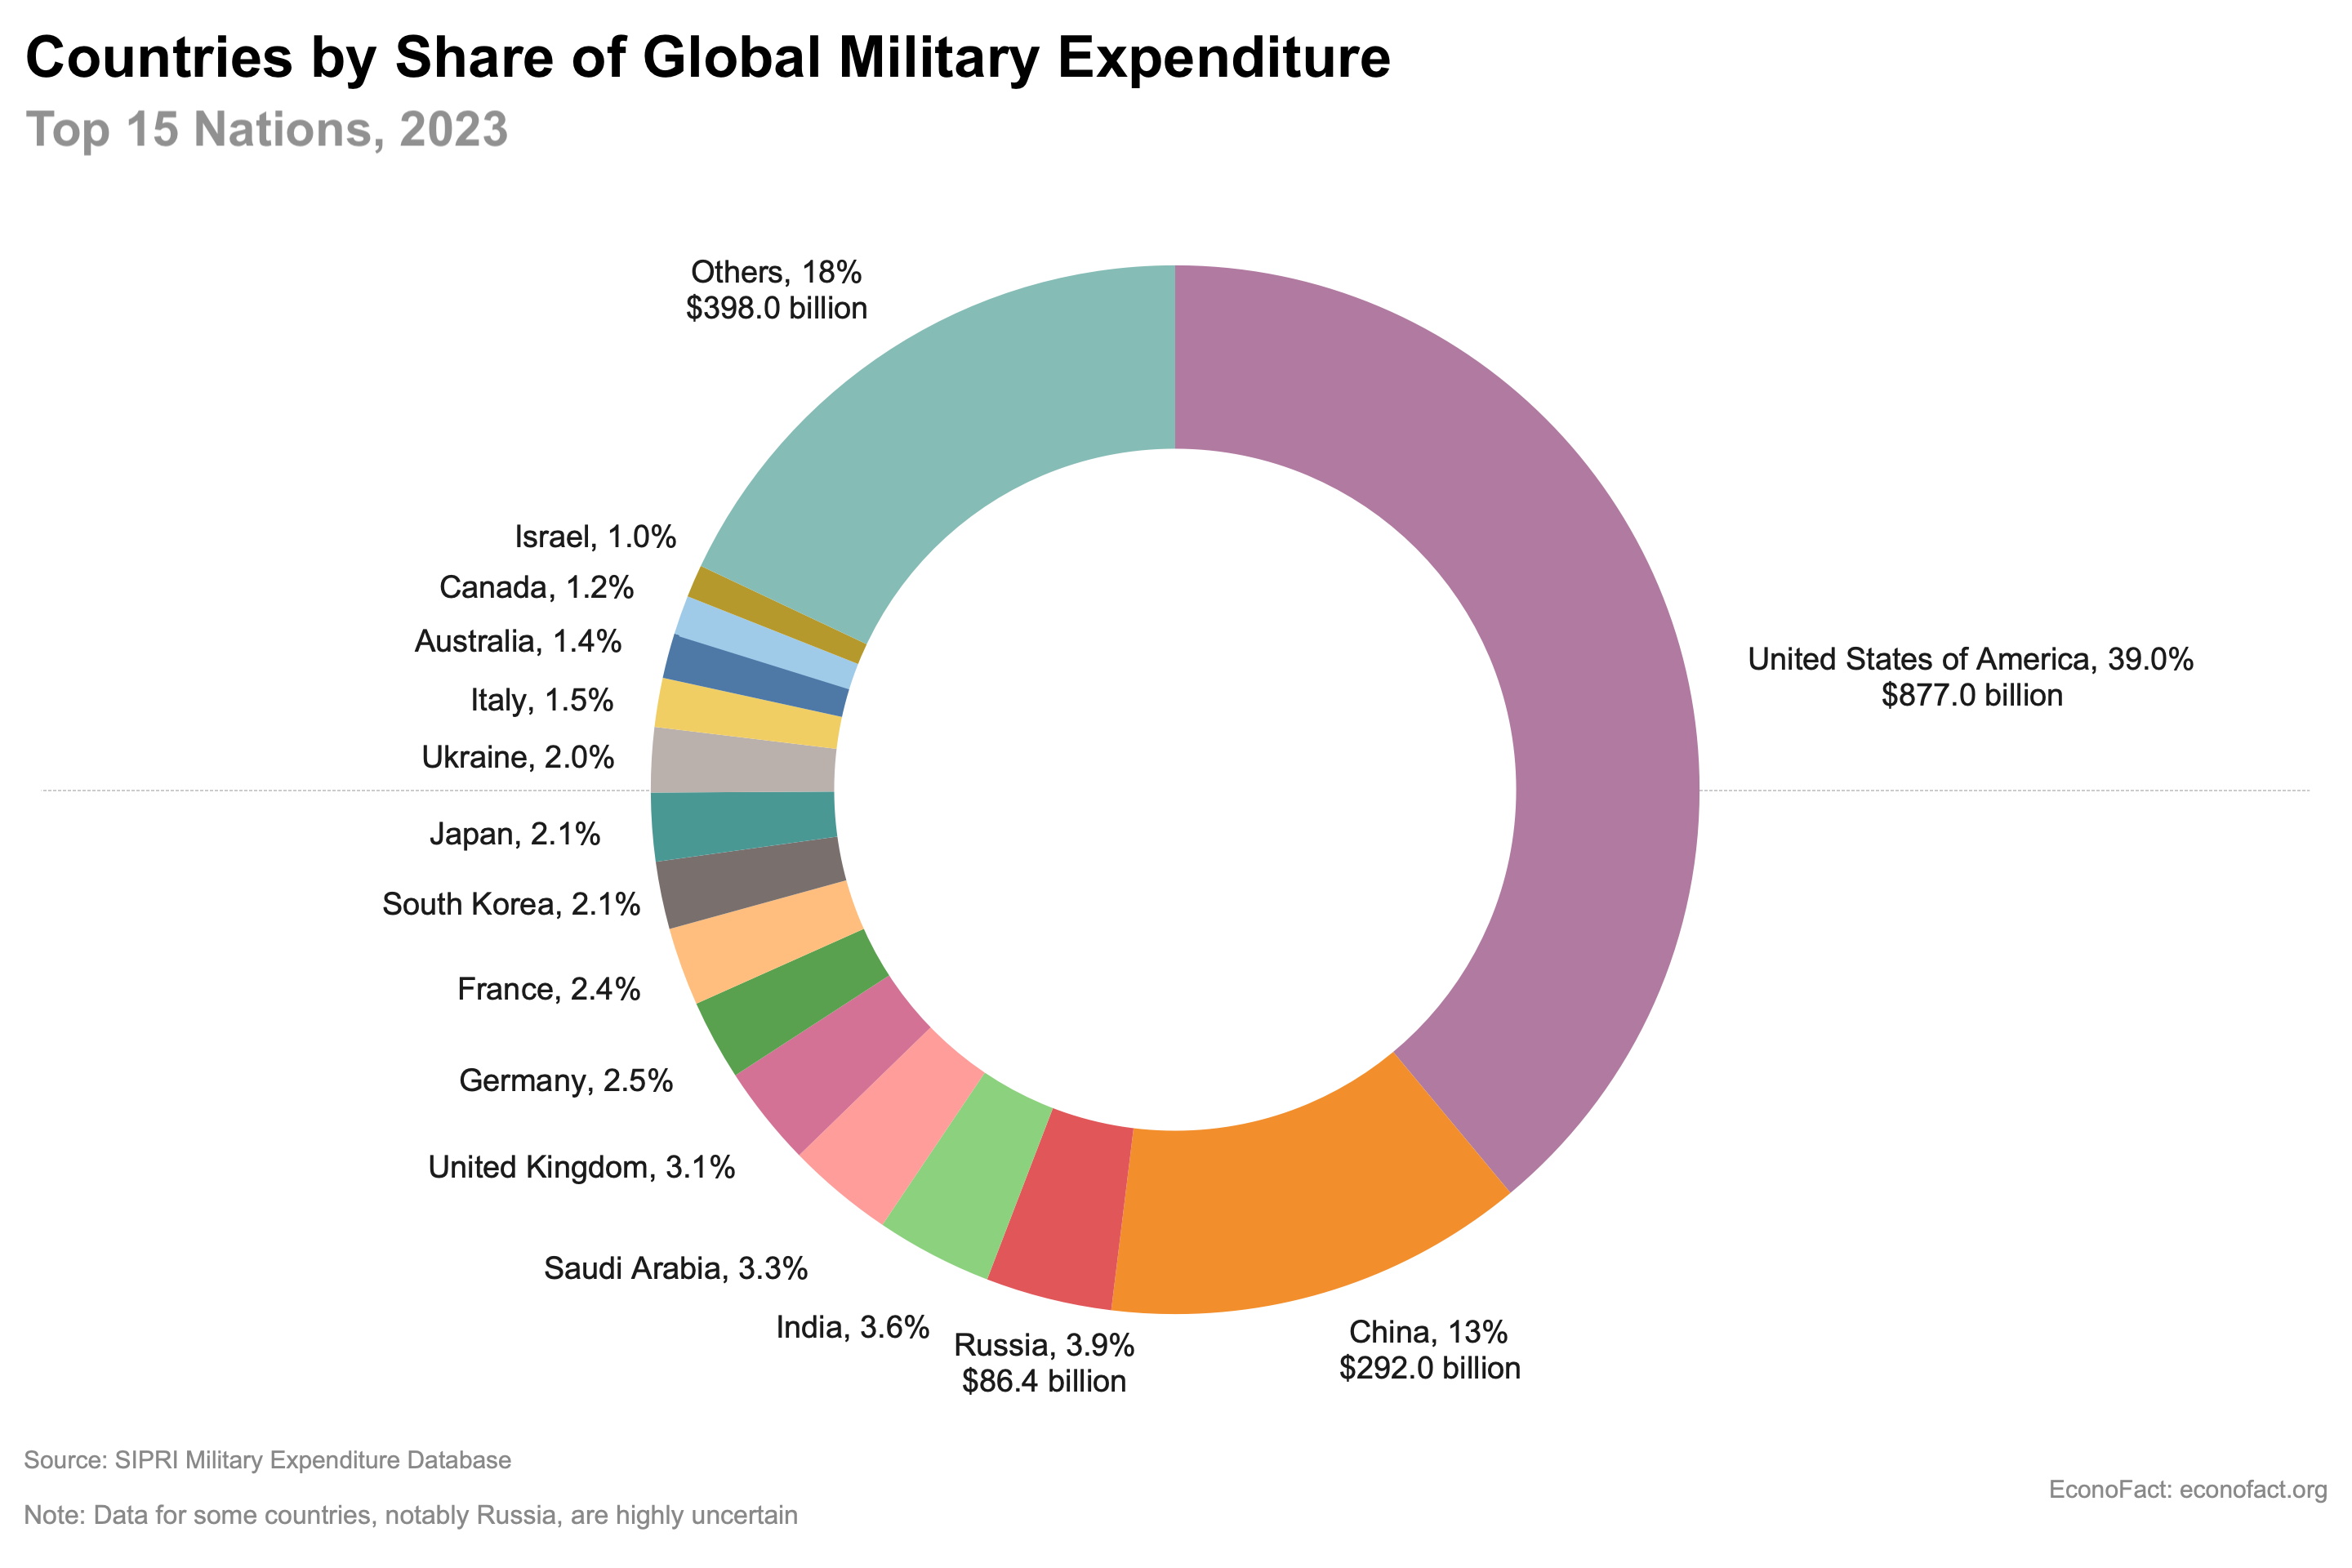
When the federal government allocates nearly $900 billion annually to the military, it acts as a massive engine for the private sector. This spending is not a vacuum; it is a redistribution of tax revenue and debt into the hands of corporations, researchers, and service members.
Procurement and the Private Sector
A substantial portion of the defense budget—roughly one-third—is dedicated to the procurement of equipment, ranging from aircraft carriers to microchips. This money flows directly into the balance sheets of major aerospace and defense firms like Lockheed Martin, Raytheon (RTX), and General Dynamics. For these companies, the U.S. government is a “monopsony” buyer—a single buyer with immense power. From a financial perspective, these contracts are often “cost-plus,” ensuring a specific margin of profit for the company, which makes defense stocks a staple for institutional investors seeking stability and dividends.
Research and Development (R&D) Spillovers
The DoD is one of the world’s largest investors in Research, Development, Test, and Evaluation (RDT&E). Historically, military R&D has been a primary driver of commercial innovation. The internet (ARPANET), Global Positioning System (GPS), and jet engines all began as military-funded projects. Today, billions are flowing into AI, quantum computing, and hypersonic technology. For the broader economy, this represents a “socialization” of the risk associated with high-tech development; the government takes the financial risk of failure, and the private sector eventually commercializes the successful results.
The Military Labor Market
The military is also the nation’s largest employer. Beyond the 1.3 million active-duty personnel, the defense budget supports millions of civilian contractors and jobs in the defense industrial base. This provides a steady floor for employment in specific geographic hubs, such as Northern Virginia, Southern California, and Texas. The “Money” trail here is clear: military spending acts as a form of geographic industrial policy, subsidizing high-tech manufacturing and engineering jobs across the country.
The Fiscal Impact: Opportunity Cost and National Debt
While defense spending stimulates certain sectors, it does not come without a high financial cost. In the world of finance, every dollar spent on a fighter jet is a dollar that cannot be spent on education, infrastructure, or debt reduction. This is the classic “Guns vs. Butter” debate.
The Deficit and Discretionary Spending
To understand the percentage of GDP spent on the military, one must distinguish between “discretionary” and “mandatory” spending. Military spending accounts for nearly half of all federal discretionary spending—the portion of the budget that Congress must approve each year. As the U.S. national debt surpasses $34 trillion, the interest payments on that debt are beginning to rival the defense budget in size. This creates a fiscal “crowding out” effect, where the cost of borrowing to fund the military reduces the capital available for other investments.
The Inflationary Pressure of Defense Spending
Economists often debate the inflationary impact of high military spending. Unlike investments in infrastructure or education, which can increase the productive capacity of the economy (by making transport faster or workers smarter), military spending is often considered “consumptive.” A missile is built, and then it is either stored or used; it does not produce future goods or services. Large infusions of cash into the economy for goods that are not consumed by the public can, in some economic models, contribute to inflationary pressure by increasing the money supply without a corresponding increase in the supply of consumer goods.
The “Sovereign Credit” Perspective
From an international finance perspective, the U.S.’s ability to spend 3.4% of its GDP on the military is tied to the “exorbitant privilege” of the U.S. Dollar as the global reserve currency. Because the U.S. can borrow in its own currency, it can maintain a higher level of military spending and national debt than most other nations. However, if military spending contributes to an unsustainable debt-to-GDP ratio, it could eventually threaten the creditworthiness of the U.S., leading to higher interest rates and a weaker dollar.
Global Benchmarking: The 2% Standard and Beyond
The 3.4% of GDP spent by the United States is frequently compared to its international peers and rivals. This comparison is a key driver of modern foreign policy and fiscal debate.
The NATO 2% Target
The U.S. has long pressured its NATO allies to meet a minimum spending threshold of 2% of their respective GDPs. While many European nations have historically fallen short of this goal, the geopolitical shifts in Eastern Europe have led to a rapid increase in spending across the continent. From a financial standpoint, if U.S. allies increase their spending, it theoretically reduces the burden on the American taxpayer, though in practice, it often just creates more demand for American-made defense exports.
The U.S. vs. China and Russia
When comparing spending as a percentage of GDP, the U.S. (3.4%) spends significantly more than China (estimated at roughly 1.7% to 1.9% by official counts, though likely higher in reality). However, because of “Purchasing Power Parity” (PPP), China’s military budget goes much further. A Chinese engineer or soldier costs significantly less than an American counterpart. This means that while the U.S. spends a higher percentage of its GDP, the gap in actual “military output” is narrowing. Russia, by contrast, has pivoted to a war economy, with spending reportedly exceeding 6% of its GDP, a level that is historically difficult to sustain without significant domestic economic degradation.

The Future of Military Spending: Trends to Watch
As we look toward the 2030s, several factors will determine whether the military’s share of the GDP remains at 3.4% or shifts.
- Automation and AI: The shift from expensive, manned platforms (like $100 million stealth fighters) to cheaper, autonomous drones could theoretically lower the cost of maintaining a dominant military. However, the R&D costs for these technologies are currently driving budgets upward.
- Modernization Cycles: The U.S. is currently in the middle of a massive “Nuclear Triad” modernization program. This is a multi-decade, trillion-dollar commitment that will put upward pressure on the defense budget for the foreseeable future.
- The Interest Rate Environment: If interest rates remain “higher for longer,” the cost of servicing the national debt will force hard choices in Washington. Military spending, despite its political popularity, will face increased scrutiny as lawmakers look for ways to trim the deficit.
In conclusion, the 3.4% of GDP that America spends on its military is a foundational element of the global financial order. It serves as a massive industrial subsidy, a driver of technological innovation, and a significant contributor to the national debt. For those navigating the world of money and finance, understanding this allocation is essential to grasping the true levers of the American economy. Whether this percentage is seen as a necessary insurance policy for global trade or an unsustainable drain on national resources, its impact on the marketplace is undeniable.
aViewFromTheCave is a participant in the Amazon Services LLC Associates Program, an affiliate advertising program designed to provide a means for sites to earn advertising fees by advertising and linking to Amazon.com. Amazon, the Amazon logo, AmazonSupply, and the AmazonSupply logo are trademarks of Amazon.com, Inc. or its affiliates. As an Amazon Associate we earn affiliate commissions from qualifying purchases.