In the intricate world of finance, few mathematical concepts hold as much power and pervasive influence as the humble percentage. Far more than just a schoolroom calculation, understanding “what percent of a number is another number” is the foundational key to unlocking critical financial insights, making informed decisions, and ultimately, achieving your monetary goals. Whether you’re a meticulous budgeter, a shrewd investor, a budding entrepreneur, or simply navigating daily expenses, percentages are the universal language that translates raw figures into meaningful, actionable information. They allow us to compare, analyze, and project, transforming complex financial data into digestible truths. This article will delve into the profound importance of percentages across personal finance, investing, and business, demonstrating how mastering this simple concept can elevate your financial literacy and empower you to navigate the economic landscape with confidence and precision.
The Foundational Calculation: Demystifying Percentages
At its core, calculating what percent one number is of another is a straightforward mathematical operation. However, its simplicity belies its immense utility, especially in finance. Grasping this fundamental formula is the first step towards demystifying complex financial scenarios and making smarter money moves.
Basic Formula and Interpretation
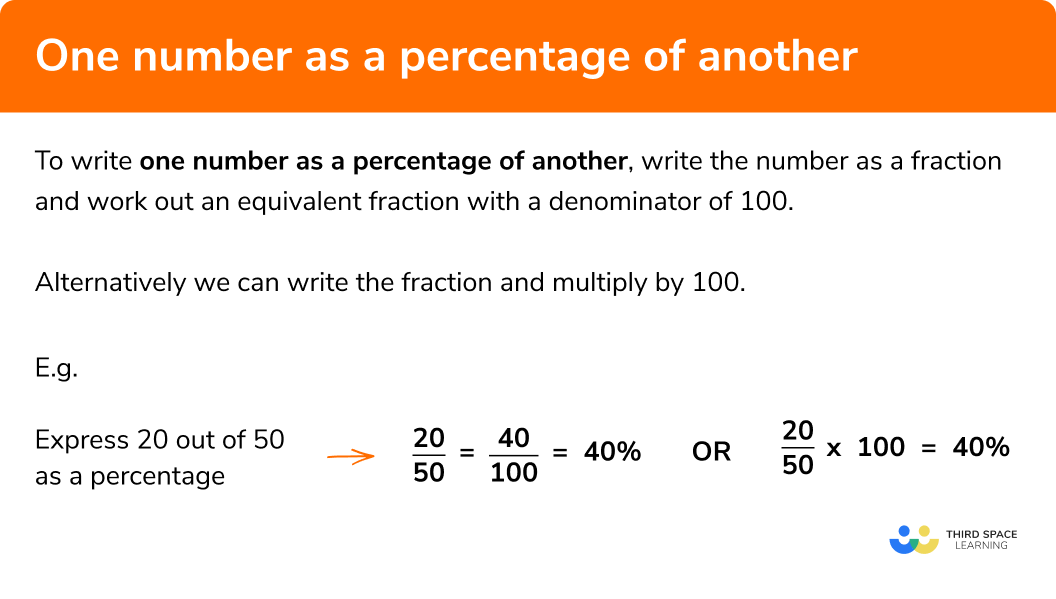
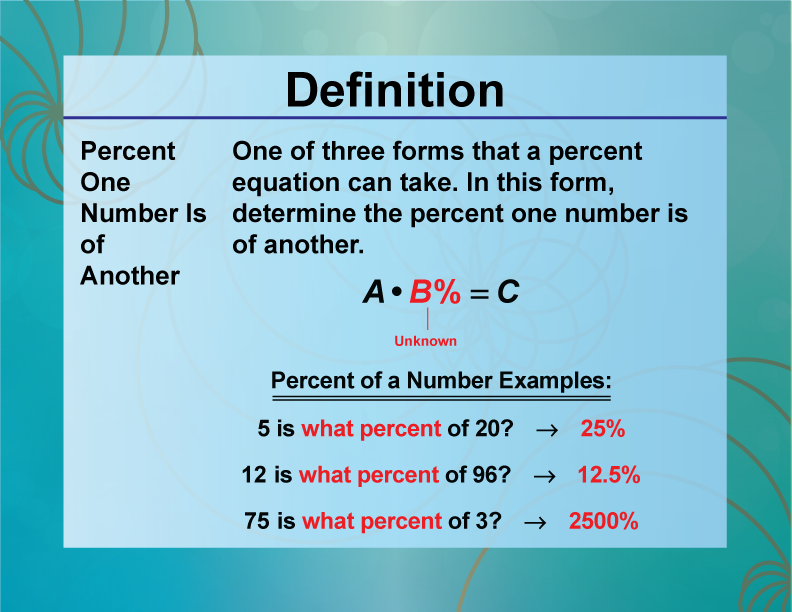
The most common way to express one number as a percentage of another is using the formula:
Percentage = (Part / Whole) * 100
Here, the “Part” is the specific quantity you are interested in, and the “Whole” is the total or reference quantity. Multiplying by 100 converts the decimal ratio into a percentage.
For instance, if you spent $300 on groceries from a total income of $3,000, you would calculate:
($300 / $3,000) * 100 = 0.1 * 100 = 10%
This tells you that 10% of your income went to groceries. This single percentage figure is far more insightful than just knowing the absolute $300, as it provides context relative to your total income. It allows for comparison, for example, if last month groceries were 12% of your income, you know you’ve reduced that expense.
The Inverse: Finding the Part or the Whole
The beauty of this foundational formula is its versatility. Once you understand the relationship between the part, the whole, and the percentage, you can rearrange it to solve for any of these variables, which is incredibly useful in various financial contexts.
-
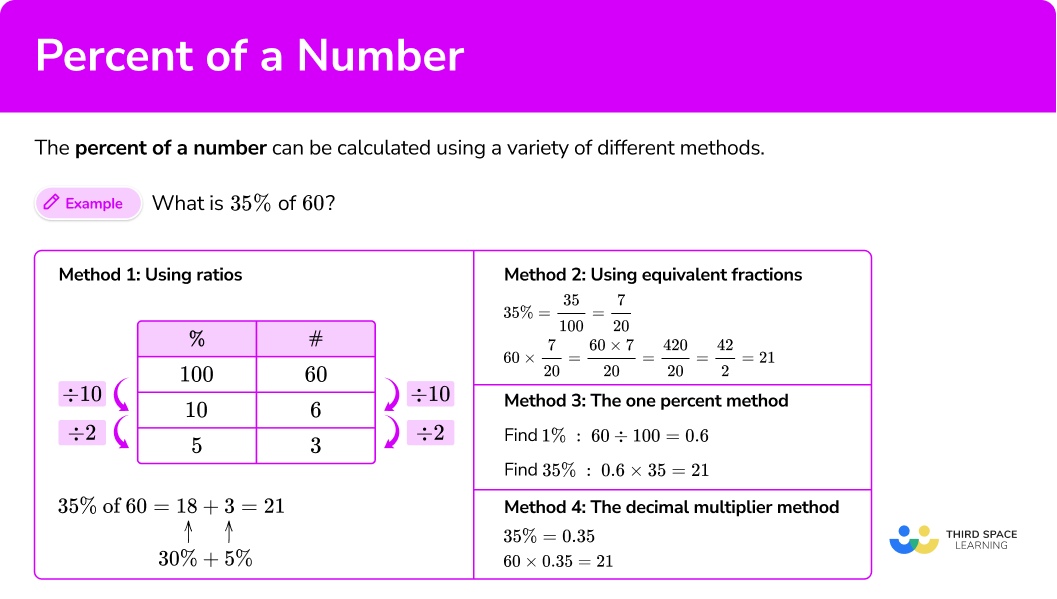
Finding the Part (when you know the Whole and the Percentage):
If you want to know what 20% of your $3,000 income is, you calculate:
Part = (Percentage / 100) * Whole
Part = (20 / 100) * $3,000 = 0.20 * $3,000 = $600
This calculation is crucial for setting savings goals (e.g., 15% of income), calculating taxes (e.g., 25% tax bracket), or understanding a discount (e.g., 30% off). -
Finding the Whole (when you know the Part and the Percentage):
Imagine you received a $50 bonus, and you know this bonus represents 1% of your total monthly sales. To find your total sales, you’d calculate:
Whole = Part / (Percentage / 100)
Whole = $50 / (1 / 100) = $50 / 0.01 = $5,000
This method is invaluable for reverse-engineering financial scenarios, like determining the original price of an item after a discount or understanding the total value of an investment based on a known gain.
Mastering these basic manipulations equips you with the analytical toolkit necessary to dissect almost any financial situation, moving beyond mere numbers to grasp their true significance.
Personal Finance: Empowering Your Budget and Savings
For individuals managing their money, percentages are not just theoretical constructs; they are practical tools that illuminate spending habits, accelerate savings, and provide clarity on debt. Integrating percentage-based thinking into your personal finance routine transforms abstract numbers into actionable insights.
Budgeting for Financial Control
One of the most immediate and impactful applications of percentages in personal finance is budgeting. A budget is more than just a list of income and expenses; it’s a strategic allocation of your financial resources. Percentages help you visualize this allocation relative to your total income, making it easier to identify areas of overspending or opportunities for savings.
Consider the popular 50/30/20 rule:
- 50% of your after-tax income for Needs (housing, utilities, groceries, transportation).
- 30% for Wants (dining out, entertainment, hobbies, travel).
- 20% for Savings & Debt Repayment (retirement accounts, emergency fund, extra debt payments).
To apply this, you’d calculate:
- What percentage of my income goes to housing? If it’s 35%, and your “Needs” allocation is 50%, you know you have only 15% left for all other necessities. This might indicate that housing costs are too high.
- What percentage are my monthly restaurant bills? If it’s 15% of your income, and your “Wants” allocation is 30%, you still have 15% for other discretionary spending.
By viewing your expenses as percentages, you gain a powerful framework for evaluating your financial health and making adjustments to align with your goals, rather than just tallying up dollar amounts.
Understanding Savings and Debt Growth
Percentages are the engine of both wealth creation and debt accumulation.
- Savings: When you earn interest on a savings account or investment, that interest is typically expressed as an annual percentage yield (APY). Understanding how this percentage is applied to your principal—and the magical effect of compounding interest (interest earning interest)—is crucial for long-term wealth building. A seemingly small 1% APY on a large sum over many years can lead to substantial growth.
- Debt: Conversely, interest rates on loans, mortgages, and credit cards are also expressed as percentages (APR – Annual Percentage Rate). Calculating what percentage of your monthly payment goes towards interest versus principal helps you understand the true cost of borrowing and strategize for faster debt repayment. High credit card APRs (e.g., 20%+) can quickly erode your financial stability, and recognizing this percentage burden is the first step towards addressing it.
Navigating Discounts and Sales
From a personal finance perspective, percentages are your best friend when shopping. A “25% off” sale or a “buy one, get one 50% off” deal requires a quick percentage calculation to understand the actual savings.
- If an item costs $100 and is 25% off, the discount is
(25 / 100) * $100 = $25, making the new price $75. - This immediate calculation helps you assess whether a deal is truly worthwhile and prevents impulse purchases based solely on the allure of a “sale” sign.
Investing and Wealth Building: Measuring Performance and Risk
In the realm of investing, percentages transition from merely informational to absolutely critical. They provide the universal yardstick for measuring performance, assessing risk, and making strategic allocation decisions that can significantly impact your long-term wealth.
Calculating Returns on Investment (ROI)
The most fundamental application of percentages in investing is the calculation of Return on Investment (ROI). This metric expresses the gain or loss from an investment relative to its initial cost, providing a standardized way to compare different opportunities.
ROI Percentage = ((Current Value - Initial Investment) / Initial Investment) * 100
If you invested $10,000 in a stock that is now worth $12,000, your ROI would be:
(($12,000 - $10,000) / $10,000) * 100 = ($2,000 / $10,000) * 100 = 0.20 * 100 = 20%
This 20% figure is much more powerful than simply knowing you made $2,000. It allows you to:
- Compare investments: Was a 20% return on this stock better than a 5% return on another investment over the same period?
- Assess risk-adjusted returns: How much risk did you take to achieve that 20% return?
- Track progress towards goals: If your goal is an average 8% annual return, you can see if you’re on track.
Portfolio Allocation and Diversification
Smart investing emphasizes diversification – spreading your investments across different asset classes to mitigate risk. Percentages are the backbone of this strategy, guiding your asset allocation.
- What percentage of your portfolio is allocated to stocks, bonds, real estate, or alternative investments?
- Are you adhering to the “Rule of 100” (or 110/120), where the percentage of your portfolio in stocks is roughly 100 minus your age?
- If your portfolio has shifted (e.g., stocks have performed exceptionally well), the percentage allocation will change, signaling a need to rebalance back to your target percentages to maintain your desired risk profile.
Understanding these percentages ensures your portfolio remains aligned with your risk tolerance and financial goals, preventing overexposure to volatile assets or underutilization of growth opportunities.
Understanding Investment Fees and Expenses
A crucial, yet often overlooked, aspect of investing is the impact of fees. Investment funds, such as mutual funds and ETFs, often charge expense ratios, expressed as a percentage of the assets under management (AUM).
- A 1% annual expense ratio means 1% of your invested capital is deducted each year, regardless of performance. Over decades, even a seemingly small percentage fee can dramatically reduce your total returns due to the power of compounding.
- For example, a $100,000 portfolio growing at 7% annually would be $761,225 after 30 years without fees. With a 1% fee, it would be only $574,349 – a difference of nearly $187,000!
Being able to calculate and understand the long-term impact of these percentage-based fees is vital for preserving your investment gains and selecting cost-effective financial products.
Business Finance: Driving Profitability and Growth
For businesses, percentages are indispensable for analyzing performance, making strategic operational decisions, and communicating financial health to stakeholders. From the smallest startup to multinational corporations, percentage metrics drive the understanding of efficiency, profitability, and market position.
Profit Margins and Revenue Analysis
Profit margins are among the most critical percentage metrics for any business, indicating how much profit is generated from revenue.
- Gross Profit Margin:
((Revenue - Cost of Goods Sold) / Revenue) * 100
This tells a business what percentage of its revenue is left after covering the direct costs of producing its goods or services. A higher gross margin indicates more efficient production or better pricing power. - Net Profit Margin:
((Net Income / Revenue) * 100)
This is the ultimate bottom-line percentage, showing what portion of revenue is left after all expenses, including operating costs, interest, and taxes, have been accounted for. It’s a key indicator of overall business efficiency and profitability.
Analyzing these percentages over time and comparing them to industry benchmarks helps businesses identify trends, evaluate operational effectiveness, and pinpoint areas for improvement.
Expense Ratios and Cost Control
Just as in personal finance, businesses use percentages to control costs. Expense ratios express various operational costs as a percentage of revenue or total expenses.
- Operating Expense Ratio:
(Operating Expenses / Revenue) * 100
This metric helps businesses understand what percentage of their revenue is consumed by day-to-day operations (salaries, rent, marketing, etc.). A high or rising ratio might signal inefficiency or excessive spending. - Marketing Spend as a Percentage of Revenue: This helps businesses gauge the effectiveness of their marketing efforts relative to the sales they generate.
By scrutinizing these percentage-based ratios, management can make data-driven decisions to optimize spending, improve efficiency, and ultimately enhance profitability.
Market Share and Growth Metrics
Beyond internal performance, percentages are crucial for understanding a business’s position within its industry and its growth trajectory.
- Market Share:
(Company Sales / Total Market Sales) * 100
This percentage indicates the portion of the total market a company controls. A growing market share suggests increasing competitive strength and brand influence. - Year-over-Year Growth:
((Current Period Value - Previous Period Value) / Previous Period Value) * 100
Whether measuring revenue growth, profit growth, or customer base expansion, percentage growth rates provide a standardized way to assess a company’s performance against its past, its competitors, and market expectations.
These external-facing percentages are vital for strategic planning, investor relations, and competitive analysis, painting a clear picture of a company’s trajectory and potential.
Leveraging Financial Tools and Data
While understanding the manual calculations is fundamental, in today’s digital age, numerous tools simplify the application of percentages, making financial analysis more accessible and efficient.
Spreadsheets and Calculators
Modern spreadsheet programs like Microsoft Excel or Google Sheets are indispensable for financial analysis. They allow users to quickly perform complex percentage calculations, build dynamic budgets, model investment scenarios, and track business metrics with ease. Functions like PERCENTAGE, division, and multiplication are central to constructing robust financial models. Similarly, online percentage calculators or financial calculators embedded in banking apps can instantly provide answers to “what percent of a number is another number,” freeing up mental energy for interpretation and decision-making.
Financial Literacy as a Skill
Ultimately, the ability to interpret and apply percentages is not just a mathematical skill but a critical component of financial literacy. It empowers individuals and businesses to:
- Make informed decisions: Moving beyond gut feelings to data-driven choices.
- Identify opportunities and risks: Spotting trends in spending, investments, or market dynamics.
- Communicate effectively: Articulating financial performance or needs clearly and concisely to others, be it a bank, an investor, or family members.
- Plan for the future: Setting realistic goals for savings, retirement, or business expansion based on percentage-based projections.
Conclusion
The seemingly simple question, “what percent of a number is another number,” underpins nearly every facet of the financial world. From the micro-level decisions of personal budgeting and saving to the macro-level strategies of investment portfolios and corporate finance, percentages provide the essential framework for understanding, comparing, and projecting monetary values. They transform raw data into actionable insights, enabling individuals to take control of their financial destinies and empowering businesses to drive profitability and sustainable growth. Embracing percentage-based thinking is not merely about doing math; it’s about gaining a powerful lens through which to view and master the complex dynamics of money, ensuring clearer decisions, greater control, and a more secure financial future.
aViewFromTheCave is a participant in the Amazon Services LLC Associates Program, an affiliate advertising program designed to provide a means for sites to earn advertising fees by advertising and linking to Amazon.com. Amazon, the Amazon logo, AmazonSupply, and the AmazonSupply logo are trademarks of Amazon.com, Inc. or its affiliates. As an Amazon Associate we earn affiliate commissions from qualifying purchases.