
The Indispensable Metric: Why Percent Change Dominates Financial Analysis
In the intricate world of finance, few metrics are as ubiquitous, versatile, and fundamental as the percent change. While an absolute dollar figure tells you how much something has changed, the percent change reveals how significant that change is in relation to its starting point. It’s the magnifying glass that allows us to compare growth, decline, and volatility across vastly different scales, making it an indispensable tool for everyone from individual investors to corporate strategists and government economists.
At its core, percent change is a simple calculation:
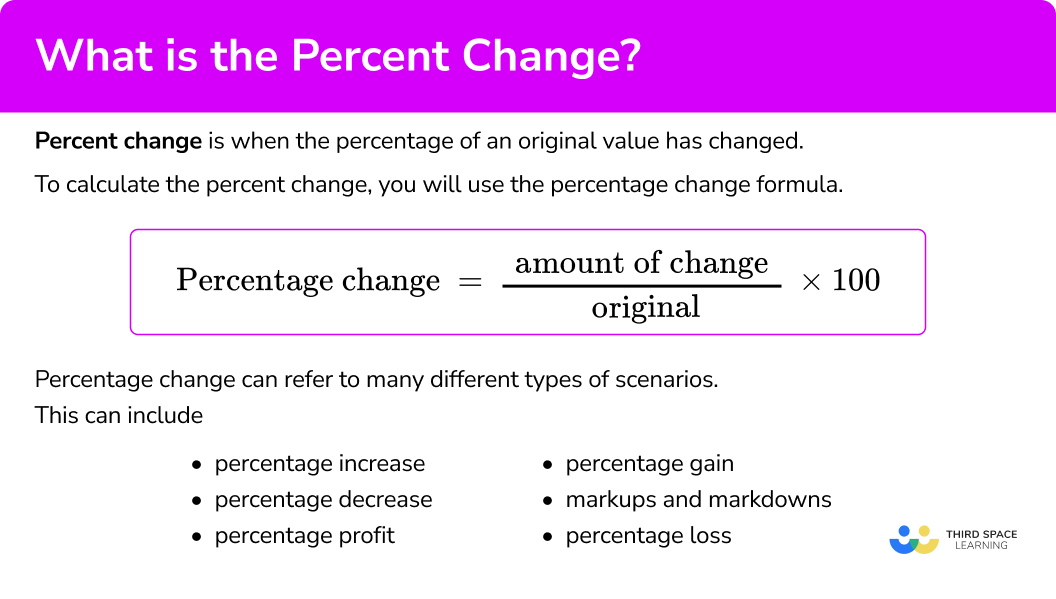
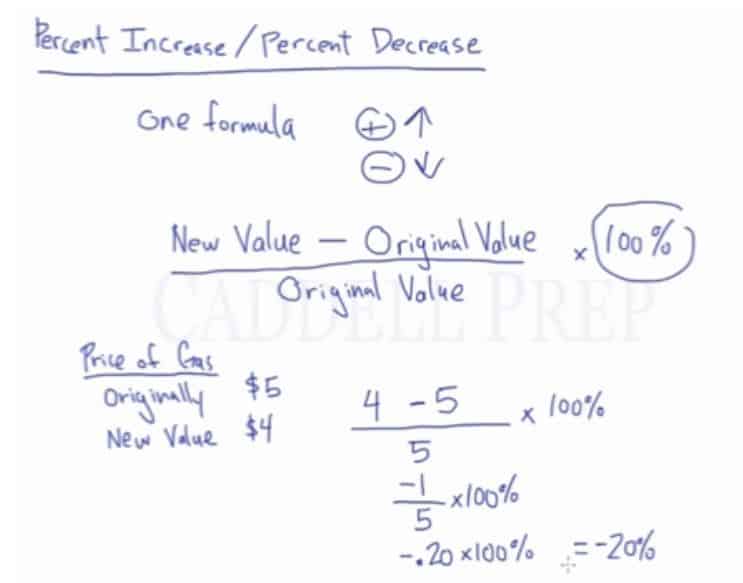
Percent Change = ((New Value - Old Value) / Old Value) * 100%
This formula transforms raw numbers into a standardized, relative measure. Consider two businesses: Company A increased its profit by $1,000, and Company B also increased its profit by $1,000. On the surface, their performance seems identical. However, if Company A’s initial profit was $5,000, its profit grew by 20%. If Company B’s initial profit was $1,000,000, its profit only grew by 0.1%. The percent change immediately highlights the dramatically different implications of the same absolute dollar increase, offering crucial context that absolute figures alone cannot provide. This inherent ability to normalize data makes percent change the lingua franca of financial reporting, enabling apples-to-apples comparisons and fostering a deeper understanding of financial trends and performance across diverse financial landscapes.
Percent Change in Personal Finance: Mastering Your Money’s Evolution
For individuals managing their personal finances, percent change isn’t just an abstract concept; it’s a practical tool for monitoring progress, identifying trends, and making informed decisions about their financial journey.
Tracking Budgetary Shifts
Understanding how your spending patterns evolve is critical for effective budgeting. Percent change allows you to track month-over-month or year-over-year fluctuations in specific spending categories. Did your utility bill jump by 15% this quarter? Has your discretionary spending on dining out decreased by 10% after implementing a new budget? These percentage shifts quickly highlight areas needing attention or celebrating success. Without this relative measure, a $50 increase in groceries might seem negligible until you realize it represents a 20% jump in your monthly food budget.
Measuring Savings and Debt Progress
When building wealth, monitoring the percentage growth of your savings accounts, investment portfolios, and retirement funds provides a clearer picture of your progress than simply looking at dollar amounts. A 7% annual growth in your savings account, for example, conveys compound interest at work. Conversely, when tackling debt, observing a 25% reduction in your credit card balance over six months is a powerful motivator, illustrating tangible progress towards financial freedom.
Income Growth and Purchasing Power
Your salary increase, typically expressed as a percentage, directly impacts your purchasing power. A 3% annual raise is a common benchmark, but understanding what that means for your take-home pay relative to inflation (also a percent change) is crucial. If your income grows by 3% but inflation is 5%, your real purchasing power has effectively declined by 2%. Percent change helps you gauge whether you’re getting ahead, staying even, or falling behind in terms of economic standing.
Setting and Achieving Financial Goals
Whether you’re saving for a down payment, a child’s education, or retirement, percent change helps quantify your proximity to your goals. Being 40% of the way to your down payment target provides a concrete, digestible milestone that an ever-increasing dollar amount might obscure. It breaks down large financial objectives into manageable, measurable steps.
Investing with Insight: Leveraging Percent Change for Portfolio Performance
In the investment world, percent change is the bedrock upon which performance is measured, risk is assessed, and strategic decisions are made. It’s the language of market fluctuations and long-term wealth creation.
Evaluating Investment Returns
The most direct application is in assessing the performance of stocks, bonds, mutual funds, ETFs, and other assets. An investor doesn’t merely care if a stock price went up by $10; they need to know if that represents a 2% gain or a 20% gain. Similarly, mutual fund managers report their returns as percentages (e.g., “The fund generated a 12% return last year”), allowing investors to compare different investment vehicles regardless of their initial investment size.

Portfolio Performance and Benchmarking
Beyond individual assets, percent change is used to calculate the overall return of an entire investment portfolio. This holistic view is vital for evaluating the effectiveness of an investment strategy. Investors frequently benchmark their portfolio’s percentage return against major market indices like the S&P 500 or Nasdaq, which are themselves reported as percent changes. If your portfolio grew by 8% while the S&P 500 grew by 10%, you underperformed the market by 2 percentage points.
The Power of Compounding
Percent change is integral to understanding compound interest and long-term wealth accumulation. A modest 7% annual return, compounded over decades, can transform a small initial investment into a substantial nest egg. The consistent application of percent change year after year is what drives exponential growth, making it a powerful concept for long-term investors.
Assessing Risk and Volatility
Market volatility, or the degree of fluctuation in an asset’s price, is often expressed through percent change. A stock that frequently sees daily swings of +/- 5% is considered more volatile than one with +/- 0.5% daily changes. Understanding these percentage movements helps investors gauge the risk profile of their holdings and make informed decisions about their risk tolerance.
Business & Economic Indicators: Percent Change as a Pulse of Progress
On a macro level, percent change serves as the primary diagnostic tool for assessing the health of individual businesses, entire industries, and national economies. It’s how stakeholders communicate growth, contraction, efficiency, and overall economic performance.
Corporate Financial Health
Businesses meticulously track percent changes in key financial metrics. Year-over-year (YOY) or quarter-over-quarter (QOQ) changes in revenue, net profit, gross margin, and operating expenses are crucial indicators. A company reporting 15% revenue growth YOY signifies expansion, while a 5% increase in Cost of Goods Sold (COGS) relative to sales might flag efficiency issues. These percentage movements guide strategic decisions, from pricing and production to staffing and investment. Market share, another critical business metric, is also often expressed as a percentage, with companies striving for positive percentage changes in their share of the total market.
Economic Performance
For economists and policymakers, percent change is the language of economic indicators:
-
Gross Domestic Product (GDP): The most fundamental measure of a nation’s economic output, GDP growth is always reported as a percent change, indicating whether the economy is expanding or contracting.
-
Inflation Rates: Measures like the Consumer Price Index (CPI) and Producer Price Index (PPI) report monthly and annual percent changes in the cost of goods and services, directly impacting purchasing power and central bank policy.
-
Interest Rates: While stated as basis points, changes in benchmark interest rates by central banks are effectively small percent changes that significantly influence borrowing costs and investment decisions throughout the economy.
-
Unemployment Rate: Changes in the percentage of the workforce without jobs reflect labor market health.
-
Retail Sales: The percentage change in retail sales offers insights into consumer spending habits, a major component of economic activity.
These percentage-based indicators paint a comprehensive picture of economic trends, allowing governments, businesses, and consumers to anticipate shifts and plan accordingly.
Navigating Nuances: The Art of Interpreting Percent Change
While powerful, interpreting percent change requires a nuanced approach. Blindly accepting a percentage figure without context can lead to misleading conclusions.
Context is King: The Importance of the Base Value
A 100% increase sounds phenomenal, but its significance varies wildly depending on the base number. A company that grew from $100,000 to $200,000 in revenue experienced a 100% increase, which is good. However, a growth from $10 million to $20 million, also a 100% increase, represents a far more substantial achievement in absolute terms. Always consider the starting point (the “Old Value”) from which the percentage is calculated.
Timeframes Matter: Annualized vs. Period-Specific
A 1% gain on an investment means very little without knowing the timeframe. Is it 1% per day, per month, or per year? Annualized returns offer a standardized way to compare performance over different periods, making a 7% annual return comparable to another investment’s 7% annual return, even if one was achieved in 5 years and the other in 10. Conversely, sudden spikes or dips might be attributed to specific, non-recurring events within a short timeframe, which should not be extrapolated as long-term trends.
The “Base Effect” Trap
A common pitfall is the “base effect.” A large percentage change can occur from a very small absolute change if the base number is tiny. For example, if a startup’s user base grows from 10 to 100, that’s a 900% increase. While impressive, it’s not the same scale as a company growing from 1 million to 1.9 million users (a 90% increase). The relative magnitudes can be deceptive. Similarly, a subsequent decline of 50% from 100 users back to 50 users looks steep, but the absolute change is still small.
Percentage Points vs. Percent Change
It’s crucial to distinguish between a change in “percentage points” and a “percent change.” If an interest rate moves from 4% to 5%, that’s an increase of 1 percentage point. However, it’s a 25% percent change relative to the original rate (((5-4)/4)*100% = 25%). Confusing these two can lead to significant misinterpretations, especially in economic discussions.
Beyond a Single Number: Holistic Analysis
Relying solely on one percent change figure can be myopic. A business might report impressive revenue growth (e.g., 20% YOY) but simultaneously show a declining profit margin (e.g., net income up only 5% YOY). This suggests that while sales are growing, the cost of generating those sales is increasing disproportionately, painting a less rosy picture than revenue alone would imply. Always analyze percent changes in conjunction with other relevant metrics and trends to form a comprehensive understanding.
In conclusion, percent change is far more than a mathematical formula; it’s a critical lens through which we interpret financial information, enabling clear comparisons, meaningful evaluations, and informed decision-making across all facets of the monetary world. However, like any powerful tool, its utility is maximized only when applied with a full understanding of its nuances and contextual implications.
aViewFromTheCave is a participant in the Amazon Services LLC Associates Program, an affiliate advertising program designed to provide a means for sites to earn advertising fees by advertising and linking to Amazon.com. Amazon, the Amazon logo, AmazonSupply, and the AmazonSupply logo are trademarks of Amazon.com, Inc. or its affiliates. As an Amazon Associate we earn affiliate commissions from qualifying purchases.