
The S&P 500 Index is arguably the most referenced benchmark for the U.S. stock market and a cornerstone of global finance. For new and experienced investors alike, understanding how to identify and track this critical index is fundamental to navigating the financial world. While the question seems simple, the S&P 500 actually has several symbols, each representing a slightly different aspect of the index or an investment vehicle tied to it. This article will demystify the various symbols associated with the S&P 500, explain their nuances, and explore why this index plays such a pivotal role in investment strategies and financial analysis, all from a purely financial perspective.
Decoding the S&P 500’s Diverse Symbols
When you ask “what is the symbol for the S&P 500 Index?”, the answer isn’t a single, monolithic ticker. Instead, there are primary symbols representing the index’s value itself, and then a suite of symbols for financial products that track its performance. Understanding these distinctions is crucial for accurate research and investment.
The Index Itself: SPX and ^GSPC
The most direct answers to the question refer to the symbols that represent the actual, real-time value of the S&P 500 Index:
-
SPX: This is the official ticker symbol used by the Chicago Board Options Exchange (CBOE) and is widely recognized in financial news, professional trading platforms, and economic reports. When you hear financial analysts discussing the “SPX,” they are referring to the underlying index value.
-
^GSPC: This symbol, often seen on popular financial data websites like Yahoo Finance and Google Finance, is another common way to track the S&P 500 Index. The caret (
^) typically denotes an index rather than an individual stock or ETF. Sometimes, you might see it simply asGSPCwithout the caret, depending on the data provider.
Both SPX and ^GSPC reflect the calculated value of the S&P 500 based on the combined market capitalization of its 500 constituent companies. They are not tradable securities themselves but rather indicators of the market’s performance.
Investing Vehicles: ETFs and Mutual Funds
While you cannot directly buy shares of the S&P 500 Index itself, you can invest in financial products designed to mirror its performance. These products, primarily Exchange Traded Funds (ETFs) and mutual funds, have their own distinct ticker symbols. This is where most individual investors will interact with “the S&P 500” in a tangible way.
Popular S&P 500 ETFs
ETFs are a popular choice for investors looking for broad market exposure at a low cost. They trade like stocks on an exchange throughout the day. Some of the most widely used S&P 500 ETFs include:
-
SPY (SPDR S&P 500 ETF Trust): Launched in 1993, SPY is the largest and oldest S&P 500 ETF. It tracks the S&P 500 Index very closely and is known for its immense liquidity, making it a favorite among institutional investors and day traders. Its expense ratio, while low, is slightly higher than some newer alternatives.
-
IVV (iShares Core S&P 500 ETF): Offered by BlackRock’s iShares, IVV is another highly popular choice. It aims to replicate the S&P 500’s performance with a slightly lower expense ratio than SPY, making it attractive for long-term buy-and-hold investors.
-
VOO (Vanguard S&P 500 ETF): Vanguard’s offering is renowned for its extremely low expense ratio, embodying Vanguard’s commitment to cost-effective investing. VOO is often favored by cost-conscious investors building diversified portfolios.
These ETFs hold shares of the underlying 500 companies in the same proportion as the index, aiming to provide returns that closely match the S&P 500’s performance before fees.
Mutual Fund Equivalents
Many mutual funds also track the S&P 500, providing another avenue for investment. These typically have higher minimum investment requirements and are bought and sold once per day at the closing net asset value (NAV). An example is the VFIAX (Vanguard 500 Index Fund Admiral Shares), which mirrors VOO’s strategy but in a mutual fund structure, often requiring a higher initial investment.
The S&P 500 Index: A Barometer of U.S. Economic Health
Beyond its symbols, understanding what the S&P 500 represents is vital for any investor. It’s not just a collection of numbers; it’s a dynamic reflection of the U.S. economy and corporate landscape.
What Constitutes the S&P 500?
The S&P 500 is a market-capitalization-weighted index comprising 500 of the largest U.S. publicly traded companies. Unlike some other indices that are rules-based, the companies within the S&P 500 are selected by a committee at S&P Dow Jones Indices. Their criteria include market capitalization (generally over $14.6 billion), liquidity, public float, sector representation, and profitability. Because it’s market-cap weighted, companies with larger market values have a greater impact on the index’s performance. This diverse group of companies spans all major sectors of the U.S. economy, from technology and finance to healthcare and consumer goods, making it a comprehensive gauge of market health.
Why Its Performance Matters
The S&P 500 is more than just an index; it’s often considered the best single gauge of large-cap U.S. equities and a bellwether for the overall U.S. stock market and economy.
-
Benchmark for Performance: Fund managers and financial advisors frequently compare their own investment performance against the S&P 500. Beating the S&P 500 is a common measure of success in active management.
-
Economic Indicator: Its movements are closely watched by economists, policymakers, and businesses as an indicator of investor confidence and economic growth. A strong S&P 500 often correlates with a healthy economy, while sustained declines can signal economic contraction.
-
Foundation for Retirement Planning: Many 401(k)s, IRAs, and other retirement accounts offer options to invest in S&P 500 index funds, making it a core component of long-term wealth building for millions.
Practical Applications for Investors: Leveraging the S&P 500
Understanding the S&P 500’s symbols and its fundamental role empowers investors to make informed decisions, whether tracking market performance or building a robust portfolio.
Tracking Market Performance
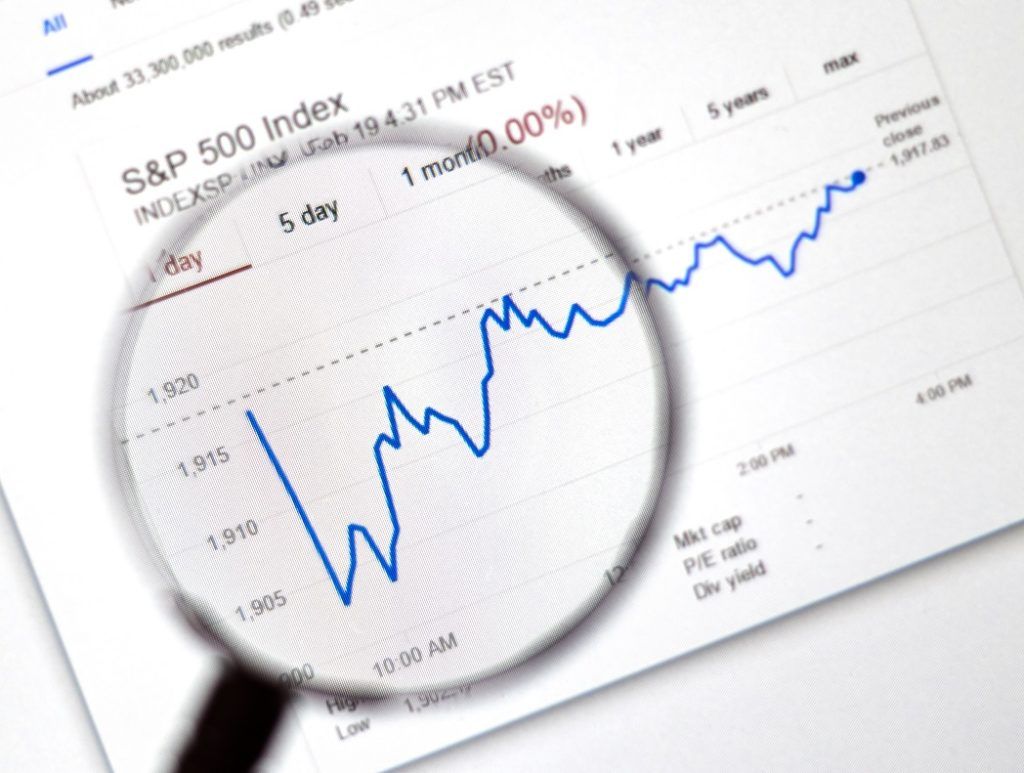
Investors use symbols like SPX or ^GSPC on financial websites, trading platforms, or news feeds to monitor the real-time pulse of the market. This allows them to quickly assess whether the broader market is up or down, providing context for individual stock performance or overall portfolio health. It’s the go-to reference point for daily market summaries.
Core Portfolio Holdings
For many, investing in S&P 500 tracking ETFs or mutual funds forms the backbone of their investment strategy. Passive investing in a low-cost S&P 500 fund allows investors to:
-
Gain Broad Diversification: Instantly own a small piece of 500 leading U.S. companies, significantly reducing company-specific risk compared to holding just a few individual stocks.
-
Achieve Market Returns: Historically, the S&P 500 has provided strong long-term returns, averaging around 10-12% annually, though past performance is not indicative of future results.
-
Minimize Costs: The low expense ratios of funds like VOO and IVV mean more of an investor’s money works for them, compounding over time.
-
Embrace Dollar-Cost Averaging: Regularly investing a fixed amount into an S&P 500 fund, regardless of market fluctuations, is a proven strategy to mitigate risk and build wealth consistently.
Advanced Strategies and Derivatives
For sophisticated investors and traders, the S&P 500 also serves as the underlying asset for a variety of derivatives:
-
Futures Contracts: The E-mini S&P 500 futures contract (
ES) is one of the most actively traded equity index futures in the world. It allows traders to speculate on or hedge against the future price movements of the S&P 500 index. -
Options Contracts: Options on
SPXand on S&P 500 ETFs (likeSPYoptions) enable investors to implement complex strategies for hedging, income generation, or leveraged speculation, appealing to those with a higher risk tolerance and deeper market understanding.
Key Considerations Beyond the Ticker Symbol
While the S&P 500 offers compelling advantages, it’s essential for investors to understand its limitations and key considerations for sound financial planning.
Diversification and Limitations
While the S&P 500 provides excellent diversification across large-cap U.S. equities, it is not a universally diversified portfolio. It has no exposure to:
-
International Markets: It’s exclusively U.S.-focused.
-
Small-Cap or Mid-Cap Companies: It only includes large-cap firms.
-
Bonds or Other Asset Classes: It’s purely equity-based.
For true diversification and risk management, investors should consider adding international stocks, small-cap funds, bonds, and potentially alternative investments to their portfolios, depending on their financial goals and risk tolerance.
Expense Ratios and Costs
The power of compounding is significantly impacted by fees. The beauty of S&P 500 index funds and ETFs lies in their typically ultra-low expense ratios (often 0.03% to 0.09%). Over decades, even a difference of 0.5% in expense ratios can translate into tens or hundreds of thousands of dollars in lost returns. Always prioritize low-cost options when investing in broad market indices.
Long-Term Perspective and Volatility
The S&P 500 has demonstrated remarkable resilience and growth over the long term. However, it is prone to short-term volatility, experiencing significant drawdowns during market corrections or recessions. Investors should approach S&P 500 investing with a long-term mindset (ideally 5-10 years or more) to ride out these fluctuations and benefit from the market’s historical upward trend. Panic selling during downturns can severely undermine long-term returns.
Finding and Interpreting S&P 500 Data
Accessing and understanding S&P 500 data is straightforward thanks to numerous financial platforms.
Essential Financial Platforms
You can find current and historical data for the S&P 500 (using SPX, ^GSPC, SPY, IVV, or VOO) on:
-
Financial News Websites: Bloomberg, Reuters, The Wall Street Journal, CNBC.
-
Financial Data Aggregators: Yahoo Finance, Google Finance, Investing.com.
-
Brokerage Platforms: Your online brokerage account (e.g., Fidelity, Schwab, Vanguard, E*TRADE) will have robust charting and data analysis tools.

What Data Points to Focus On
When looking up the S&P 500, pay attention to:
-
Current Price/Index Value: The most recent trading price or calculated value.
-
Daily Change and Percentage Change: How much the index has moved up or down today.
-
Volume (for ETFs): For ETFs like SPY, high trading volume indicates liquidity.
-
Historical Charts: Analyze performance over different timeframes (1-day, 5-day, 1-month, 1-year, 5-year, Max).
-
News and Analysis: Stay informed about factors influencing market movements.
In conclusion, understanding the various symbols associated with the S&P 500 Index is the first practical step toward leveraging this powerful and accessible investment vehicle. Whether you’re tracking SPX for market sentiment or investing in VOO for long-term growth, the S&P 500 remains a cornerstone of informed financial decisions and a vital component in building a well-rounded and resilient investment strategy.