
The question “What is the S&P at?” is far more profound than a simple query for a real-time stock quote. It’s a gateway into understanding the pulse of the U.S. economy, the health of its largest corporations, and the collective sentiment of investors worldwide. For anyone engaged in personal finance, investing, or even simply observing the broader economic landscape, the S&P 500 index serves as a critical barometer. This article delves into the significance of the S&P 500, how to interpret its movements, the factors that drive its performance, and its indispensable role in investment strategies for individuals and institutions alike.
Understanding the S&P 500: More Than Just a Number
To truly grasp the implications of “what the S&P is at,” one must first understand what the index represents. It is not merely a collection of stocks but a meticulously constructed representation of market performance, a benchmark that shapes investment decisions globally.
The Benchmark of U.S. Large-Cap Stocks
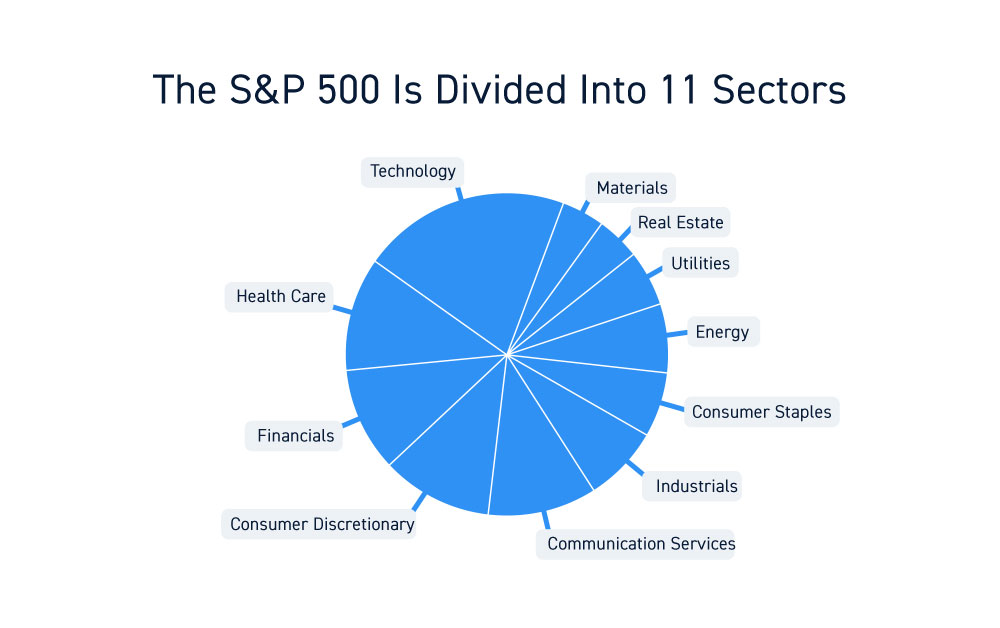
The S&P 500, short for the Standard & Poor’s 500, is a stock market index that represents 500 of the largest publicly traded companies in the United States. These companies are selected by a committee at S&P Dow Jones Indices based on criteria such as market size, liquidity, public float, and sector representation. While 500 companies might seem like a small fraction of the thousands listed on U.S. exchanges, these firms collectively account for approximately 80% of the total market capitalization of the U.S. equity market. This makes the S&P 500 an exceptionally accurate reflection of the overall health and direction of the U.S. stock market.
The inclusion of a company in the S&P 500 is prestigious, often seen as a mark of a company’s financial strength and stability. These are the giants of industry – technology innovators, financial powerhouses, consumer goods titans, and healthcare leaders – whose combined performance paints a comprehensive picture of American corporate success.
How the Index is Constructed
The S&P 500 is a market-capitalization-weighted index. This means that companies with larger market values have a greater impact on the index’s performance than those with smaller market values. For example, a 1% change in the stock price of a colossal company like Apple or Microsoft will have a much more significant effect on the S&P 500’s overall movement than a 1% change in a smaller company within the index. This weighting methodology ensures that the index accurately reflects the actual value distribution within the market, emphasizing the performance of the most influential companies. The methodology also accounts for “free float,” meaning it only considers shares that are readily available for trading, excluding those held by insiders or restricted shareholders. This enhances its accuracy as a gauge of investable market performance.
Why the S&P 500 Matters to Investors
For investors, the S&P 500 is more than an indicator; it’s a primary benchmark. Professional fund managers are often judged by how their portfolios perform relative to the S&P 500. If an active fund manager consistently underperforms the S&P 500, investors might question the value of the fees they are paying. For passive investors, the S&P 500 often serves as the target itself, with many exchange-traded funds (ETFs) and mutual funds designed to simply track its performance.
Moreover, the S&P 500 provides crucial context. When you hear financial news outlets report that “the market is up” or “the market is down,” they are almost invariably referring to the S&P 500’s performance. It sets the baseline for understanding broader economic trends and investor sentiment, making its current level a fundamental piece of information for anyone navigating the financial world.
Tracking the S&P 500’s Current Status
Knowing what the S&P 500 is at any given moment involves understanding where to find the data and how to interpret its daily movements and underlying metrics. This real-time awareness is key for tactical decisions and strategic planning.
Where to Find Real-Time Data
In today’s interconnected financial world, real-time S&P 500 data is readily accessible. Most major financial news websites (e.g., Bloomberg, Reuters, Wall Street Journal, Yahoo Finance, Google Finance) provide live quotes. Stock trading platforms and brokerage accounts also offer direct access to real-time index values and charting tools. Specialized data providers like TradingView or Investing.com offer even more in-depth technical analysis capabilities. When looking at the current value, pay attention not only to the absolute number but also to the daily change (in points and percentage) and the time of the last update to ensure you have the most current information. The S&P 500 is primarily tracked during U.S. market hours (9:30 AM to 4:00 PM Eastern Time, Monday to Friday), though futures contracts provide a glimpse into after-hours and pre-market sentiment.
Interpreting Daily Fluctuations
The S&P 500’s value fluctuates constantly throughout the trading day. These daily movements can be influenced by a myriad of factors, ranging from company-specific news (like earnings reports from one of its component firms) to broader macroeconomic announcements. A rise in the index typically signals investor optimism and economic strength, while a fall suggests apprehension or weakening conditions. It’s crucial, however, to avoid overreacting to short-term volatility. Daily swings, even significant ones, are a normal part of market behavior. A long-term perspective is often more valuable than focusing on intraday highs and lows, especially for investors with long-term financial goals. Contextualizing these daily movements within weekly, monthly, and yearly trends provides a more accurate picture of the market’s trajectory.
Key Metrics Beyond the Price Level
While the headline S&P 500 number is the most visible metric, several other indicators offer deeper insights into the index’s valuation and potential future performance:
- P/E Ratio (Price-to-Earnings Ratio): This compares the index’s current price to the aggregated earnings per share of its constituent companies. A high P/E ratio can suggest that the market is optimistic about future earnings growth, but it can also signal that the index is “expensive” or potentially overvalued. Conversely, a low P/E might indicate undervaluation or investor pessimism.
- Dividend Yield: This metric represents the total annual dividends paid by the S&P 500 companies as a percentage of the index’s price. It provides insight into the income generation potential of the index and can be compared against bond yields or historical averages to assess relative attractiveness.
- Volatility Index (VIX): Often called the “fear index,” the VIX measures the market’s expectation of future volatility based on S&P 500 option prices. A high VIX suggests investor uncertainty and potential for sharp market swings, while a low VIX indicates relative calm. Monitoring the VIX can provide clues about market sentiment.
- Earnings Growth: The aggregate earnings growth of the S&P 500 companies is a fundamental driver of its performance. Strong, consistent earnings growth supports higher valuations, while slowing or declining earnings can put downward pressure on the index.
Factors Influencing the S&P 500’s Performance
The S&P 500 is a complex system, a reflection of countless decisions and events. Its movements are rarely attributable to a single cause but rather a confluence of economic, corporate, and global forces. Understanding these drivers is essential for any informed investor.
Macroeconomic Indicators
Broad economic data plays a pivotal role in shaping the S&P 500’s trajectory:

- Inflation and Interest Rates: The Federal Reserve’s monetary policy, particularly changes in interest rates, has a direct impact. Higher interest rates typically make borrowing more expensive for companies and consumers, potentially slowing economic growth and reducing corporate profits. They also make “safer” investments like bonds more attractive, drawing capital away from stocks. Conversely, lower rates can stimulate economic activity and boost stock valuations. Inflation, if unchecked, erodes purchasing power and corporate margins, creating headwinds for the market.
- GDP Growth: Gross Domestic Product (GDP) is the primary measure of a country’s economic output. Robust GDP growth often translates to higher corporate earnings and increased consumer spending, generally positive for the S&P 500. Economic contractions or slowdowns tend to have the opposite effect.
- Employment Data: Key employment figures, such as the unemployment rate, non-farm payrolls, and wage growth, provide insights into consumer health and economic momentum. A strong job market signals consumer confidence and spending capacity, which fuels corporate revenue.
Corporate Earnings and Guidance
At its core, the stock market is driven by corporate profitability. The S&P 500 reacts significantly to the aggregate earnings reports of its constituent companies. Strong earnings growth, especially when it beats analyst expectations, tends to propel the index higher. Equally important is “guidance” – the projections companies offer for their future earnings and revenues. Positive guidance indicates management’s confidence and can reassure investors, while conservative or lowered guidance can trigger sell-offs, even if current earnings are solid. Sector-specific earnings trends within the S&P 500 also matter; for instance, strong tech earnings can lift the entire index due to the sector’s heavy weighting.
Geopolitical Events and Market Sentiment
Global events, from political instability and trade wars to pandemics and natural disasters, can introduce significant uncertainty into the markets. Such events often trigger periods of increased volatility as investors try to price in potential economic disruptions or shifts in policy. Wars, diplomatic tensions, or major international crises can lead to sharp market declines as risk aversion increases. Conversely, resolutions to conflicts or significant international agreements can spark rallies. Market sentiment, the collective psychological state of investors, can amplify these reactions, sometimes leading to irrational exuberance or panic selling that isn’t fully justified by underlying fundamentals.
Technological Advancements and Sectoral Shifts
Innovation is a constant force reshaping the economy and, consequently, the S&P 500. Breakthroughs in technology can lead to the rise of new industries and the decline of old ones. For example, the massive growth of the technology sector over the past few decades has given it a dominant weighting in the S&P 500, making its performance particularly sensitive to tech trends. Shifts in consumer preferences, regulatory environments, or energy policies can also lead to significant reallocations of capital across different sectors, influencing which companies thrive and which struggle within the index.
Investing in the S&P 500: Strategies and Considerations
For many investors, simply understanding “what the S&P is at” isn’t enough; they want to participate in its growth. Investing in the S&P 500 offers a diversified and often cost-effective way to gain exposure to the U.S. large-cap market.
ETFs and Mutual Funds Tracking the Index
The most common and accessible way to invest in the S&P 500 is through index funds, specifically Exchange-Traded Funds (ETFs) or mutual funds. These funds hold all 500 stocks in the S&P 500 in the same proportion as the index itself, effectively mirroring its performance. Popular examples include the SPDR S&P 500 ETF Trust (SPY), iShares Core S&P 500 ETF (IVV), and Vanguard S&P 500 ETF (VOO), among others. These funds offer instant diversification across 500 companies with a single purchase, typically at very low expense ratios, making them an attractive option for both novice and experienced investors seeking broad market exposure without the need for individual stock selection.
Dollar-Cost Averaging into the S&P 500
A highly recommended strategy for investing in the S&P 500, particularly for long-term goals, is dollar-cost averaging. This involves investing a fixed amount of money at regular intervals (e.g., monthly or quarterly), regardless of the index’s current price. When the S&P 500 is “high,” your fixed investment buys fewer shares of the index fund; when it’s “low,” your investment buys more shares. Over time, this strategy averages out your purchase price, reduces the risk associated with timing the market, and can lead to significant accumulation of wealth. It removes emotion from investing and promotes disciplined saving.
The Long-Term Perspective: Historical Returns and Future Outlook
Historically, the S&P 500 has demonstrated a strong upward trend over the long term, despite numerous short-term corrections and bear markets. Since its inception, the average annual return of the S&P 500 (including dividends) has been approximately 10-12%. While past performance is no guarantee of future results, this historical data underscores the power of compounding and the resilience of the U.S. economy. Investors looking at the S&P 500 should maintain a long-term outlook, typically 10 years or more, to ride out market volatility and benefit from the index’s long-term growth potential. The future outlook remains tied to innovation, corporate profitability, and global economic stability, with many analysts projecting continued, albeit not always smooth, growth.
Risks and Diversification
While the S&P 500 offers significant diversification across large-cap U.S. companies, it is not without risk. It represents a single asset class (equities) and is heavily weighted towards a few sectors (e.g., technology). A significant downturn in the U.S. economy or within those dominant sectors can still impact the index profoundly. Therefore, for true diversification, investors should consider allocating portions of their portfolio to other asset classes such as international stocks, bonds, real estate, and commodities. This broader diversification can help mitigate risk and provide more stable returns across different market conditions, even while maintaining a core S&P 500 position.
The S&P 500 and Your Financial Goals
The S&P 500 serves as more than just an investment vehicle; it’s a critical component in understanding and planning for one’s financial future. Its movements and long-term trends provide insights essential for personal finance.
A Barometer for Economic Health
As a leading indicator of large-cap corporate performance, the S&P 500 is often cited as a barometer for the broader U.S. economy. A strong, rising S&P 500 often correlates with a healthy economy, growing corporate profits, and investor confidence. Conversely, a prolonged decline in the index can signal an impending recession or significant economic headwinds. For individuals planning their careers, assessing job market prospects, or considering major purchases, observing the S&P 500 can offer valuable context on the prevailing economic climate. It’s a key piece of information that filters down to almost every aspect of financial life.
Integrating the S&P 500 into a Balanced Portfolio
For most long-term investors, an S&P 500 index fund forms a cornerstone of a balanced investment portfolio. Its broad diversification, historical returns, and low cost make it an ideal core holding. The proportion of an S&P 500 allocation will vary based on an individual’s age, risk tolerance, and financial goals. Younger investors with a long time horizon might allocate a larger percentage to S&P 500-tracking funds, while those closer to retirement might shift towards a more conservative mix including more bonds and less volatile assets. The S&P 500 provides the growth engine for many retirement accounts, college savings plans, and other long-term wealth accumulation strategies.

Beyond the Index: Active vs. Passive Investing
The availability and success of S&P 500 index funds have fueled the ongoing debate between active and passive investing. Passive investing, which involves simply tracking an index like the S&P 500, typically offers lower fees and often outperforms a majority of actively managed funds over the long run due to its simplicity and cost efficiency. Active investing, on the other hand, involves professional managers attempting to beat the market through stock picking and market timing. While some active managers succeed, it’s statistically challenging to consistently outperform a broad, diversified index like the S&P 500 after accounting for fees. Understanding “what the S&P is at” and its historical performance helps investors make informed choices about whether to simply track the market or seek out active strategies, weighing the potential for higher returns against increased risk and fees.
In conclusion, “What is the S&P at?” is a question laden with significance for anyone navigating the financial world. It points to the current valuation of America’s corporate giants, reflects the mood of the market, and offers a crucial data point for both strategic investment and economic analysis. By understanding its structure, drivers, and investment implications, individuals can make more informed financial decisions, build robust portfolios, and stay connected to the ongoing narrative of the global economy.
aViewFromTheCave is a participant in the Amazon Services LLC Associates Program, an affiliate advertising program designed to provide a means for sites to earn advertising fees by advertising and linking to Amazon.com. Amazon, the Amazon logo, AmazonSupply, and the AmazonSupply logo are trademarks of Amazon.com, Inc. or its affiliates. As an Amazon Associate we earn affiliate commissions from qualifying purchases.