
The S&P 500 is more than just a list of the 500 largest publicly traded companies in the United States; it is the definitive barometer of the American economy and the primary benchmark for global equity markets. Right now, the index stands at a critical juncture, characterized by record-breaking valuations, high concentration in technology stocks, and a complex macroeconomic environment defined by shifting interest rate expectations and the transformative potential of artificial intelligence.
To understand what the S&P 500 is right now, one must look beyond the daily price fluctuations and examine the underlying fundamentals that drive its movement. It is currently a tale of two markets: a handful of mega-cap technology firms driving the lion’s share of gains, and the remaining hundreds of companies navigating a landscape of cooling inflation and resilient consumer spending.
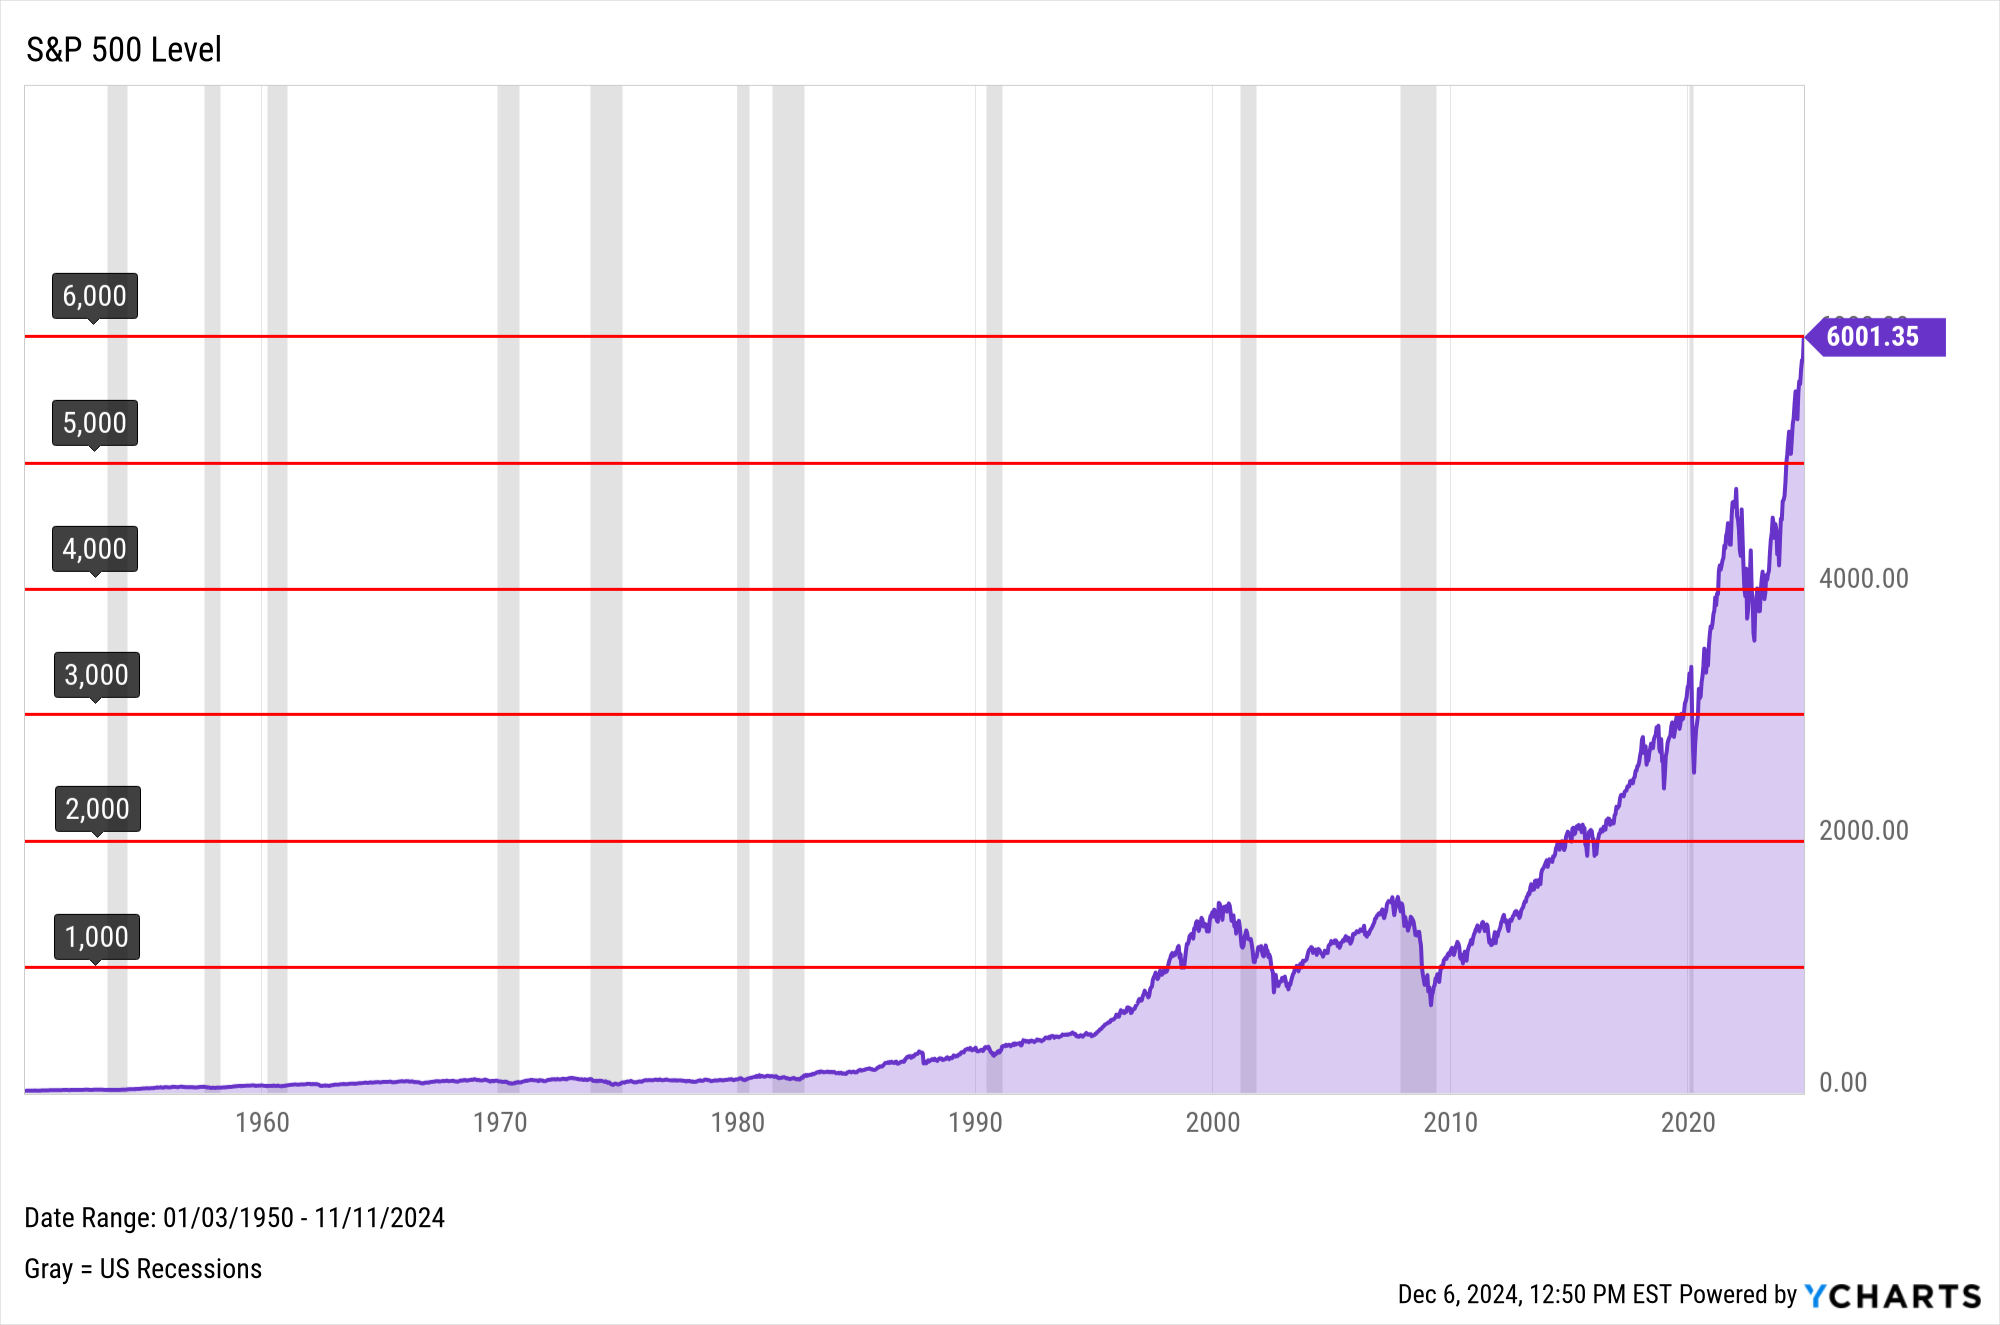
Understanding the Current Pulse of the Benchmark Index
At its core, the S&P 500 is a market-capitalization-weighted index. This means that the larger a company’s market value, the more influence it has on the index’s performance. Right now, this weighting mechanism is more relevant than ever. The index represents approximately 80% of the total available market value of the U.S. stock market, serving as the core holding for millions of retirement accounts and institutional portfolios.
The Composition: Why “The 500” Is More Than Just 500 Companies
While the name suggests exactly 500 companies, the index often contains slightly more (currently 503) due to multiple share classes for certain corporations. The selection process is governed by a committee at S&P Dow Jones Indices, which evaluates companies based on liquidity, public float, and—crucially—profitability. To be added today, a company must have positive earnings over the most recent quarter and the sum of the previous four quarters. This “quality filter” is why the S&P 500 often outperforms broader market indices during periods of economic stress.
Market Cap Weighting and the Concentration Risk
Right now, the S&P 500 is experiencing a period of historic concentration. The top ten holdings—led by names like Microsoft, Apple, NVIDIA, and Amazon—account for a significant percentage of the total index. This concentration means that the “average” stock in the index may not be performing as well as the headline number suggests. Investors often look at the “Equal Weight S&P 500” to gauge the health of the broader market. When the standard index significantly outperforms the equal-weight version, as it has recently, it indicates that the market’s gains are being driven by a narrow group of leaders rather than broad-based participation.
Valuations and Earnings: Is the Market Overextended?
When assessing what the S&P 500 is right now, valuation is the most discussed metric among analysts. Valuation tells us how much investors are willing to pay for every dollar of corporate earnings. Currently, the index is trading at a premium compared to its historical averages, sparking a debate between those who see a “bubble” and those who see a “new normal” driven by high-growth technology.
The Price-to-Earnings (P/E) Ratio Today
The Forward P/E ratio—which compares the current price to estimated earnings for the next 12 months—is a primary tool for market timing and sentiment analysis. Right now, the S&P 500’s Forward P/E is hovering well above its 10-year and 25-year averages. Historically, the index averages around 16x to 17x forward earnings. Recently, it has pushed toward 20x and beyond. While this suggests the market is expensive, high valuations can persist for years if earnings growth continues to justify the optimism.
Corporate Earnings Growth as a Tailwind
The saving grace for high valuations is the resilience of corporate earnings. Despite concerns about a potential recession over the past year, S&P 500 companies have largely reported robust profit margins. The “Right Now” of the market is defined by “Earnings Quality.” Companies have successfully passed on higher costs to consumers, and many have implemented aggressive cost-cutting measures, including layoffs in the tech sector, to protect their bottom lines. As long as earnings continue to grow at a double-digit pace, the market can support higher-than-average P/E ratios.
Macroeconomic Factors Shaping the S&P 500

No index exists in a vacuum. The S&P 500 is currently being tugged in different directions by macroeconomic forces, most notably the Federal Reserve’s monetary policy and the state of the American consumer.
Interest Rates and the Federal Reserve’s Influence
The phrase “Don’t fight the Fed” is a staple of Wall Street wisdom. Right now, the S&P 500 is hypersensitive to the Federal Reserve’s stance on interest rates. After a period of aggressive rate hikes to combat inflation, the market is currently in a “wait and see” phase. Lower interest rates generally benefit the S&P 500 in two ways: they lower the cost of borrowing for companies and they make the future cash flows of growth stocks more valuable in today’s dollars. The current volatility in the index is often a direct reaction to Consumer Price Index (CPI) reports or comments from Fed officials regarding the timing of potential rate cuts.
Inflation and Consumer Resilience
Inflation is the “invisible hand” affecting the S&P 500 right now. While inflation has cooled significantly from its 2022 peaks, it remains a shadow over the market. However, the American consumer has remained surprisingly resilient. Since consumer spending accounts for roughly 70% of the U.S. GDP, the strength of the labor market and retail sales is a fundamental pillar supporting the S&P 500. As long as unemployment stays low, the companies within the S&P 500—particularly those in the Consumer Discretionary and Staples sectors—have a solid foundation for revenue growth.
The Role of Technology and AI in Driving the Index
It is impossible to describe the S&P 500 right now without discussing the Artificial Intelligence (AI) revolution. Technology has become the dominant sector of the index, representing over 30% of its total weight. This shift has changed the very nature of the benchmark from a diversified industrial and financial basket to a growth-oriented tech powerhouse.
The Artificial Intelligence Supercycle
We are currently in what many analysts call an “AI Supercycle.” Companies involved in the production of semiconductors, cloud computing infrastructure, and software integration are seeing unprecedented demand. This has led to a “Gold Rush” mentality where investors are piling into S&P 500 tech giants that are perceived as the primary beneficiaries of AI. This enthusiasm is the primary engine behind the index’s recent all-time highs. However, it also creates a risk: if the promised productivity gains from AI do not materialize in corporate earnings soon, the index could face a significant correction.
Sector Diversification vs. Concentration Risks
While Tech leads the way, other sectors in the S&P 500 offer a different narrative. The Financials sector is navigating a landscape of higher interest margins but increased loan-loss provisions. Energy companies are fluctuating based on geopolitical tensions and global demand. Healthcare remains a defensive play, offering stability when the tech-heavy parts of the index become too volatile. Right now, a truly informed view of the S&P 500 requires looking at these “under the hood” sectors, which provide the necessary balance to the high-flying tech names.
Strategic Outlook: Navigating the S&P 500 for the Long Term
For the individual investor, the question of “what is the S&P 500 right now” usually translates to “should I be buying right now?” The answer depends on one’s time horizon and risk tolerance, but the historical data offers a compelling guide.
Dollar-Cost Averaging in High-Valuation Environments
Since the S&P 500 is currently trading near historical highs, some investors are hesitant to put new capital to work. However, history shows that the market spends a significant amount of time at or near all-time highs during bull markets. A common strategy right now is Dollar-Cost Averaging (DCA)—investing a fixed amount of money at regular intervals. This approach mitigates the risk of “buying the top” by ensuring that an investor buys more shares when prices are low and fewer when prices are high.
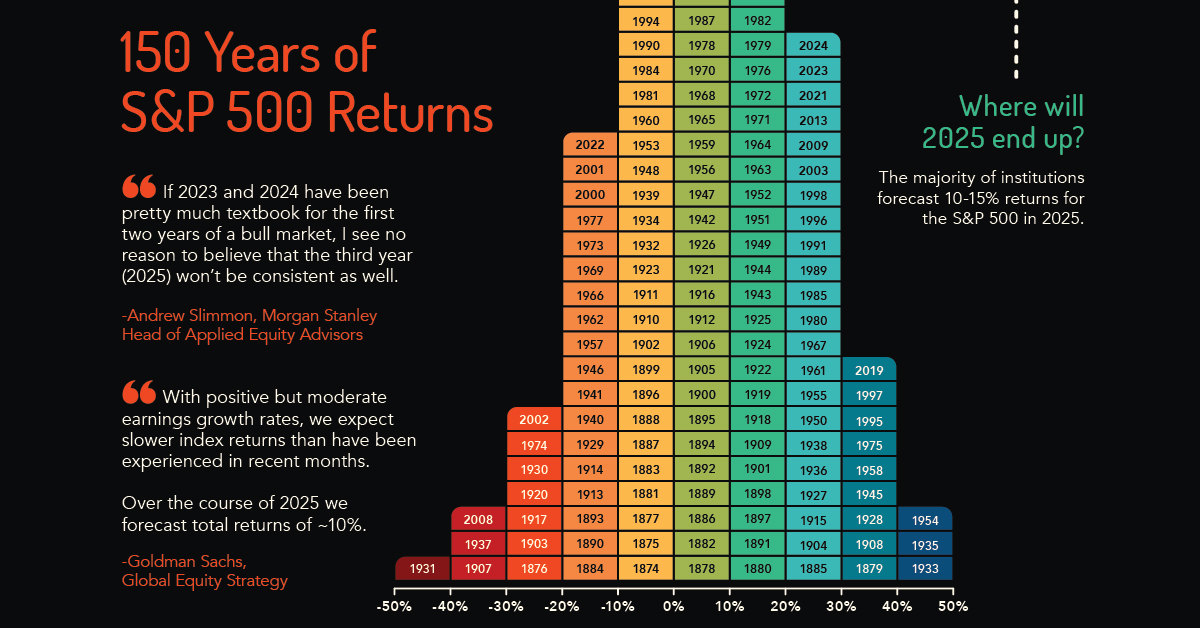
The Importance of a Long-Term Perspective
Despite the noise of inflation, interest rates, and AI hype, the S&P 500 right now remains one of the most effective wealth-building tools in history. Over long periods—typically 10 to 20 years—the index has provided an annualized return of approximately 10% (including reinvested dividends). While the “right now” may feel uncertain or overvalued, the long-term trajectory of the 500 most profitable companies in the world has historically been upward.
In conclusion, the S&P 500 right now is a high-octane, tech-heavy index that reflects an economy in transition. It is expensive by historical standards, yet backed by record earnings and a revolutionary technological shift. For the disciplined investor, it remains the ultimate benchmark of corporate excellence and economic progress, requiring both a keen eye on current macro trends and a steadfast commitment to long-term growth.
aViewFromTheCave is a participant in the Amazon Services LLC Associates Program, an affiliate advertising program designed to provide a means for sites to earn advertising fees by advertising and linking to Amazon.com. Amazon, the Amazon logo, AmazonSupply, and the AmazonSupply logo are trademarks of Amazon.com, Inc. or its affiliates. As an Amazon Associate we earn affiliate commissions from qualifying purchases.