
For anyone looking to build long-term wealth, the S&P 500 is often cited as the gold standard of investment performance. It is the most frequently referenced benchmark in the financial world, representing the 500 largest publicly traded companies in the United States. When investors ask, “What is the S&P 500 average annual return?” they are usually looking for a baseline to compare their own portfolios or to project how much they might have in retirement.
The short answer is that the historical average annual return of the S&P 500 is approximately 10% to 10.5% since its inception in its current form in 1957. However, that single number hides a vast amount of complexity, volatility, and nuance. Understanding how that return is calculated, the impact of inflation, and the difference between “average” and “actual” returns is essential for any serious investor.
The Historical Performance of the S&P 500
The S&P 500 was introduced in 1957, though the index has roots dating back further through its predecessor. Since its official launch, the index has weathered recessions, world conflicts, technological revolutions, and global pandemics. Despite these disruptions, the trajectory has been remarkably consistent over the long term.
From 1957 through the end of 2023, the average annual return has hovered around the 10% mark. If you look back even further to the early 20th century using reconstructed data, the figure remains strikingly similar. This consistency is why many financial planners use the 7% to 10% range when modeling future growth for client portfolios.
The Power of Compounding
To understand the significance of a 10% return, one must understand compound interest. Compounding occurs when the earnings on your investment begin to earn their own earnings. At a 10% annual return, an investment doubles roughly every seven years (based on the Rule of 72). For an investor who starts early, this exponential growth can turn modest monthly contributions into a multi-million-dollar nest egg over a 30- or 40-year career.
Total Return vs. Price Return
When discussing the S&P 500’s performance, it is vital to distinguish between price return and total return. The price return only accounts for the change in the stock prices of the 500 companies. The total return includes the reinvestment of dividends. Because many companies in the S&P 500 pay regular dividends, the total return is significantly higher than the price return over long periods. Historically, dividends have accounted for nearly one-third of the total return of the S&P 500. For an investor seeking to maximize wealth, choosing a “total return” strategy—where dividends are automatically reinvested—is crucial.
Nominal vs. Real Returns: The Impact of Inflation
While a 10% average annual return sounds impressive, it is a “nominal” figure. It does not account for the eroding power of inflation. To understand the actual purchasing power gained from an investment, one must look at the “real” return.
Inflation historically averages around 2% to 3% per year in the United States. When you subtract inflation from the 10% nominal return, the real average annual return of the S&P 500 is closer to 7%.
Why Real Returns Matter for Financial Planning
If you are planning for a retirement that is 30 years away, you cannot assume that $1 million today will buy the same amount of goods and services in three decades. By focusing on the 7% real return, investors can get a more accurate picture of their future standard of living. For example, if you invest $10,000 today, a 10% nominal return would suggest you have roughly $174,000 in 30 years. However, in terms of today’s “real” purchasing power, using a 7% return suggests you would have about $76,000. While still a significant gain, it provides a much more grounded expectation for long-term budgeting.
The Volatility Factor
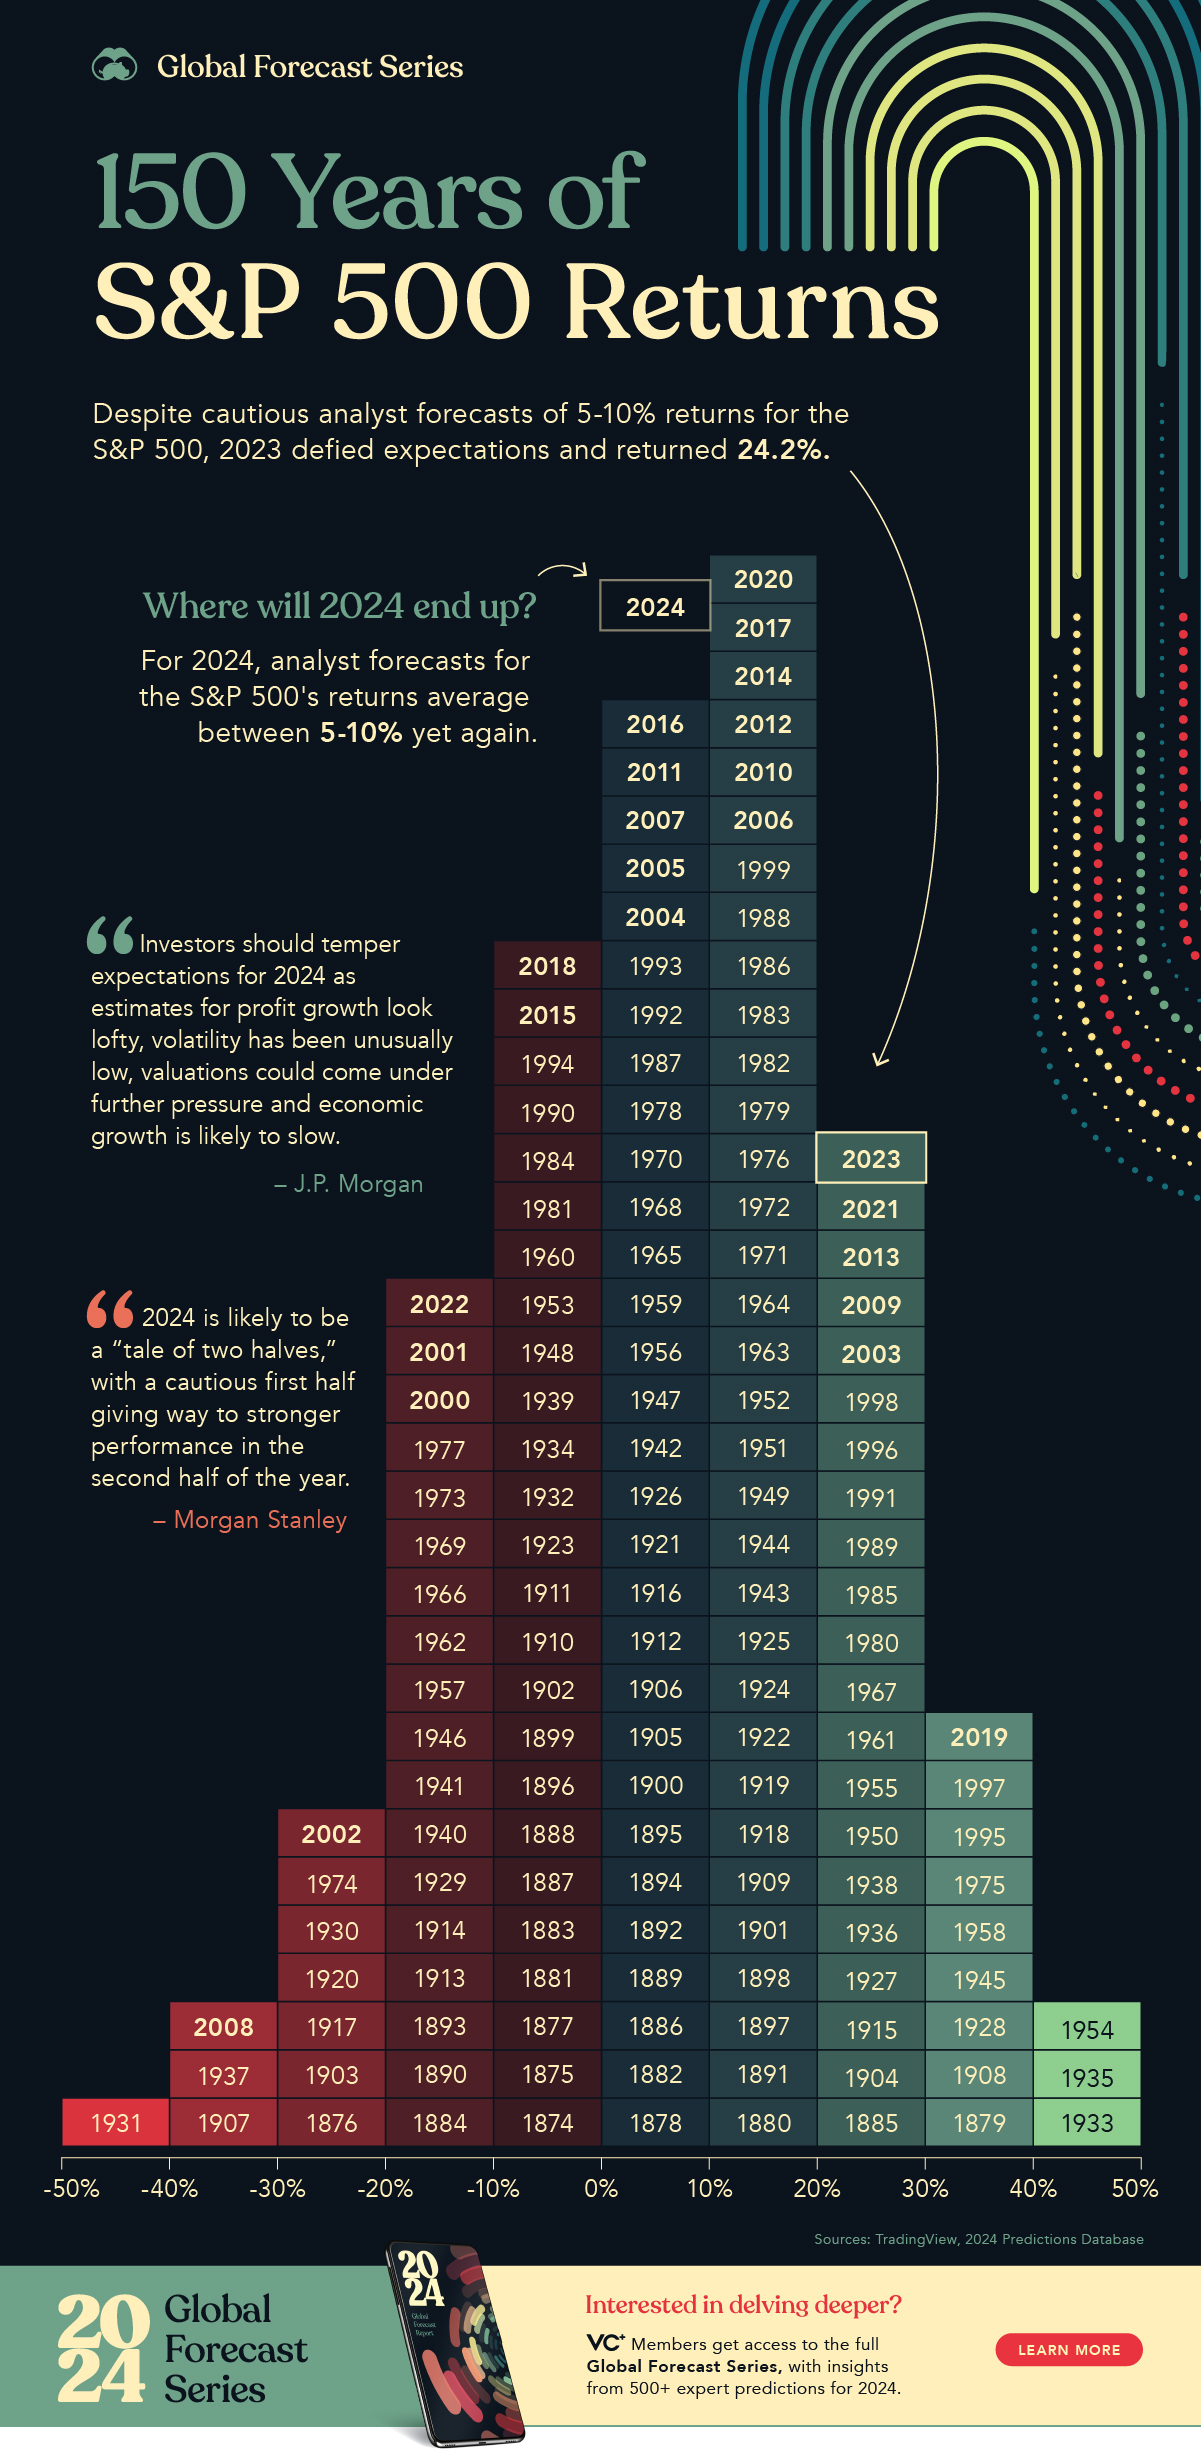
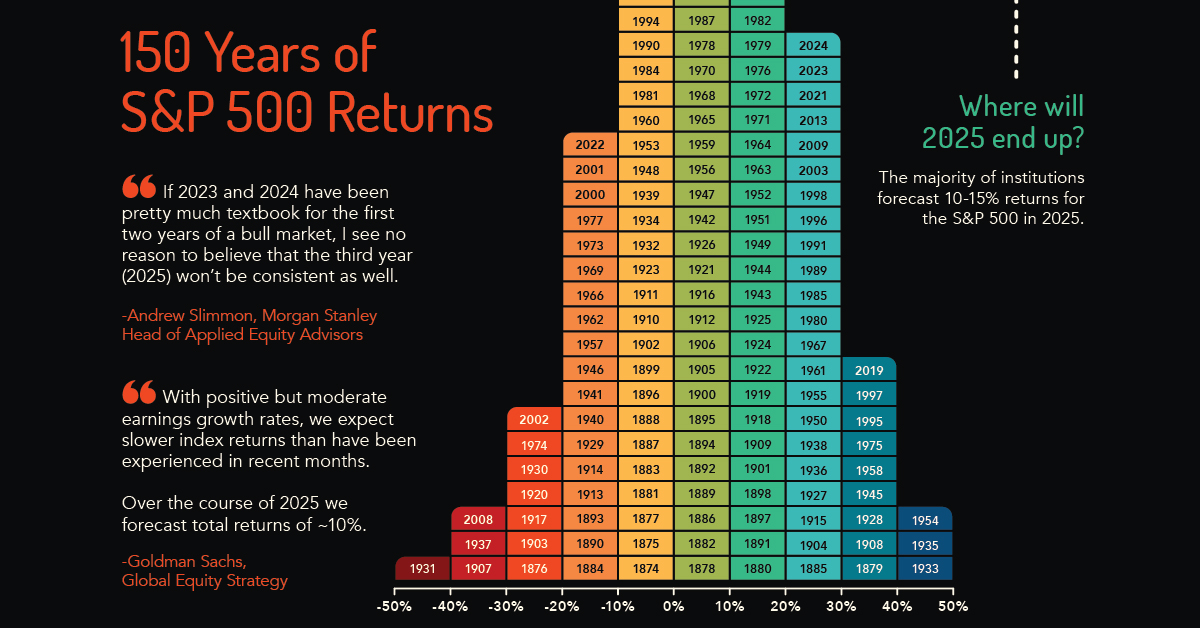
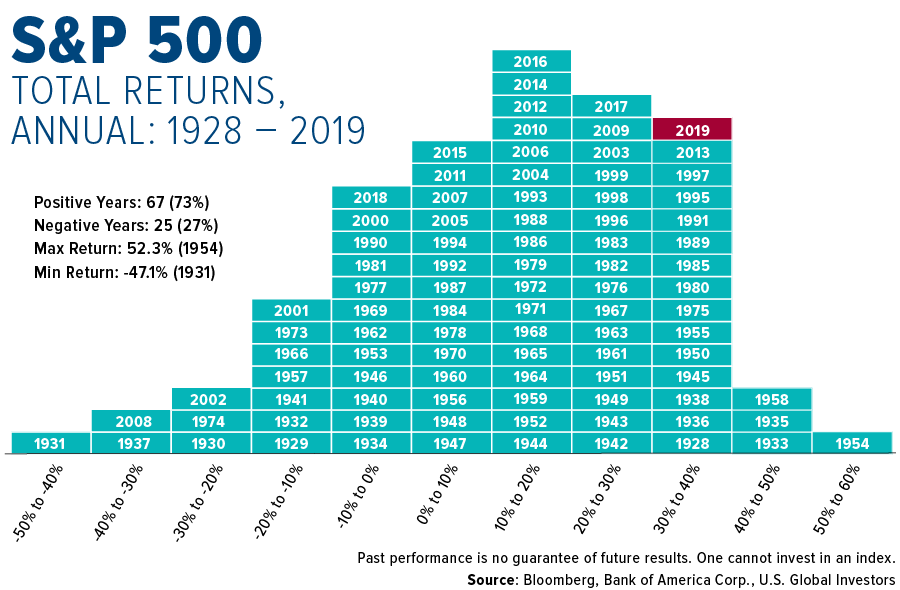
The most dangerous misconception about the “average” return is the idea that the market returns 10% every year. In reality, the S&P 500 rarely returns exactly 10% in any given calendar year. In fact, between 1926 and 2023, the index returned between 8% and 12% in only a handful of years.
Instead, the market is characterized by extreme swings. It is common to see years where the market is up 30% and other years where it is down 20%. The “average” is a mathematical smoothing of these peaks and valleys. Investors who cannot stomach a 20% drop in a single year often pull their money out at the worst possible time, missing the subsequent recovery and failing to achieve the long-term average.
Factors That Drive S&P 500 Performance
The S&P 500 does not move in a vacuum. Its performance is a reflection of the collective health of the U.S. economy and the global marketplace. Several key drivers dictate whether the index will have a banner year or a period of stagnation.
Corporate Earnings and Profitability
At its core, a stock price is a claim on the future earnings of a company. When the 500 companies in the index report strong earnings growth, the index typically rises. Technological innovation, operational efficiency, and global expansion all contribute to rising corporate profits. In the last two decades, the explosion of the tech sector—led by giants like Apple, Microsoft, and Alphabet—has been a primary driver of S&P 500 growth, as these companies achieved unprecedented profit margins.
Interest Rates and Federal Reserve Policy
The Federal Reserve plays a massive role in market returns. When interest rates are low, it is cheaper for companies to borrow money to expand. Furthermore, low interest rates make bonds less attractive, pushing investors toward stocks in search of higher returns. Conversely, when the Fed raises rates to combat inflation, borrowing costs rise, and the “discount rate” used to value future earnings increases, often leading to lower stock valuations.
Economic Cycles
The S&P 500 is closely tied to the business cycle, which consists of expansion, peak, contraction, and trough. During periods of economic expansion, consumer spending is high, and businesses thrive. During recessions, spending drops, and the index often sees significant pullbacks. However, the market is a “leading indicator,” meaning it often begins to recover months before the actual economy shows signs of improvement.
Historical Anomalies: The “Lost Decades” and Bull Runs
Looking at the S&P 500 average annual return over 50 years provides a sense of security, but looking at it over 10-year increments reveals a more volatile story. Not every decade is created equal.
The Dot-Com Bust and the Great Recession (2000–2009)
The period from 2000 to 2009 is often referred to as the “Lost Decade” for the S&P 500. After the dot-com bubble burst in 2000, the market struggled, only to be hit again by the 2008 financial crisis. For an investor who entered the market in 1999 and exited in 2009, the average annual return was actually negative. This serves as a stark reminder that the “10% average” requires a long-term commitment that spans multiple market cycles.
The Post-2008 Bull Market
Following the financial crisis, the S&P 500 entered one of the longest bull markets in history. From 2009 through 2021, the index saw returns that significantly exceeded the historical average. Fueled by low interest rates and the rapid growth of Big Tech, investors saw annual returns that frequently topped 15% or 20%. These periods of outperformance are necessary to balance out the “lost” years, eventually pulling the long-term mean back toward that 10% figure.
The Impact of Market Cap Weighting
It is also important to understand that the S&P 500 is a market-capitalization-weighted index. This means that the largest companies (like Microsoft, Apple, and Nvidia) have a much larger impact on the index’s return than the smallest companies in the 500. If the top 10 companies perform exceptionally well, the index can rise even if the bottom 100 companies are struggling. This concentration has increased in recent years, making the index’s average return highly dependent on the success of a few major players in the technology and consumer discretionary sectors.
Practical Strategies for Capturing the S&P 500 Return
Knowing the average return is only useful if you have a strategy to capture it. For the average person, trying to pick individual stocks to beat the S&P 500 is statistically unlikely to succeed over the long term.
Low-Cost Index Funds and ETFs
The most effective way to mirror the S&P 500’s performance is through low-cost index funds or Exchange-Traded Funds (ETFs). Products like the Vanguard S&P 500 ETF (VOO) or the SPDR S&P 500 ETF Trust (SPY) allow investors to own a tiny slice of all 500 companies for a minimal fee. The “expense ratio” is critical here; a high fee can eat into your returns over time. Modern index ETFs often have expense ratios as low as 0.03%, meaning you keep 99.97% of the market’s return.
Dollar-Cost Averaging
Since we know the market is volatile and the 10% return is an average of many different years, “timing the market” is incredibly difficult. Instead, many successful investors use dollar-cost averaging (DCA). This involves investing a fixed amount of money at regular intervals, regardless of the price. When the market is down, your fixed dollar amount buys more shares. When the market is up, it buys fewer. Over time, this strategy lowers the average cost per share and removes the emotional stress of trying to predict the next market dip.
The Importance of Time Horizon
The S&P 500 is an inappropriate tool for short-term savings. If you need your money in two years for a house down payment, the risk of a 20% market drop is too high. However, for a 20-year time horizon, the S&P 500 is historically one of the most reliable wealth-building engines in existence. The longer you stay invested, the higher the probability that your personal return will converge with the historical 10% average.
By understanding that the S&P 500 average annual return is a long-term smoothing of short-term chaos, investors can develop the discipline needed to stay the course. The 10% nominal (and 7% real) return is a powerful force, but it belongs only to those who are patient enough to endure the years when the “average” feels like a distant memory.
aViewFromTheCave is a participant in the Amazon Services LLC Associates Program, an affiliate advertising program designed to provide a means for sites to earn advertising fees by advertising and linking to Amazon.com. Amazon, the Amazon logo, AmazonSupply, and the AmazonSupply logo are trademarks of Amazon.com, Inc. or its affiliates. As an Amazon Associate we earn affiliate commissions from qualifying purchases.