
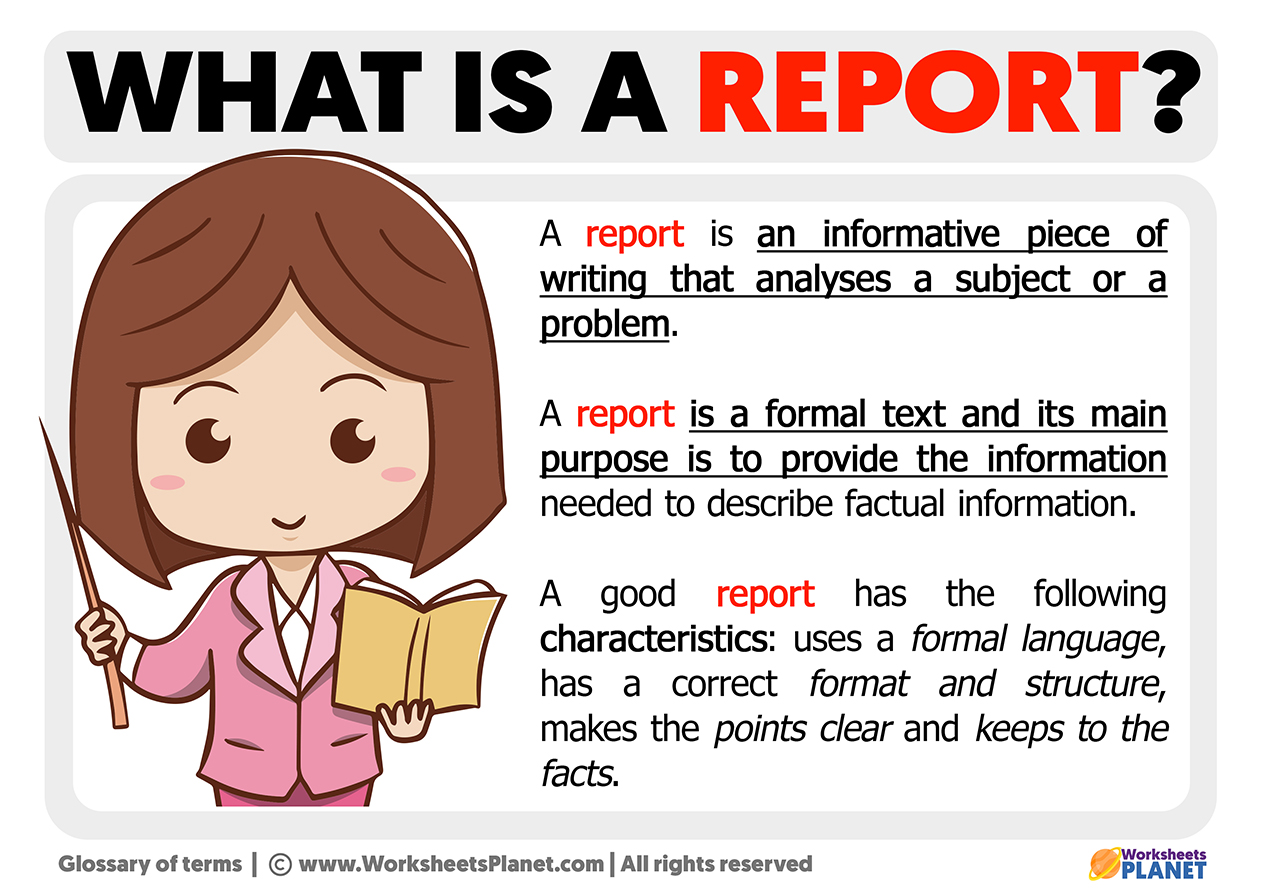
In the modern corporate ecosystem, data is often referred to as the new oil. However, raw data is essentially crude oil—unrefined, volatile, and difficult to use. Reporting is the refinery process that transforms this chaotic stream of information into actionable business intelligence. At its core, reporting is the systematic organization and presentation of data to provide stakeholders with a clear view of performance, trends, and outcomes within an organization.
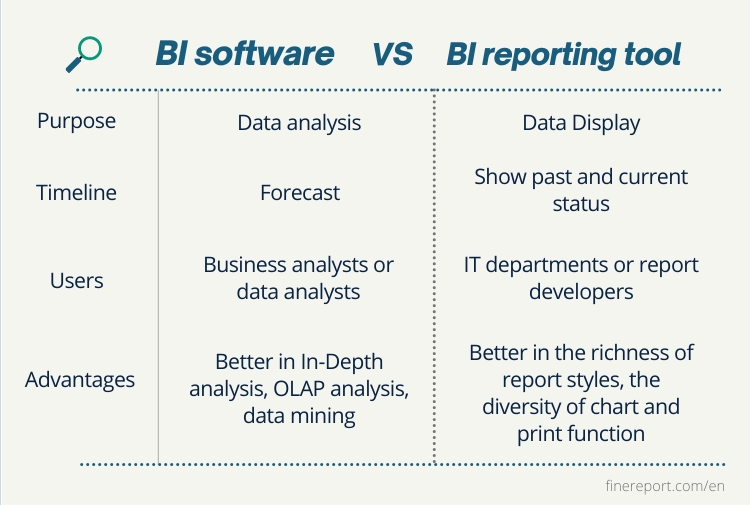
While many professionals use the terms “reporting” and “analytics” interchangeably, they serve distinct purposes. Reporting tells you what has happened; analytics tells you why it happened and what might happen next. Understanding this distinction is the first step toward building a robust framework for business decision-making.
The Foundations of Effective Reporting
Reporting is not merely about dumping numbers into a spreadsheet. It is a strategic communication tool designed to align various departments with organizational goals. Effective reporting relies on three foundational pillars: accuracy, relevance, and consistency.
Data Integrity and Accuracy
The credibility of any report hinges entirely on the quality of the underlying data. If a report contains errors, the resulting decisions will be flawed, potentially leading to financial losses or strategic missteps. Establishing data governance protocols ensures that information is standardized, cleaned, and verified before it is ever pulled into a reporting dashboard.
Tailoring Insights to Stakeholders
A common mistake in business reporting is a “one-size-fits-all” approach. Executives require high-level summaries that emphasize key performance indicators (KPIs) and bottom-line impact. Conversely, operational managers need granular, tactical data to manage day-to-day workflows. An effective reporting architecture segments information so that each stakeholder receives the specific insights necessary to drive their particular function.
The Power of Visual Representation
Human beings process visual information significantly faster than text. Data visualization—through charts, heat maps, and trend lines—is the bridge between complex datasets and human comprehension. By choosing the right visualization method, a reporter can highlight anomalies or growth trajectories that would otherwise be buried in rows of static figures.
Types of Business Reporting
Depending on the scale and objectives of an organization, reporting can be categorized into several functional areas. Each type serves a specific purpose in the lifecycle of a business strategy.
Financial Reporting
This is the most critical form of reporting for regulatory compliance and shareholder transparency. Financial reports, including balance sheets, income statements, and cash flow statements, must adhere to standardized accounting principles (such as GAAP or IFRS). These documents provide an objective view of an organization’s fiscal health, dictating investor confidence and creditworthiness.
Operational Reporting
Operational reports focus on the “how” of business performance. These reports track metrics such as production output, supply chain efficiency, employee productivity, and customer service response times. Unlike financial reports, which are often periodic (monthly or quarterly), operational reports are frequently generated in real-time to allow for immediate course correction.
Strategic and Performance Reporting
Strategic reports align current business activities with long-term objectives. These often take the form of “scorecards” or dashboards that track progress toward five-year goals or annual milestones. They are essential for leadership teams to determine whether the company’s current initiatives are yielding the expected return on investment (ROI) or if the strategy requires pivoting.

The Evolution: From Static Spreadsheets to Dynamic Dashboards
The landscape of reporting has undergone a seismic shift over the last decade. The era of the “manual monthly report”—where analysts spent days copy-pasting data into Excel files—is rapidly fading. Today, the focus has shifted toward automation and real-time visualization.
The Role of Business Intelligence (BI) Tools
Modern BI platforms like Tableau, Power BI, and Looker have democratized data. By integrating directly with enterprise resource planning (ERP) systems and customer relationship management (CRM) software, these tools allow organizations to automate data pipelines. When a transaction occurs in the warehouse or a lead is generated in the sales portal, the impact is reflected in the dashboard instantly.
Moving Toward Self-Service Reporting
The ultimate goal of a modern reporting culture is “self-service.” By empowering non-technical employees to interact with data dashboards independently, companies remove bottlenecks. Analysts no longer need to be “gatekeepers” of information; instead, they act as data curators, ensuring that the dashboards are accurate and that the metrics being tracked are meaningful.
The Integration of Predictive Elements
While traditional reporting is retrospective, the next frontier is predictive reporting. By applying basic statistical modeling and machine learning algorithms to historical reports, businesses can forecast future revenue, predict customer churn, and anticipate inventory shortages before they occur. This elevates the reporting function from a passive observation of the past to a proactive roadmap for the future.
Best Practices for Building a Reporting Culture
Implementing a reporting system is not just a technological challenge; it is a cultural one. If a company generates world-class reports that nobody reads, the effort is wasted. To derive real value from reporting, organizations must foster a culture of data literacy and accountability.
Define Your North Star Metrics
Organizations often suffer from “analysis paralysis” by tracking too many metrics. A robust reporting strategy identifies a handful of North Star metrics—the KPIs that have the most significant correlation with success. Whether it is Customer Acquisition Cost (CAC), Net Promoter Score (NPS), or Recurring Revenue, these metrics should be the focal point of every report.
Establish a Feedback Loop
Reporting should be a two-way street. Stakeholders must be encouraged to critique the reports they receive. If a metric is no longer relevant, or if a dashboard is too cluttered to be useful, the reporting architecture must be agile enough to evolve. Regular “reporting audits” ensure that the information being provided is still driving action.
Emphasize Data Literacy
Not every employee needs to be a data scientist, but every employee should understand the basics of interpreting a chart. Investing in training programs that teach staff how to read data, identify biases, and question findings is essential. When a team understands the “why” behind their numbers, they are more likely to take ownership of the results.
Maintain Ethical Standards in Reporting
With great data comes great responsibility. Reporting must be conducted with the highest degree of ethics. This means avoiding “cherry-picking” data to present a false sense of success, being transparent about data limitations, and ensuring that sensitive customer information is anonymized and protected. Reporting is a reflection of corporate integrity; the moment an organization begins manipulating numbers to fit a narrative, it loses the trust of its stakeholders.
Conclusion
Reporting is the heartbeat of a functional business. It is the mechanism through which an organization measures its pulse, detects illnesses, and charts its course toward growth. By moving beyond simple data entry and embracing automated, visual, and strategic reporting practices, companies can turn the noise of raw data into the clarity of informed action. Whether it is a small startup tracking its daily burn rate or a global corporation analyzing market shifts, the discipline of reporting remains the most reliable foundation for sustained success in a competitive market. Those who master the art of the report do not just record the past—they capture the insights necessary to define the future.
aViewFromTheCave is a participant in the Amazon Services LLC Associates Program, an affiliate advertising program designed to provide a means for sites to earn advertising fees by advertising and linking to Amazon.com. Amazon, the Amazon logo, AmazonSupply, and the AmazonSupply logo are trademarks of Amazon.com, Inc. or its affiliates. As an Amazon Associate we earn affiliate commissions from qualifying purchases.