
In the intricate world of finance, understanding raw numbers is merely the first step. To truly grasp the significance of changes, trends, and comparisons, we must delve into the realm of percentages. The difference in percentage between two numbers is not just a mathematical curiosity; it is a powerful analytical tool that underpins countless financial decisions, from personal budgeting to multi-million-dollar investment strategies. This metric allows us to contextualize change, standardize comparisons, and derive actionable insights that simple absolute differences cannot provide.
Whether you’re tracking your investment portfolio’s growth, evaluating budget overruns, assessing a business’s sales performance, or comparing interest rates, the ability to calculate and interpret percentage differences is indispensable. It transforms static data points into dynamic indicators of progress, challenges, and opportunities.

Understanding the Fundamentals of Percentage Difference in Finance
At its core, calculating the percentage difference between two numbers quantifies the relative change between an initial value and a final value. Unlike an absolute difference, which only tells you the numerical gap, a percentage difference expresses this gap as a proportion of the starting point, making it incredibly useful for comparison across different scales.
The Basic Formula and Its Financial Relevance
The most common formula for calculating the percentage difference (or percentage change) is:
$$
text{Percentage Difference} = left( frac{text{New Value} – text{Old Value}}{text{Old Value}} right) times 100%
$$
- New Value (or Final Value): The number you are comparing to.
- Old Value (or Initial Value): The number you are comparing from. This is your base.
Let’s illustrate with a simple financial example: If your investment portfolio was worth $10,000 at the beginning of the year (Old Value) and grew to $12,500 by the end of the year (New Value), the percentage difference would be:
$$
text{Percentage Difference} = left( frac{$12,500 – $10,000}{$10,000} right) times 100% = left( frac{$2,500}{$10,000} right) times 100% = 0.25 times 100% = 25%
$$
This tells you that your portfolio experienced a 25% increase. If the new value is smaller than the old value, you’ll get a negative percentage, indicating a decrease. For instance, if the portfolio dropped to $9,000:
$$
text{Percentage Difference} = left( frac{$9,000 – $10,000}{$10,000} right) times 100% = left( frac{-$1,000}{$10,000} right) times 100% = -0.10 times 100% = -10%
$$
This indicates a 10% decrease. The financial relevance here is profound: a 25% increase on $10,000 feels substantial, but a 25% increase on $1,000,000 is a monumental gain. The percentage allows for direct comparison of performance regardless of the underlying capital.
Distinguishing Between Percentage Change and Absolute Percentage Point Difference
It’s crucial in finance to differentiate between a percentage change and an absolute percentage point difference. The formula above calculates a percentage change. However, sometimes financial metrics are already expressed in percentages, and we want to know the difference between those percentages.
For example, if an interest rate increases from 4% to 5%, the absolute percentage point difference is 1 percentage point (5% – 4% = 1%).
But the percentage change in the interest rate is much higher:
$$
text{Percentage Change in Rate} = left( frac{5% – 4%}{4%} right) times 100% = left( frac{1%}{4%} right) times 100% = 0.25 times 100% = 25%
$$
This means the interest rate itself increased by 25%, even though it only went up by 1 percentage point. Misunderstanding this distinction can lead to significant errors in financial analysis and decision-making, particularly in areas like bond yields, inflation rates, or market share shifts.
Applications in Personal Finance and Budgeting
For individuals, understanding percentage differences is key to financial health and effective money management. It empowers you to track progress, identify areas for improvement, and make informed choices about your spending and saving.
Tracking Spending Habits and Identifying Budget Variances
Creating a budget is only the first step; monitoring it is where the real work happens. Percentage differences enable you to quantify how well you’re sticking to your plan. If you budgeted $500 for groceries but spent $650, your overspending isn’t just $150; it’s a:
$$
text{Percentage Over Budget} = left( frac{$650 – $500}{$500} right) times 100% = 30%
$$
This 30% figure clearly highlights a significant deviation and prompts you to investigate why. Conversely, if you spent $400, you’d be 20% under budget, indicating effective cost management. Regularly calculating these variances allows you to refine your budget, pinpoint areas of financial leakage, and adjust your spending habits proactively.

Analyzing Income Growth and Expense Fluctuations
Over time, your income might grow, and your expenses will certainly fluctuate. Percentage differences provide a standardized way to measure these changes. If your monthly income increased from $4,000 to $4,500, that’s a 12.5% raise. How does that compare to the 10% increase in your rent or a 5% rise in utility costs? By expressing all changes as percentages, you can quickly assess whether your income growth is outpacing your cost of living, or vice versa, giving you a clearer picture of your financial well-being.
Strategic Insights for Investing and Portfolio Management
In the investment world, percentage differences are the language of performance. They allow investors to measure returns, compare investment opportunities, and understand market movements.
Calculating Investment Returns (ROI) and Portfolio Performance
Return on Investment (ROI) is a critical metric calculated using percentage difference. If you invest $1,000 in a stock and sell it for $1,200, your ROI is 20%. This metric helps you understand the efficiency of your capital allocation.
Beyond individual investments, you can apply this to your entire portfolio. Tracking your portfolio’s percentage growth or decline over various periods (e.g., month-to-month, year-to-date, annually) is essential for assessing its health and making strategic adjustments. Comparing your portfolio’s percentage return to market benchmarks (like the S&P 500’s percentage change) helps you understand if you’re outperforming or underperforming.
Understanding Market Fluctuations and Asset Allocation
Stock market reports constantly quote percentage changes in indices like the Dow Jones Industrial Average or NASDAQ. A 2% drop in the S&P 500 isn’t just a number; it indicates a significant market shift that can impact your portfolio’s value. Understanding these percentage changes helps investors react strategically, whether by rebalancing assets or identifying buying opportunities during dips. Similarly, when rebalancing a portfolio, you might aim to adjust asset classes to maintain target percentages, for example, moving from 60% equities/40% bonds to a new 70%/30% split, which involves calculating the percentage shift required in each asset.
Driving Business Finance Decisions
For businesses, financial percentage differences are not just metrics; they are vital signs that guide strategic planning, operational efficiency, and profitability.
Monitoring Sales Growth and Revenue Declines
Businesses live and die by their revenue. Comparing current sales figures to previous periods (month-over-month, year-over-year) using percentage differences is a standard practice. If sales grew from $100,000 last quarter to $115,000 this quarter, that’s a 15% growth. This percentage provides a clear, comparable metric to assess the effectiveness of sales strategies, marketing campaigns, or product launches. Conversely, a percentage decline signals potential problems that need immediate investigation.
Analyzing Profit Margins and Cost Efficiency
Profit margins, often expressed as a percentage of revenue, are crucial for assessing a company’s financial health. A gross profit margin (gross profit / revenue) or net profit margin (net income / revenue) tells you how much profit a business makes for every dollar of sales. Tracking the percentage difference in these margins over time can reveal trends in pricing, production costs, and operational efficiency. For example, if a company’s net profit margin decreased from 10% to 8%, that’s not just a 2 percentage point drop; it’s a 20% percentage change in the margin itself, signaling a significant dip in profitability. Analyzing cost changes as percentages also helps identify areas for cost reduction.
Benchmarking Performance Against Industry Standards
Businesses rarely operate in a vacuum. Comparing their financial metrics to industry averages, often expressed as percentages, is a powerful benchmarking tool. Is a company’s 12% sales growth impressive? It depends on whether the industry average is 5% or 20%. Percentage differences allow businesses to gauge their competitive standing, identify best practices, and set realistic, data-driven goals.
Tools and Best Practices for Accurate Financial Calculation
While the formula for percentage difference is straightforward, real-world financial analysis often involves numerous calculations and complex datasets. Leveraging the right tools and adhering to best practices ensures accuracy and efficiency.
Leveraging Spreadsheets (Excel, Google Sheets) for Financial Modeling
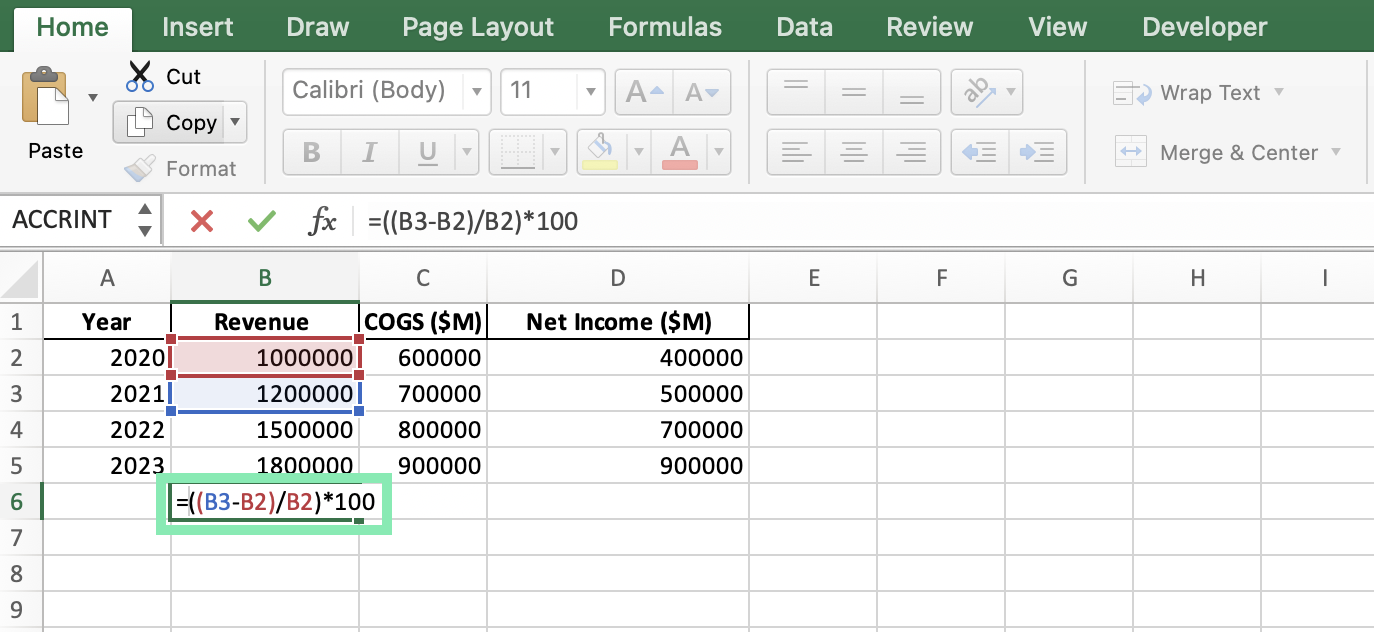
Spreadsheets are the bedrock of financial analysis. Functions like = (B2-A2)/A2 in Excel or Google Sheets make calculating percentage differences across large datasets trivial. You can easily apply these formulas to track budget variances, calculate ROI for multiple investments, analyze sales growth trends, and build complex financial models that update dynamically. Conditional formatting can even visually highlight positive (green) or negative (red) percentage changes, providing instant insights.
Using Financial Calculators and Software
For quick, one-off calculations, online financial calculators or dedicated apps can provide immediate results. Many investment platforms and personal finance software tools automatically calculate and display percentage changes for your assets, liabilities, and net worth, simplifying the tracking process. These tools reduce manual errors and save time, allowing you to focus on interpreting the data rather than crunching numbers.
Avoiding Common Pitfalls in Percentage Calculations
- Wrong Base Value: Always ensure you’re dividing by the old or original value. Dividing by the new value will give you an incorrect result.
- Order of Operations: Ensure the subtraction happens before the division.
- Misinterpreting Percentage Points vs. Percentage Change: As discussed, be mindful of whether you’re looking for an absolute difference between two percentages or the percentage change of a percentage.
- Small Denominators: When the base value is very small or zero, percentage changes can become misleading or undefined. For example, if profits increase from $1 to $100, the percentage increase is 9900%, which is numerically correct but might not convey the true magnitude of the underlying business change as effectively as the absolute number. Always consider the context.
In conclusion, the simple concept of “what is the difference in percentage between two numbers” unlocks a world of financial understanding. From managing your personal budget to steering a multi-million-dollar enterprise, mastering this fundamental calculation and its applications is an essential skill for anyone looking to navigate the complexities of the monetary landscape with confidence and insight. By applying this tool judiciously, individuals and businesses can gain clarity, identify opportunities, mitigate risks, and make smarter financial decisions that drive growth and prosperity.
aViewFromTheCave is a participant in the Amazon Services LLC Associates Program, an affiliate advertising program designed to provide a means for sites to earn advertising fees by advertising and linking to Amazon.com. Amazon, the Amazon logo, AmazonSupply, and the AmazonSupply logo are trademarks of Amazon.com, Inc. or its affiliates. As an Amazon Associate we earn affiliate commissions from qualifying purchases.