
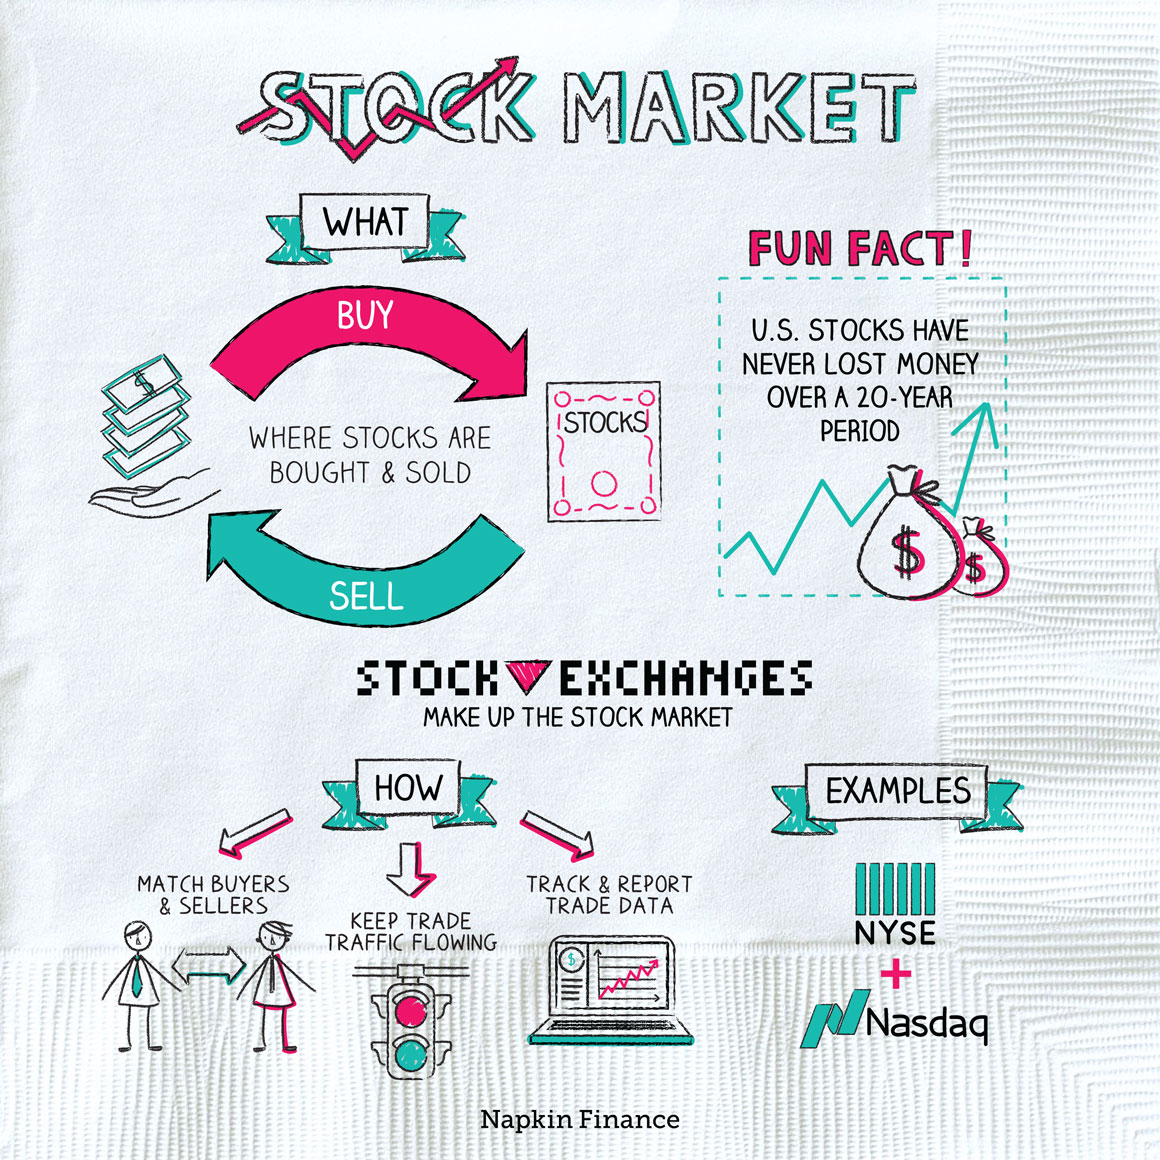
The question “What did the stock market do?” is deceptively simple, yet it unlocks a universe of economic indicators, corporate performance, investor psychology, and global events. Far from a mere daily tally, the stock market’s movements are a complex symphony reflecting the health of economies, the pulse of innovation, and the collective sentiment of millions of participants. Understanding these dynamics is crucial for investors, business leaders, policymakers, and anyone looking to comprehend the financial forces shaping our world. This article delves into how we interpret market actions, the factors that drive them, and what those movements signify for individuals and the broader economic landscape.
Deciphering Daily Market Movements
On any given day, news headlines will trumpet whether the market was “up” or “down.” But this snapshot barely scratches the surface. A truly insightful answer requires looking beyond the immediate figures to understand the underlying currents and the specific components contributing to the overall movement.
Key Market Indicators
When we talk about “the stock market,” we are typically referring to major stock market indices. These are theoretical portfolios of stocks designed to represent a segment of the market or the market as a whole. Their performance serves as a barometer:
- S&P 500 (Standard & Poor’s 500): Widely considered the best gauge of large-cap U.S. equities and, by extension, the overall health of the U.S. stock market. It comprises 500 leading U.S. publicly traded companies. A rise in the S&P 500 indicates broad positive sentiment and performance among major corporations.
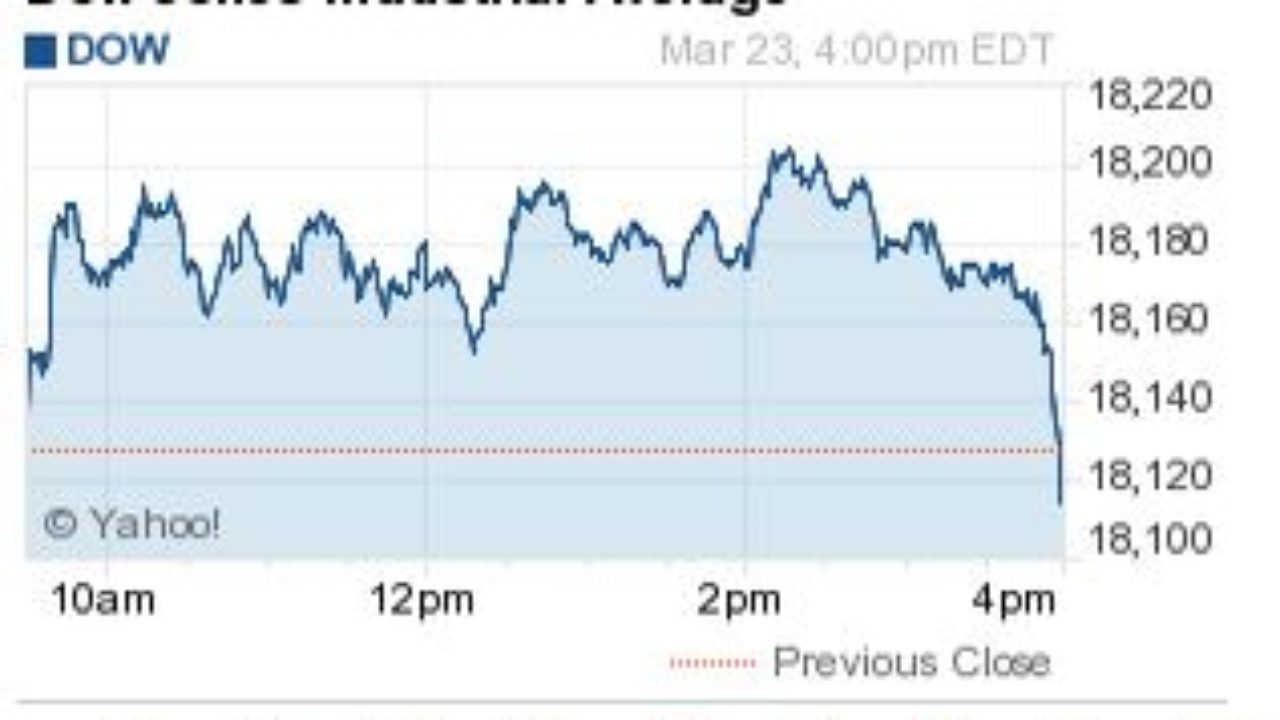
- Dow Jones Industrial Average (DJIA): An older, price-weighted index of 30 significant industrial companies. While less comprehensive than the S&P 500, its movements are still closely watched as an indicator of blue-chip performance.
- Nasdaq Composite: Heavily weighted towards technology and growth companies, this index reflects the performance of firms often at the forefront of innovation. Strong Nasdaq performance often signals investor confidence in the tech sector and future growth prospects.
- Russell 2000: Represents smaller-cap companies. Its performance can indicate the health of smaller, domestically focused businesses, which are often more sensitive to U.S. economic conditions.
Analysing these indices individually provides a nuanced view. For instance, a day where the S&P 500 is up, but the Nasdaq is down, might suggest a rotation from growth stocks to value stocks, or perhaps concerns specific to the tech sector despite overall market resilience. Conversely, a broad-based rally across all indices often signals widespread investor optimism.
Influencing Factors
Market movements are rarely random. They are the cumulative result of countless individual decisions influenced by a continuous stream of information:
- Economic Data Releases: Reports on GDP growth, inflation (Consumer Price Index, Producer Price Index), unemployment rates, manufacturing output, and consumer sentiment provide crucial insights into the economy’s strength and direction. Positive data can fuel rallies, while disappointing figures often lead to pullbacks.
- Corporate Earnings Reports: Quarterly earnings announcements are pivotal. When companies report profits and revenues that exceed expectations, their stock prices, and often the broader market, can surge. Missed expectations or cautious outlooks can trigger declines.
- Geopolitical Events: Wars, trade disputes, elections, or significant policy changes in major economies can introduce uncertainty, impacting commodity prices, supply chains, and investor confidence globally.
- Central Bank Policies: Decisions by central banks, especially the U.S. Federal Reserve, on interest rates and monetary policy (e.g., quantitative easing or tightening) profoundly affect borrowing costs, corporate profitability, and the attractiveness of different asset classes.
- Investor Sentiment and Technical Factors: Beyond fundamentals, market psychology plays a huge role. Fear, greed, and herd mentality can drive irrational exuberance or panic selling. Technical analysis, studying price charts and trading volumes, can also identify patterns that influence short-term movements.
The Broader Economic Context
The daily ebb and flow of stock prices are intricately linked to the broader macroeconomic environment. Understanding “what the stock market did” requires appreciating these foundational economic forces. The market doesn’t operate in a vacuum; it discounts future expectations of economic performance and corporate profitability.
Interest Rates and Inflation
These two factors are arguably among the most significant drivers of stock market performance:
- Interest Rates: When central banks raise interest rates, borrowing becomes more expensive for businesses and consumers. This can slow economic growth, reduce corporate profits, and make bonds more attractive relative to stocks. Higher rates also reduce the present value of future earnings, which can depress stock valuations, particularly for growth companies whose profits are expected far in the future. Conversely, lower interest rates tend to stimulate economic activity and boost stock valuations.
- Inflation: Persistent inflation erodes the purchasing power of money and can increase costs for businesses, potentially squeezing profit margins. Companies may pass these costs onto consumers, but this isn’t always feasible without impacting demand. High inflation also often prompts central banks to raise interest rates to cool the economy, creating a dual headwind for stocks. Deflation, while less common, can also be problematic, signaling weak demand and economic contraction. Investors watch inflation reports closely, as they directly influence central bank policy decisions.
GDP and Employment Data
Gross Domestic Product (GDP) and employment figures are fundamental indicators of economic health, which directly translates into corporate health and, by extension, stock market performance:
- Gross Domestic Product (GDP): This measures the total value of goods and services produced in an economy. Robust GDP growth indicates a healthy, expanding economy where businesses are likely to see increased sales and profits. A contracting GDP signals recessionary pressures, which typically lead to lower corporate earnings and stock market declines. Investors scrutinize GDP reports for signs of economic expansion or contraction.
- Employment Data: Key reports like the U.S. Nonfarm Payrolls and unemployment rate reflect the strength of the labor market. A strong job market—low unemployment, rising wages—signals a healthy economy with robust consumer spending, which drives corporate revenues. Conversely, rising unemployment and stagnant wages suggest economic weakness, which dampens consumer demand and corporate profitability. Employment data is often viewed as a leading indicator of economic health and directly impacts consumer confidence.
Sectoral Performance and Trends
The stock market is not a monolith; it’s an aggregation of diverse industries, each with its own sensitivities and growth drivers. “What the stock market did” often conceals divergent performances among its various sectors, offering clues about underlying economic shifts and emerging investment themes.
Leading and Lagging Sectors
Different sectors tend to perform better or worse depending on the economic cycle and prevailing market conditions:
- Cyclical Sectors: Industries like industrials, materials, consumer discretionary (e.g., luxury goods, airlines), and financials are highly sensitive to economic cycles. They tend to perform well during periods of economic expansion and suffer during recessions. For example, during a booming economy, people buy more cars and houses, benefiting automotive and construction sectors.
- Defensive Sectors: These include consumer staples (e.g., food, beverages), utilities, and healthcare. They tend to be less volatile and more resilient during economic downturns because demand for their products and services remains relatively stable regardless of the economic climate. People still need electricity, food, and medicine even in a recession.
- Growth Sectors: Technology and communication services often fall into this category. These sectors are characterized by companies with high growth potential, often reinvesting profits for expansion rather than paying large dividends. Their performance can be highly sensitive to interest rates and investor appetite for risk.
- Value Sectors: Energy and some industrial sectors might be considered value-oriented, comprising companies with established businesses, often trading at lower valuations relative to their earnings or assets. They may offer higher dividends and can perform well when investors rotate out of high-growth stocks.
Observing which sectors are leading or lagging provides invaluable insights. A strong performance in technology, for example, might indicate investor optimism about future innovation and economic growth, while a rotation into defensive sectors could signal caution about an impending economic slowdown.
Identifying Emerging Trends
Changes in sectoral leadership can also point to broader, long-term trends shaping the economy and society:
- Technological Disruptions: Persistent outperformance by sectors related to artificial intelligence, renewable energy, or biotechnology often indicates a major technological shift in progress. This signals areas where innovation is driving significant economic value and future growth.
- Demographic Shifts: A sustained surge in healthcare or senior living sectors might reflect an aging population and increased demand for related services.
- Environmental and Social Concerns: Growth in companies focused on sustainability, ESG (Environmental, Social, Governance) investing, or clean energy can reflect increasing societal awareness and regulatory focus on these issues.
By dissecting “what the stock market did” at the sectoral level, investors can identify where capital is flowing, anticipate future economic shifts, and position their portfolios to capture long-term growth opportunities or mitigate emerging risks. It’s a powerful lens through which to view the evolution of industries and the economy as a whole.
Investor Sentiment and Psychology
Beyond the cold, hard data of economics and corporate earnings, the stock market is profoundly influenced by the collective mood, beliefs, and emotional responses of its participants. “What the stock market did” often reflects a delicate balance of fear and greed, optimism and pessimism, rational analysis and irrational exuberance.
Fear, Greed, and Market Volatility
Human emotions are powerful drivers of market behavior, particularly in the short term:
- Greed: When the market is consistently rising, greed can lead investors to chase returns, buying into popular stocks at inflated prices, sometimes disregarding fundamental valuations. This can lead to “bubble-like” conditions where assets become overvalued. The fear of missing out (FOMO) also plays a significant role, pulling more participants into a rising market.
- Fear: Conversely, when markets fall, fear can trigger panic selling, causing investors to liquidate positions at a loss, often at the worst possible time. The fear of losing money (FOLM) can override rational decision-making, leading to cascading sell-offs and heightened volatility. Significant geopolitical events, economic crises, or unexpected corporate failures can all trigger waves of fear.
- Market Volatility: The tug-of-war between fear and greed often manifests as volatility—rapid and unpredictable price swings. High volatility indicates uncertainty and can present both increased risks and opportunities for agile traders. Indices like the VIX (Volatility Index) or “fear gauge” measure expected market volatility, offering a glimpse into prevailing investor anxiety.
Understanding these emotional cycles is crucial. Savvy investors often try to counter these impulses, buying when others are fearful (when valuations might be attractive) and selling when others are greedy (when assets might be overvalued).
The Role of News and Social Media
In today’s interconnected world, information—and misinformation—travels at lightning speed, profoundly impacting investor sentiment:
- Traditional News Outlets: Financial news channels, reputable newspapers, and economic journals provide analysis, breaking news, and expert commentary that can sway market opinion. Reports on corporate mergers, new product launches, regulatory changes, or economic forecasts are closely watched.
- Social Media: Platforms like X (formerly Twitter), Reddit, and various financial forums have become significant, albeit often noisy, sources of market information and sentiment. Trends, memes, and viral discussions can trigger rapid buying or selling in specific stocks, particularly among retail investors. This phenomenon, sometimes called “meme stock” trading, has highlighted how collective sentiment, amplified by social media, can exert real influence on market prices, sometimes disconnected from traditional fundamentals.
- Information Overload: The sheer volume of news and commentary can make it challenging for investors to discern reliable signals from noise. The speed at which news breaks means that market reactions can be almost instantaneous, often before a full understanding of the implications is possible.
The interplay of human psychology with the rapid dissemination of information ensures that “what the stock market did” is rarely just about numbers; it’s also a reflection of the human condition—our hopes, anxieties, and collective judgments about the future.
Strategic Implications for Investors
Interpreting “what the stock market did” is not merely an academic exercise; it has profound implications for how individuals manage their finances and allocate their capital. Understanding market movements is the first step toward informed decision-making and developing a robust investment strategy.
Long-Term vs. Short-Term Views
The significance of market action often depends on an investor’s time horizon:
- Short-Term Investors/Traders: For those engaged in day trading or swing trading, daily and even hourly market movements are paramount. They look for patterns, momentum shifts, and technical indicators to make rapid buying and selling decisions, aiming to profit from small price fluctuations. For this group, “what did the stock market do today?” dictates their immediate actions.
- Long-Term Investors: For individuals saving for retirement, a down day or week in the market is often less concerning. They focus on the overall growth trajectory of the economy and specific companies over years or decades. Market corrections (declines of 10-20%) or bear markets (declines of 20% or more) are viewed not as disasters but potentially as opportunities to buy quality assets at lower prices. For them, the question “what did the stock market do over the last decade?” is more relevant, often revealing a consistent upward trend despite periodic volatility. This perspective emphasizes patience and compounding returns.
Diversification and Risk Management
Regardless of one’s investment horizon, understanding market behavior underscores the importance of prudent risk management:
- Diversification: The fact that different sectors and asset classes (stocks, bonds, real estate, commodities) perform differently under various market conditions highlights the need for diversification. Spreading investments across a range of assets can help mitigate risk. If one sector or asset class performs poorly, others may perform well, cushioning the overall portfolio against significant losses.
- Asset Allocation: This refers to the strategic mix of different asset classes in a portfolio. An investor’s age, risk tolerance, and financial goals typically determine their ideal asset allocation. A younger investor with a longer time horizon might allocate more to stocks, while someone nearing retirement might favor a higher allocation to less volatile assets like bonds.
- Dollar-Cost Averaging: This strategy involves investing a fixed amount of money at regular intervals, regardless of market fluctuations. When prices are high, fewer shares are bought; when prices are low, more shares are bought. This approach can smooth out the average cost of investments over time and reduce the emotional impact of market volatility.

Leveraging Financial Tools and Expertise
Navigating the complexities of the stock market can be challenging, but various resources are available to help:
- Financial News and Research: Reputable financial news outlets, analyst reports, and economic data providers offer a wealth of information for informed decision-making.
- Investment Platforms and Tools: Online brokerage platforms provide access to market data, analytical tools, and educational resources. Robo-advisors can offer automated portfolio management based on an investor’s risk profile.
- Financial Advisors: For those who prefer professional guidance, a qualified financial advisor can help assess individual financial situations, set goals, develop a personalized investment strategy, and guide them through market ups and downs. Their expertise can be invaluable in translating “what the stock market did” into actionable steps tailored to specific needs.
In essence, answering “what did the stock market do” is more than just observing a number change; it’s about interpreting a complex narrative, understanding its implications, and applying that knowledge to build and maintain a resilient financial future. The market is a continuous learning environment, rewarding those who approach it with a blend of knowledge, strategy, and emotional discipline.
aViewFromTheCave is a participant in the Amazon Services LLC Associates Program, an affiliate advertising program designed to provide a means for sites to earn advertising fees by advertising and linking to Amazon.com. Amazon, the Amazon logo, AmazonSupply, and the AmazonSupply logo are trademarks of Amazon.com, Inc. or its affiliates. As an Amazon Associate we earn affiliate commissions from qualifying purchases.