
In the modern technological landscape, we are drowning in data. From the millions of pixels in a high-resolution satellite image to the thousands of variables tracked in a genomic sequence, the “Big Data” revolution has provided us with more information than ever before. However, this abundance presents a significant challenge for software engineers, data scientists, and AI researchers: the Curse of Dimensionality. When a dataset has too many variables (features), it becomes computationally expensive to process, difficult to visualize, and prone to “overfitting”—a state where an AI model learns noise rather than actual patterns.

This is where Principal Component Analysis (PCA) becomes an indispensable tool in the tech stack. At its core, PCA is a statistical procedure that uses an orthogonal transformation to convert a set of observations of possibly correlated variables into a set of values of linearly uncorrelated variables called “Principal Components.” In simpler terms, it is the ultimate “summarization” tool for complex data, allowing tech professionals to distill massive datasets into their most vital essence without losing the critical information that drives decision-making.
Understanding the Core Mechanics: From High-Dimensional Chaos to Linear Simplicity
To understand what a principal component is, one must first visualize data as a cloud of points in space. In a standard spreadsheet, every column represents a dimension. If you have 50 columns, you are working in 50-dimensional space—a realm impossible for the human brain to visualize and difficult for many algorithms to navigate efficiently.
The Concept of Feature Space and Variance
In data science, “variance” is a proxy for information. If a variable doesn’t change (zero variance), it tells us nothing new. PCA operates on the premise that the directions in which data shows the most variation are the directions that contain the most important information. The first principal component is a straight line drawn through the multidimensional data cloud that captures the maximum possible variance. The second principal component is another line, perpendicular (orthogonal) to the first, that captures the remaining variance, and so on.
Eigenvectors and Eigenvalues: The Mathematical Engine
Behind the scenes of every PCA software library—whether in Python’s Scikit-learn or R’s FactoMineR—is the calculation of eigenvectors and eigenvalues. These are the mathematical constructs that define the principal components.
- Eigenvectors determine the direction of the new feature space (the axes).
- Eigenvalues determine the magnitude or the “strength” of each axis.
By calculating these, the algorithm can rank the components. The first few components usually capture 80-90% of the information, allowing the developer to discard the remaining dozens of dimensions with minimal data loss.
Why PCA is Essential for Modern Machine Learning Workflows
In the field of Artificial Intelligence, PCA isn’t just a luxury; it is often a preprocessing necessity. As models become more complex, the quality of the input data becomes the primary bottleneck for performance.
Combatting the Curse of Dimensionality
As the number of features increases, the volume of the space increases so fast that the available data becomes sparse. This sparsity is a nightmare for machine learning algorithms like k-nearest neighbors (k-NN) or support vector machines (SVM), which rely on distance metrics. By using PCA to reduce the number of features, we “densify” the data, making it easier for algorithms to find meaningful clusters and boundaries.
Enhancing Computational Efficiency and Speed
Training a deep learning model on a dataset with 10,000 features requires massive GPU power and time. By transforming those 10,000 features into 100 principal components that represent the bulk of the variance, developers can reduce training times from hours to minutes. This efficiency is critical in agile environments where rapid iteration and deployment are key to staying competitive.
Noise Reduction and Signal Clarification
In tech, “noise” refers to random fluctuations in data that do not represent the underlying process. Because PCA focuses on maximum variance, it tends to capture the “signal” (the consistent patterns) in the first few components while relegating the “noise” to the later, lower-variance components. By discarding these minor components, engineers can effectively “clean” their data, leading to more robust and generalizable AI models.
Practical Applications of PCA in Today’s Tech Landscape
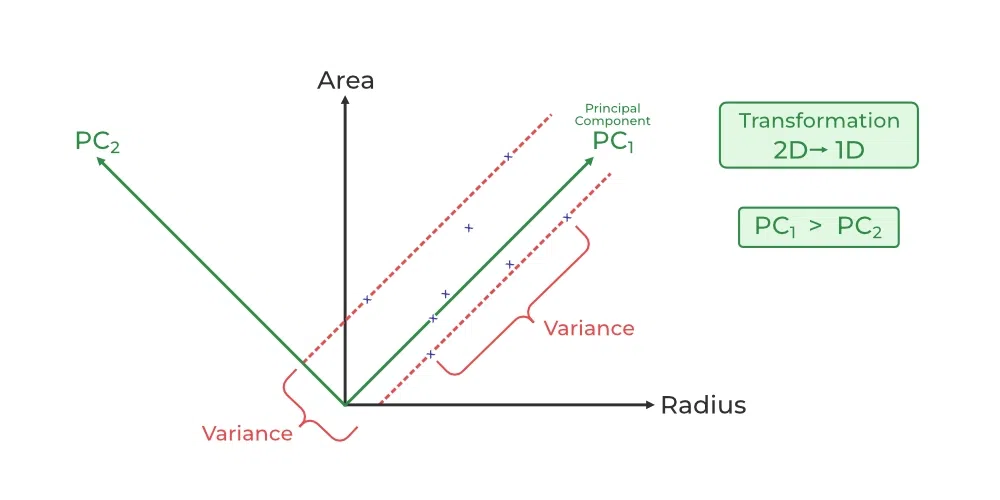
PCA is not a theoretical concept relegated to textbooks; it powers many of the digital experiences we interact with daily. Its ability to simplify complexity makes it a versatile tool across various tech sub-sectors.
Image Compression and Computer Vision
Digital images are essentially large matrices of pixel values. A high-definition image contains millions of data points. PCA is used in computer vision to perform “Eigenfaces” recognition. By treating images as vectors and identifying the principal components of a face database, a system can represent a human face using just a few dozen numerical values rather than millions of pixels. This dramatically speeds up facial recognition software on mobile devices where processing power is limited.
Genomic Data Analysis and Bioinformatics
The tech-bio intersection relies heavily on dimensionality reduction. A single human genome sequence involves hundreds of thousands of genetic markers. PCA allows bioinformaticians to map this data onto a 2D or 3D plot, revealing clusters that correspond to ethnic backgrounds or disease predispositions. This visualization would be impossible without the “feature squeezing” capabilities of PCA.
Natural Language Processing (NLP) and Word Embeddings
In the era of Large Language Models (LLMs), PCA plays a role in understanding how machines perceive language. Word embeddings (like Word2Vec or GloVe) represent words in high-dimensional vectors. To analyze how a model “understands” the relationship between “King” and “Queen,” developers use PCA to project these 500-dimensional embeddings onto a 2D plane. This reveals the semantic relationships that the AI has learned, providing a window into the “black box” of neural networks.
Implementing Principal Component Analysis: Tools and Best Practices
For developers and data engineers, implementing PCA is straightforward thanks to modern software ecosystems, but doing it correctly requires adherence to specific technical protocols.
Popular Libraries: Scikit-learn, TensorFlow, and PyTorch
The most common implementation of PCA is found in the Python library Scikit-learn via the PCA class in the decomposition module. For larger datasets that don’t fit into memory, Incremental PCA is used. In deep learning frameworks like TensorFlow or PyTorch, PCA is often used during the exploratory data analysis (EDA) phase to verify that the high-dimensional embeddings are forming logical clusters before moving to the training phase.
Pre-processing: The Vital Role of Feature Scaling
A common pitfall in tech implementation is failing to scale the data before applying PCA. Because PCA is based on variance, it is highly sensitive to the units of measurement. If one feature is measured in “meters” and another in “millimeters,” the “millimeters” feature will appear to have much higher variance simply due to its scale. To prevent this, engineers must use Standardization (Z-score normalization) to ensure every feature has a mean of zero and a standard deviation of one.
Choosing the Right Number of Components (Scree Plots)
How many components should a developer keep? The standard tech practice is to use a “Scree Plot,” which graphs the explained variance against the number of components. The “elbow” of the curve—the point where the variance explained starts to level off—is typically the optimal number of dimensions to retain. Alternatively, many pipelines are set to retain enough components to explain a fixed percentage (e.g., 95%) of the total variance.
The Future of Dimensionality Reduction: Beyond Linear PCA
While PCA is a powerhouse, it has a limitation: it is a linear transformation. In the cutting-edge realms of AI, data often resides on complex, curved manifolds that linear lines cannot describe.
Kernel PCA for Non-Linear Data
To address non-linear relationships, tech researchers use Kernel PCA. By using the “kernel trick”—the same logic behind Support Vector Machines—data is projected into a much higher-dimensional space where it becomes linearly separable, and then PCA is applied. This allows for the discovery of patterns that standard PCA would miss entirely.

Integrating PCA with Deep Learning Architectures
We are seeing an increasing trend of “Autoencoders” in deep learning, which are essentially the neural network version of PCA. While PCA finds a linear subspace, an Autoencoder uses non-linear activation functions to find a “latent representation” of the data. However, PCA remains the gold standard for many tech applications because it is mathematically deterministic, faster to compute, and much easier to interpret than a deep neural network.
In conclusion, the “Principal Component” is more than just a statistical term; it is a foundational pillar of modern data engineering. By allowing us to see through the fog of high-dimensional noise, PCA enables the creation of faster, leaner, and more accurate technology. Whether it’s optimizing a recommendation engine or streamlining a computer vision pipeline, understanding and applying PCA is a hallmark of sophisticated technical expertise in the age of AI.
aViewFromTheCave is a participant in the Amazon Services LLC Associates Program, an affiliate advertising program designed to provide a means for sites to earn advertising fees by advertising and linking to Amazon.com. Amazon, the Amazon logo, AmazonSupply, and the AmazonSupply logo are trademarks of Amazon.com, Inc. or its affiliates. As an Amazon Associate we earn affiliate commissions from qualifying purchases.