
In the contemporary landscape of professional football, every movement on the pitch is converted into a digital data point. Among the myriad of acronyms that populate the dashboards of analysts and scouts, “PD” stands as a foundational metric. Depending on the specific code of football—Association or American—PD primarily refers to Point Differential or Passes Defended. While these terms may seem like simple box-score statistics, they have evolved into complex data inputs that drive the sophisticated software and artificial intelligence systems used by elite organizations today.
Understanding PD is no longer just about reading a scoreboard; it is about understanding the digital infrastructure of sports science. In a world where high-speed cameras and wearable sensors track every micro-interaction, PD serves as a critical KPI (Key Performance Indicator) that informs recruitment algorithms, game-theory simulations, and real-time tactical adjustments.
The Digital Definition: Decoding PD within Data Ecosystems
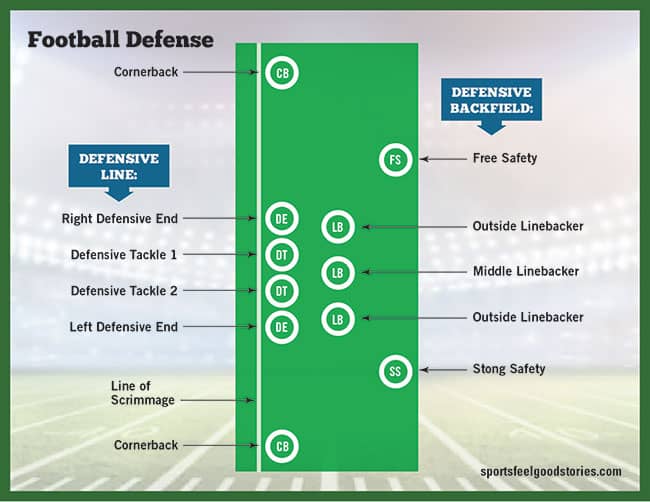
At its core, the technological application of PD involves the quantification of efficiency. In the context of league standings, Point Differential (PD) is calculated by subtracting points allowed from points scored. In American football, PD (Passes Defended) measures a defender’s ability to disrupt the trajectory of a ball without necessarily intercepting it. From a tech perspective, both definitions require robust data-capture frameworks.
The Role of Computer Vision in Tracking PD
Modern stadiums are equipped with multi-camera arrays that utilize computer vision to track player and ball movement at 25 frames per second or higher. Systems like Hawk-Eye and Second Spectrum use these feeds to automatically identify a “Pass Defended.” When a player’s hand interacts with the ball’s flight path, the software recognizes the change in vector and registers a PD event in the database. This automation eliminates human error and provides a granular look at defensive efficiency that was previously impossible to log manually.
Point Differential as a Predictive Variable
For data scientists working in sports tech, Point Differential is a much more valuable metric than a simple win-loss record. Software models used for predictive analytics, such as Pythagorean Expectation formulas, rely on PD to determine a team’s “true” strength. By inputting PD into machine learning models, analysts can predict future performance with a higher degree of accuracy, as it filters out the “noise” of close-game luck and focuses on the underlying technical dominance of a squad.
The Tech Stack Behind PD: Software and Hardware Integration
The collection and analysis of PD data are made possible by a sophisticated tech stack that bridges the gap between the physical field and the digital cloud. This ecosystem involves hardware for data collection, middleware for processing, and front-end software for visualization.
Wearable Sensors and IoT
Elite football players now wear GPS and IMU (Inertial Measurement Unit) sensors tucked into vests. These IoT devices track acceleration, orientation, and “impact events.” In the case of a Pass Defended (PD), these sensors can detect the sudden, high-velocity movement of a defender’s arm. When synced with ball-tracking technology (which often includes a microchip embedded inside the football), the system can verify a PD with millisecond precision. This hardware integration allows teams to measure the “closing speed” required to achieve a PD, providing a technical benchmark for athletic performance.
Centralized Analytics Platforms
Once the raw data is captured, it is ingested by centralized platforms such as Catapult, Hudl, or specialized proprietary software built on AWS or Microsoft Azure. These platforms serve as the “brain” for football operations.
- Data Normalization: The software takes raw spatial coordinates and converts them into searchable events (e.g., “PD at 35-yard line”).
- Video Tagging: Cloud-based tools automatically clip video segments associated with every PD, allowing coaches to review the technical execution of a play instantly on a tablet from the sidelines.
- Scouting Algorithms: For recruitment, PD data is aggregated across thousands of players. Software like WyScout allows scouts to filter for players with high “PD-per-target” ratios, identifying undervalued defensive assets through algorithmic sorting.
AI and Predictive Modeling: Moving from Raw PD to Tactical Intelligence

The frontier of football technology lies in Artificial Intelligence and Machine Learning (ML). In this context, PD is not just a historical record; it is a feature used to train neural networks that simulate game outcomes and player development.
Neural Networks and Win Probability
AI models use historical PD data to calculate “Win Probability” in real-time. By analyzing thousands of past games, an AI can determine how a specific Point Differential at halftime correlates with the final outcome. For broadcasters and betting tech companies, this data is used to generate “live-odds” and engagement graphics. The tech calculates the “expected PD” based on the current field position and player matchups, providing a deeper layer of digital storytelling.
Defensive Efficiency Modeling
In American football, “Passes Defended” is a key input for “Expected Points Added” (EPA) models. Tech firms like Pro Football Focus (PFF) use proprietary software to grade every play. A PD is weighted based on its difficulty and its impact on the drive. Was the PD on a third-down play? Did it occur in the “red zone”? Machine learning algorithms assign a “value added” score to the PD, allowing front offices to use data-driven evidence when negotiating player contracts or drafting new talent.
Simulation and Virtual Reality (VR)
PD data is also being integrated into VR training environments. By using the spatial data from a real-life PD event, developers can recreate that exact scenario in a 360-degree virtual environment. Quarterbacks can use VR headsets to practice throwing against a “digital twin” of a defender who has a high PD rating. The software simulates the defender’s reach and reaction time based on their real-world data, providing a high-tech training tool that reduces physical wear and tear.
Data Security and Proprietary Intelligence
As PD and other performance metrics become more valuable, the technology used to secure this data has become a priority for football organizations. The “arms race” in sports tech is as much about digital security as it is about data collection.
Encryption and Cloud Security
The data transmitted from a player’s wearable sensor to the coach’s tablet is often encrypted to prevent “data poaching.” Since a team’s tactical PD analysis is a competitive advantage, organizations utilize private cloud instances and multi-factor authentication to protect their analytics dashboards. The loss of proprietary PD models to a competitor would be equivalent to a corporate data breach in the tech industry.
The Ethics of Data Ownership
The rise of PD tracking has also sparked a technological debate regarding data ownership. Who owns the “Passes Defended” data—the player, the league, or the tech company that manufactured the sensor? As biometric data becomes more integrated with performance metrics, we are seeing the emergence of “Digital Identity” platforms for athletes. These blockchain-based or secure database solutions allow players to carry their verified PD and performance data from one club to another, ensuring data integrity throughout their careers.
The Future of Football Tech: Real-Time Integration and AR
The trajectory of football technology suggests that PD will soon move from a post-game stat to a real-time augmented reality (AR) experience. We are entering an era where the digital and physical worlds of football are indistinguishable.
Augmented Reality for Fans and Coaches
Imagine a coach wearing AR glasses on the sideline. As a play unfolds, the software overlays the “reach zone” of a defender, indicating the statistical probability of a PD occurring in a specific area. For fans, mobile apps utilizing 5G connectivity will allow them to point their phones at the pitch and see a player’s PD season average hovering above their head in real-time. This level of tech integration turns the stadium into a giant, interactive data visualization.
Automated Tactical Adjustments
The next generation of football software will likely involve “Automated Tactical Suggestions.” By processing real-time PD data, an AI coach could suggest a personnel change if it detects that a defender’s “closing speed” is dropping, thereby reducing the probability of a successful Pass Defended. This real-time loop of data collection, AI analysis, and tactical execution represents the pinnacle of sports technology.
In conclusion, “PD” in football is far more than a simple abbreviation on a spreadsheet. It is a vital component of the modern sports tech stack. From the computer vision cameras that capture the action to the AI models that predict the future, PD serves as the bridge between raw athletic performance and actionable digital intelligence. As software continues to eat the world, it is clear that it has also taken a permanent seat on the football sidelines, transforming the game into a high-stakes arena of data science and technological innovation.
aViewFromTheCave is a participant in the Amazon Services LLC Associates Program, an affiliate advertising program designed to provide a means for sites to earn advertising fees by advertising and linking to Amazon.com. Amazon, the Amazon logo, AmazonSupply, and the AmazonSupply logo are trademarks of Amazon.com, Inc. or its affiliates. As an Amazon Associate we earn affiliate commissions from qualifying purchases.