
In the intricate world of investing, understanding how to measure the performance of your assets is paramount. For investors in mutual funds and exchange-traded funds (ETFs), one of the most fundamental metrics for evaluating a fund’s performance is its Net Asset Value (NAV) return. This seemingly simple percentage figure encapsulates the overall growth or decline of an investment over a period, providing a crucial lens through which to assess a fund’s efficacy. Delving into NAV return requires an initial understanding of its foundational component: Net Asset Value itself.
Understanding Net Asset Value (NAV)
Before dissecting NAV return, it’s essential to grasp the concept of Net Asset Value (NAV). At its core, NAV represents the per-share value of a mutual fund or ETF. It is a direct reflection of the underlying assets held by the fund, minus its liabilities, divided by the total number of outstanding shares.
Definition of NAV
The calculation of NAV is straightforward:
$$ text{NAV} = frac{text{Total Value of Fund’s Assets} – text{Total Value of Fund’s Liabilities}}{text{Total Number of Outstanding Shares}} $$
For open-end mutual funds, the NAV is typically calculated once a day, at the close of the financial markets. This daily NAV is the price at which investors buy shares from the fund company and redeem them. For ETFs, while an official NAV is also calculated daily, their shares trade on exchanges throughout the day, and their market price can deviate slightly from their NAV due to supply and demand dynamics, though arbitrage mechanisms usually keep them closely aligned. The assets include all investments like stocks, bonds, cash, and other securities, while liabilities encompass expenses such as management fees, administrative costs, and other operational outgoings.
Why NAV Matters
NAV is critically important because it provides a standardized way to value a fund’s holdings and determine its intrinsic worth per share. For mutual fund investors, it dictates the purchase and redemption price. If you invest $1,000 into a mutual fund with an NAV of $10, you would acquire 100 shares. When you decide to sell your shares, the redemption price will also be based on the prevailing NAV at market close on the day your order is placed.
Calculation Basics
The daily calculation of NAV is a rigorous process undertaken by the fund’s administrator. It involves valuing all securities in the fund’s portfolio at their current market prices, tallying up all income (like dividends and interest), subtracting accrued expenses, and then dividing by the total shares outstanding. This process ensures transparency and fairness, as all investors buying or selling on a given day do so at the same, objective price.
Deconstructing NAV Return
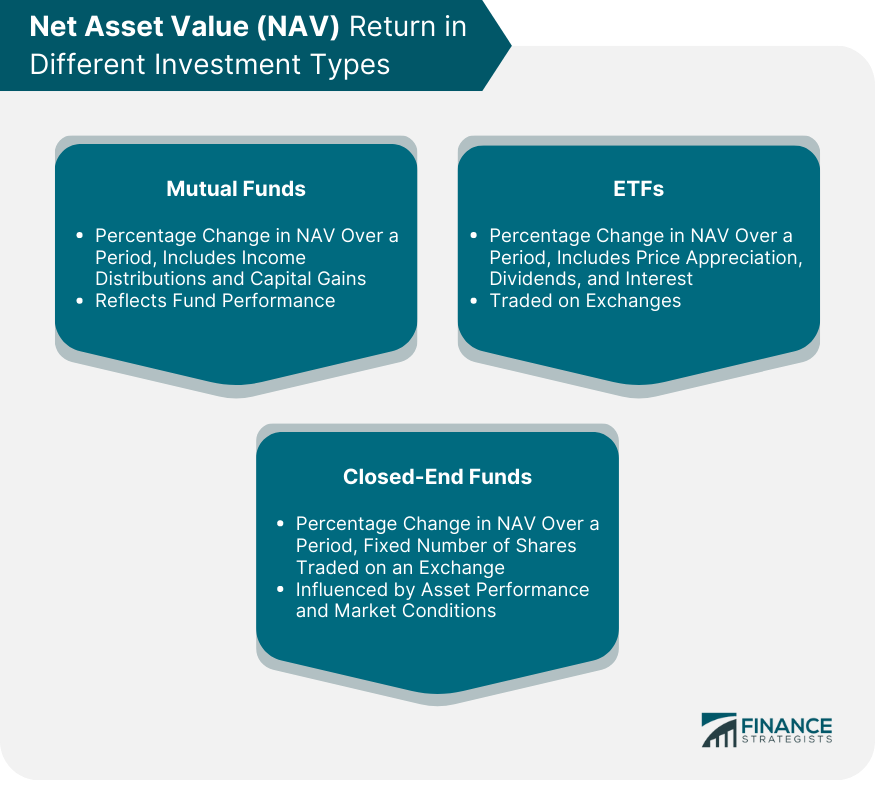
NAV return, also known as total return based on NAV, is the most accurate measure of a fund’s performance over a specific period. It takes into account all sources of profit and loss that a fund generates, providing a comprehensive picture of its investment success.
Definition of NAV Return
NAV return is the percentage change in a fund’s NAV over a specified period, typically one month, three months, one year, three years, five years, or since inception. It essentially tells investors how much their investment in the fund has grown or shrunk during that timeframe, assuming all distributions (dividends and capital gains) were reinvested back into the fund. This “total return” perspective is crucial because it captures the full economic benefit an investor would have received.
Components of Return
A fund’s NAV return is driven by three primary components:
- Capital Appreciation/Depreciation: This is the most intuitive component, representing the increase or decrease in the market value of the underlying stocks, bonds, or other securities held by the fund. If the fund’s portfolio holdings perform well, their collective value rises, increasing the fund’s NAV.
- Income Distributions: Funds that hold income-generating assets, such as dividend-paying stocks or interest-bearing bonds, will periodically receive income. This income is then passed on to shareholders, usually as dividends.
- Capital Gains Distributions: When a fund manager sells securities from the portfolio at a profit, these gains are often distributed to shareholders. These are distinct from capital appreciation within the portfolio, as they represent realized profits.
Formula for NAV Return
While complex algorithms handle the precise calculations, the conceptual formula for NAV total return for a period (assuming reinvestment of distributions) can be simplified as:
$$ text{NAV Return} = frac{(text{Ending NAV} – text{Beginning NAV} + text{Distributions Per Share})}{text{Beginning NAV}} times 100% $$
Here, “Distributions Per Share” includes all dividends and capital gains distributed during the period, adjusted per share. This formula ensures that the calculation reflects the full benefit an investor would receive if they held the shares and reinvested all payouts, rather than just the change in the share price.
Importance for Investors
For investors, NAV return is a critical metric for several reasons. It allows them to:
- Assess Fund Performance: Directly compare how well one fund has performed against another, or against its benchmark index.
- Evaluate Management Effectiveness: Gauge the skill and strategy of the fund manager.
- Track Investment Growth: Understand the real growth of their capital over time, factoring in all forms of return.
It’s important to note that NAV return is typically reported before any sales charges (loads) an investor might pay and before personal taxes.
Factors Influencing NAV Return
The NAV return of a fund is not an isolated number; it’s a dynamic figure influenced by a multitude of internal and external factors. Understanding these influences can help investors make more informed decisions and set realistic expectations.
Market Performance
The broader market environment plays a dominant role in determining a fund’s NAV return. A bull market, characterized by rising stock prices, generally provides a favorable tailwind for equity funds, while a bear market can lead to significant declines. Similarly, interest rate movements, inflation expectations, and economic growth forecasts can profoundly impact bond funds and other fixed-income instruments. Sector-specific trends can also heavily influence funds concentrated in particular industries. For instance, a technology fund’s NAV return will be highly sensitive to the performance of the tech sector.
Fund Management & Strategy
The expertise and decisions of the fund management team are critical. Their investment strategy—whether it’s growth, value, income, sector-specific, or a blend—directly impacts the types of securities held and, consequently, the fund’s performance under various market conditions. Skilled managers can identify undervalued assets, make timely trades, and effectively manage risk, potentially leading to superior returns. Conversely, poor investment choices or a strategy that performs poorly in the prevailing market can drag down NAV returns. Asset allocation decisions, such as the mix of stocks, bonds, and cash, also significantly shape the fund’s risk-return profile.
Fund Expenses (Expense Ratio)
All funds incur operating expenses, which are deducted from the fund’s assets before the NAV is calculated. These expenses include management fees, administrative costs, legal fees, and marketing expenses, collectively expressed as the “expense ratio.” A higher expense ratio means a larger portion of the fund’s gross returns is consumed by fees, directly reducing the net NAV return available to investors. For example, if a fund generates a 10% gross return but has an expense ratio of 1.5%, the net return before taxes for investors is 8.5%. Over long periods, even small differences in expense ratios can lead to substantial differences in overall investment growth.
Distributions
The timing and amount of income and capital gains distributions can also influence the reported NAV return, especially if investors don’t consider total return. When a fund distributes income or capital gains, its NAV per share decreases by the amount of the distribution. If these distributions are not reinvested, they effectively “drain” value from the fund’s NAV. However, as noted, NAV return is typically calculated as total return, assuming reinvestment, to provide a consistent and comprehensive measure of performance.
Fund Size and Liquidity
While less direct, a fund’s size and the liquidity of its holdings can sometimes play a role. Very large funds might find it challenging to invest in smaller, less liquid opportunities that could offer higher returns without significantly impacting market prices. Conversely, funds investing in illiquid assets might face difficulties or higher transaction costs when buying or selling, which can indirectly affect performance and thus NAV return.
Types of NAV Returns and Reporting
Understanding how NAV returns are reported and analyzed is crucial for investors comparing funds and making long-term decisions. Not all return figures are created equal, and context is key.
Total Return
When financial professionals and fund companies discuss “NAV return,” they almost invariably mean total return. Total return is the most comprehensive measure of a fund’s performance because it accounts for two key elements: the change in the market price of the fund’s shares (or NAV for mutual funds) and any income distributions (like dividends and interest) or capital gains distributions paid out to shareholders. Critically, total return assumes that all these distributions are reinvested back into the fund, allowing for compounding growth. This provides the most accurate reflection of the economic benefit an investor would have received from holding the fund. Without considering total return, an investor might mistakenly think a fund performed poorly if its NAV price barely moved, even if it paid substantial dividends.
Time Periods
Fund performance is typically reported over various standardized time periods to provide a balanced perspective. Common reporting periods include:
- One-year return: Useful for assessing recent performance but highly susceptible to short-term market fluctuations.
- Three-year, five-year, and ten-year returns: These longer periods offer a more reliable indicator of a fund’s consistent performance through different market cycles, reflecting the fund manager’s strategy over time.
- Since Inception return: Shows the fund’s performance from its very beginning, offering a complete historical overview.
It is imperative to compare returns over identical periods when evaluating different funds or a fund against its benchmark. Comparing a 3-year return of one fund to a 5-year return of another would be misleading.
Annualized Returns
For periods longer than one year (e.g., 3-year, 5-year, 10-year returns), the reported figures are often annualized. Annualized return expresses the average geometric rate of return per year over the specified multi-year period, allowing for an “apples-to-apples” comparison with single-year returns or other investments. For example, a fund might report a 3-year total return of 33.10%, which annualizes to approximately 10% per year, illustrating the compounding effect. Annualization makes long-term performance data more digestible and comparable across different durations.
Tax Implications
While NAV return typically focuses on the gross performance of the fund, investors must remember the tax implications of their investments. Income dividends and capital gains distributions, even if reinvested, are generally taxable events in the year they are distributed, unless the investment is held in a tax-advantaged account like a 401(k) or IRA. The “after-tax return” can be significantly lower than the reported NAV total return, especially for funds with high turnover or those generating substantial income. Investors should consult tax professionals to understand how distributions impact their individual tax situation.
Using NAV Return in Investment Decisions
NAV return is a powerful tool, but like any financial metric, it must be used thoughtfully and in conjunction with other considerations to make sound investment decisions.
Comparison with Benchmarks
One of the primary uses of NAV return is to compare a fund’s performance against a relevant market benchmark. A benchmark is an unmanaged index that represents a specific market segment or asset class (e.g., S&P 500 for large-cap U.S. equities, Bloomberg U.S. Aggregate Bond Index for investment-grade bonds). If a fund consistently outperforms its benchmark over various periods, it suggests strong management and a potentially effective strategy. Conversely, consistent underperformance might indicate issues with the fund’s management or strategy, or simply that the fund is expensive relative to its peers.
Peer Group Analysis
Beyond benchmarks, investors should also compare a fund’s NAV return to that of its peer group—other funds with similar investment objectives, strategies, and asset allocations. For instance, if you are evaluating a growth-oriented large-cap equity fund, you would compare its NAV return to other growth-oriented large-cap equity funds. This analysis helps determine if the fund is performing competitively within its specific niche. Tools and financial platforms often provide peer group rankings to facilitate this comparison.
Risk vs. Return
It’s crucial to evaluate NAV return in the context of the fund’s risk profile. A fund might boast impressive returns, but if those returns were achieved by taking on excessive risk or experiencing extreme volatility, it might not be suitable for all investors. Metrics such as standard deviation, beta, and Sharpe ratio should be considered alongside NAV return to understand the risk-adjusted performance. A fund that generates solid returns with lower volatility might be more attractive than one with slightly higher returns but significantly higher risk.
Long-Term Perspective
While short-term NAV returns can be engaging, relying solely on them for investment decisions is perilous. Market conditions can cause significant fluctuations over short periods. A fund that had an exceptional year might be an anomaly, or one that had a poor year might be experiencing a temporary setback. Focusing on long-term (3, 5, 10 years, or since inception) annualized NAV returns provides a more robust indication of a fund’s ability to generate consistent growth and navigate various economic cycles. Remember the ubiquitous disclaimer: “Past performance is not indicative of future results,” but consistent long-term performance, especially relative to benchmarks and peers, can speak to the quality of management and strategy.

Limitations
While highly informative, NAV return has limitations. It generally does not account for:
- Sales charges (loads): Upfront or deferred sales charges paid by investors directly reduce the actual return an individual investor realizes.
- Personal taxes: As discussed, the reported return is pre-tax.
- Inflation: While capital appreciation helps offset inflation, the reported return is a nominal figure, not adjusted for the erosion of purchasing power.
Investors must factor these additional costs and impacts into their personal calculations to derive their true net return.
In conclusion, NAV return is a cornerstone metric for evaluating the performance of mutual funds and ETFs. By understanding its components, the factors that influence it, and how to interpret it correctly, investors can gain deeper insights into their investments, make more informed choices, and ultimately work towards achieving their financial goals.
aViewFromTheCave is a participant in the Amazon Services LLC Associates Program, an affiliate advertising program designed to provide a means for sites to earn advertising fees by advertising and linking to Amazon.com. Amazon, the Amazon logo, AmazonSupply, and the AmazonSupply logo are trademarks of Amazon.com, Inc. or its affiliates. As an Amazon Associate we earn affiliate commissions from qualifying purchases.