
The Dow Jones Industrial Average (DJIA), often referred to simply as “the Dow,” is the most recognized stock market index in the world. For over a century, it has served as the primary barometer for the health of the United States economy and the broader financial markets. When investors ask, “What is the highest the Dow Jones has ever been?” they are usually looking for a specific number that represents a moment of peak economic optimism. As of mid-2024, that milestone sits comfortably above the 40,000-point mark, a level that seemed unimaginable only a few decades ago.

Understanding the highest peaks of the Dow Jones requires more than just looking at a chart. It involves analyzing the confluence of corporate earnings, Federal Reserve policy, technological innovation, and global geopolitical stability. The journey from its humble beginnings in 1896 to the record-breaking heights of today provides a masterclass in the resilience of capital markets and the compounding power of industrial growth.
The Milestone of 40,000: A New Era for the Dow Jones
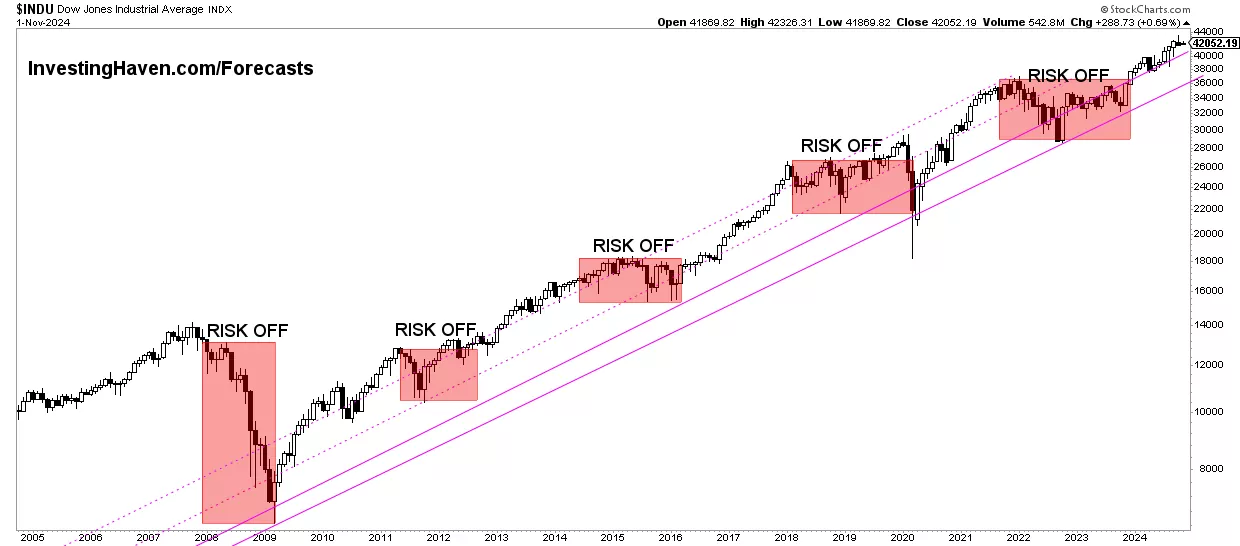
In May 2024, the Dow Jones Industrial Average achieved a historic milestone by crossing the 40,000-point threshold for the first time in history. This achievement was not merely a psychological victory for traders but a reflection of a robust recovery following the volatility of the early 2020s. The surge to 40,000 was driven by several key factors, including cooling inflation data, strong corporate earnings from blue-chip giants, and the growing influence of artificial intelligence on the productivity of legacy industrial and financial firms.
To put this record in perspective, the Dow took nearly 80 years to reach its first 1,000-point milestone in 1972. The jump from 30,000 to 40,000 took significantly less time, illustrating the accelerating nature of market gains in an era of high-frequency trading and massive liquidity. When the Dow hits an all-time high, it signals that the 30 large-cap, publicly owned companies that comprise the index are, on average, valued more highly by the market than ever before.
The Components Driving Record Highs
The Dow is a price-weighted index, meaning companies with higher stock prices have a greater impact on the index’s total value. In recent years, the move toward record highs has been spearheaded by heavyweights such as UnitedHealth Group, Goldman Sachs, Microsoft, and Home Depot. Unlike the S&P 500, which is market-cap weighted, the Dow’s movement is highly sensitive to the individual price action of these 30 “blue-chip” stocks. When these industry leaders report record profits or expand their margins, the Dow naturally gravitates toward new all-time highs.
Nominal vs. Inflation-Adjusted Highs
While the nominal highest point of the Dow is the figure most often cited in the news, seasoned investors often look at inflation-adjusted values. A record high in 2024 does not have the same purchasing power as a record high in the 1960s. However, even when adjusted for inflation, the current era of the Dow Jones represents one of the most significant periods of wealth creation in history. The index’s ability to consistently outpace inflation over the long term is why it remains a cornerstone of retirement portfolios and institutional investments.
A History of Major Milestones and Recoveries
The path to the highest Dow Jones levels has never been a straight line. The index is defined by its peaks, but those peaks are often separated by periods of significant contraction. Studying the history of these record highs provides investors with the context needed to navigate modern market volatility.
The Roaring Twenties and the 381 Peak
Before the Great Depression, the Dow reached what was then a staggering high of 381.17 in September 1929. This peak represented the ultimate expression of post-WWI optimism and industrial expansion. After the crash of 1929, it would take the index 25 years—until 1954—to reclaim that high and surpass it. This period remains a stark reminder that while the Dow eventually reaches new highs, the duration between those peaks can be extensive.
The 10,000 Mark and the Dot-Com Bubble
The 1990s were characterized by the rapid adoption of the internet and a massive influx of retail capital into the markets. The Dow crossed the 10,000-point mark for the first time in March 1999. This was a watershed moment for personal finance, as the “Main Street” investor became more engaged with the stock market than ever before. Although the index would suffer during the subsequent dot-com crash and the 2008 financial crisis, each recovery eventually led to a new record high that eclipsed the previous one.
The Post-2008 Bull Market
The period between 2009 and 2020 represents one of the longest bull markets in history. During this time, the Dow moved from lows of around 6,500 to over 29,000. This era was defined by low interest rates and massive share buyback programs by Dow components. The record highs achieved during this decade were supported by a shift in the index’s composition, as older, struggling industrial firms were replaced by high-growth tech and healthcare companies, ensuring the index remained relevant to the modern economy.
The Catalysts Behind All-Time Highs
What causes the Dow Jones to reach its highest points? It is rarely a single event. Instead, it is a combination of macroeconomic conditions and microeconomic performance. For the Dow to hit a record, the collective outlook of the 30 constituent companies must be overwhelmingly positive.
Monetary Policy and Interest Rates
The Federal Reserve plays a pivotal role in the Dow’s ascent. Generally, the market reaches new highs when interest rates are stable or falling, as lower borrowing costs boost corporate profits and make equities more attractive compared to fixed-income assets. In the lead-up to the 40,000 milestone, market participants were closely watching the Fed’s signals regarding “pivot” points. The anticipation of a more accommodative monetary policy often acts as the fuel that pushes the index past previous resistance levels.
Corporate Earnings and Innovation
At its core, the Dow Jones is a reflection of corporate America’s ability to generate profit. Record highs are almost always accompanied by “earnings beats,” where companies like Apple or Visa report higher-than-expected revenue. Furthermore, innovation—such as the integration of AI into software or the transition to renewable energy in the industrial sector—allows these companies to find new efficiencies. These efficiencies translate to higher stock prices, which in turn push the price-weighted Dow to new heights.
Global Stability and Trade
As a collection of multinational corporations, the Dow is sensitive to global trade dynamics. When international tensions ease or trade agreements are solidified, companies like Boeing, Caterpillar, and Coca-Cola see their global prospects improve. Historical peaks in the Dow often coincide with periods of relative global stability, where the flow of goods and services is unencumbered by major geopolitical strife.
The Psychology of Investing at Market Highs
When the Dow Jones hits its highest level ever, it triggers a unique psychological response in the investing public. For some, a record high is a signal of a “top,” leading to fear of an imminent crash. For others, it is a confirmation of a strong trend, leading to “fear of missing out” (FOMO).
The Danger of Timing the Market
Many investors make the mistake of sitting on the sidelines when the Dow hits a record high, waiting for a “dip” that may not come for months or years. Historically, the Dow often hits a record high and then continues to hit dozens more over the following year. In a growing economy, the market spends a significant amount of time at or near all-time highs. Professional financial advisors often stress that “time in the market” is more important than “timing the market,” as missing out on the initial breakout to a record high can result in significant lost gains.
Risk Management and Diversification
While the Dow Jones represents the pinnacle of blue-chip stability, reaching a record high is often a good time for investors to rebalance their portfolios. When the index is at its highest, the weight of equities in a personal portfolio may have grown beyond an individual’s risk tolerance. Rebalancing involves selling some of the winners to maintain a diversified allocation across bonds, international stocks, and small-cap companies. This ensures that if the Dow does retreat from its peak, the investor’s total capital is protected by other asset classes.

Looking Forward: The Path to 50,000
The question of “what is the highest the Dow Jones has ever been” is one that is constantly being updated. As the index maintains its trajectory above 40,000, analysts are already looking toward the next psychological barrier: 50,000.
The future growth of the Dow Jones will likely depend on the continued digital transformation of its components. We are seeing traditional companies like JPMorgan Chase and Walmart invest billions into technology to compete with younger, more nimble firms. As these legacy companies evolve, their valuations are likely to expand, providing the necessary momentum for the Dow to continue its century-long trend of upward mobility.
While the Dow Jones Industrial Average is only a snapshot of 30 companies, its journey to record highs serves as a testament to the enduring power of the American economy. Each record high represents a moment where innovation, capital, and labor successfully converged to create value. For the long-term investor, the highest point the Dow has ever reached is not a ceiling, but rather a floor for the next stage of economic growth. Whether the index is at 10,000, 40,000, or 50,000, the underlying principle remains the same: the market’s capacity for growth is driven by the human drive for progress and the constant pursuit of corporate excellence.
aViewFromTheCave is a participant in the Amazon Services LLC Associates Program, an affiliate advertising program designed to provide a means for sites to earn advertising fees by advertising and linking to Amazon.com. Amazon, the Amazon logo, AmazonSupply, and the AmazonSupply logo are trademarks of Amazon.com, Inc. or its affiliates. As an Amazon Associate we earn affiliate commissions from qualifying purchases.