
In the vast and often complex world of financial markets, understanding key indicators is paramount for investors, business professionals, and anyone seeking to grasp the broader economic landscape. Among the most frequently cited and influential barometers are the Dow Jones Industrial Average (DJIA) and the Nasdaq Composite. While both serve as vital snapshots of market performance, they represent distinct facets of the economy, employ different methodologies, and provide unique insights into the health and direction of specific sectors. To truly navigate the investment arena, it’s essential to demystify these powerful indices, exploring their origins, compositions, and the crucial roles they play in shaping financial narratives.

Understanding Stock Market Indices: A Foundation
Before delving into the specifics of the Dow and Nasdaq, it’s helpful to understand the fundamental concept of a stock market index. An index is essentially a statistical measure that tracks the performance of a basket of stocks, designed to represent a particular market, sector, or segment of the economy. Instead of analyzing every single stock, an index offers a convenient and widely accepted proxy for the overall trend of a specific market slice.
The Purpose of Market Indices
Market indices serve multiple critical functions. Primarily, they act as benchmarks against which investors can measure the performance of their own portfolios. If your portfolio aims to track the broader market, you might compare its returns to a relevant index like the S&P 500 or Nasdaq Composite. Secondly, indices provide a clear and concise way to communicate the general direction and health of the economy or specific industries. A rising index often signals investor confidence and economic growth, while a falling index can indicate concerns or downturns. Thirdly, indices form the basis for various financial products, such as index funds and exchange-traded funds (ETFs), which allow investors to gain exposure to a diversified basket of stocks without having to buy each one individually. They simplify complex market data into digestible trends, making it easier for analysts, policymakers, and the general public to understand market sentiment and economic shifts.
How Indices Reflect Market Health
The methodology behind an index dictates how accurately it reflects market health. By selecting a representative group of companies and applying a specific weighting scheme (e.g., price-weighted, market-capitalization-weighted), an index attempts to capture the aggregate sentiment and performance. When the component stocks perform well, the index rises, indicating positive market momentum. Conversely, when the components struggle, the index falls. This aggregated view allows for a macro-level assessment, providing insights into investor confidence, corporate earnings, interest rate expectations, and various other economic factors that influence stock prices. However, it’s also crucial to remember that indices are mathematical constructs; while powerful, they offer a stylized view and may not perfectly capture every nuance of the underlying market.
The Dow Jones Industrial Average (DJIA): A Historical Bellwether
The Dow Jones Industrial Average, often simply referred to as “the Dow,” is arguably the most recognized and oldest stock market index in the world. Established in 1896 by Charles Dow and Edward Jones, it has a rich history that parallels the growth and evolution of American industry.
A Legacy of Industrial Giants
Initially, the DJIA comprised 12 companies, predominantly representing heavy industries such as railroads, sugar, and tobacco. Over its more than a century-long existence, its composition has evolved dramatically, reflecting shifts in the American economy from manufacturing to technology and services. Despite its name, the DJIA is no longer exclusively focused on “industrial” companies in the traditional sense. Today, it includes a diverse array of blue-chip companies from various sectors, such as technology (Apple, Microsoft), financial services (JPMorgan Chase), healthcare (Johnson & Johnson), and consumer goods (Coca-Cola). This evolution ensures its continued relevance as a proxy for the broader health of the U.S. economy’s most established and influential corporations.
Price-Weighted Methodology Explained
What sets the DJIA apart from many other major indices is its unique price-weighted methodology. In a price-weighted index, stocks with higher share prices have a greater impact on the index’s value than stocks with lower share prices, regardless of their total market capitalization. This means that a one-dollar change in a high-priced stock will move the Dow more than a one-dollar change in a low-priced stock. This approach is a remnant of its historical origins, predating the sophisticated market-capitalization weighting used by most modern indices. To maintain consistency amidst stock splits and other corporate actions, the DJIA employs a “Dow Divisor,” a dynamically adjusted number that ensures the index’s continuity. This methodology means that a company’s influence on the Dow is not necessarily proportional to its size in the economy, which is a common point of criticism but also part of its distinct character.
Who Makes Up the Dow? (Composition and Changes)
The DJIA consists of 30 large, publicly owned companies based in the United States. These are often referred to as “blue-chip” stocks due to their reputation for stability, robust financial health, and established market presence. The selection process is not governed by a strict set of quantitative rules but rather by a committee from S&P Dow Jones Indices, which aims to select companies that are leaders in their respective industries and have a strong track record of sustained growth and investor interest. Changes to the Dow’s composition are relatively infrequent but occur when a company’s economic relevance diminishes, or a new company better represents a significant sector of the economy. Such changes can have a significant impact on investor sentiment and the index’s immediate performance.
Interpreting the Dow’s Movements
Given its price-weighted nature and focus on 30 large companies, the Dow is often seen as a barometer for the overall sentiment towards large, established U.S. corporations. Its movements are closely watched for insights into investor confidence in corporate America. A significant rise in the Dow is generally interpreted as a sign of economic strength and corporate profitability, while a sharp decline can signal economic concerns or uncertainty. While it provides a valuable snapshot, some critics argue that its limited number of components and price-weighting can sometimes provide a less comprehensive view of the entire market compared to broader, market-capitalization-weighted indices.
The Nasdaq Composite and Nasdaq 100: The Innovation Barometer
In stark contrast to the Dow’s venerable history and focus on industrial stalwarts, the Nasdaq (National Association of Securities Dealers Automated Quotations) Exchange and its associated indices are synonymous with innovation, technology, and growth companies.
Birth of an Electronic Marketplace
Launched in 1971, Nasdaq was the world’s first electronic stock market. Its creation revolutionized trading by automating the buying and selling of securities, doing away with the traditional trading floors. This technological advancement attracted a new generation of companies, particularly those in the burgeoning tech sector, that valued efficiency and direct access to capital. Over the decades, Nasdaq grew to become the second-largest stock exchange globally by market capitalization, behind only the New York Stock Exchange (NYSE). Its electronic nature facilitated faster trades, greater transparency, and lower costs, making it a preferred listing venue for many innovative and fast-growing businesses.
Market-Capitalization-Weighted Approach
Unlike the Dow, the Nasdaq Composite and Nasdaq 100 employ a market-capitalization-weighted methodology. This means that companies with larger market capitalizations (share price multiplied by the number of outstanding shares) have a greater impact on the index’s performance than smaller companies. If Apple, a giant with an immense market cap, sees a significant price movement, it will exert a far greater influence on the Nasdaq’s value than a smaller company, even if that smaller company experiences a larger percentage gain. This methodology is generally considered to be a more accurate reflection of the overall market’s value, as it gives proportional weight to the largest companies, which represent a larger share of total market wealth.
The Nasdaq Composite: A Broad Tech Index
The Nasdaq Composite Index is a comprehensive measure that includes almost all stocks listed on the Nasdaq Stock Market. It’s renowned for its heavy concentration of technology and growth-oriented companies, though it does include firms from other sectors. As such, it is widely regarded as an excellent gauge for the performance of the technology sector, biotechnology, internet, and other high-growth industries. Its movements are closely watched by investors interested in innovative companies and the future direction of technological advancements. The Composite’s breadth, encompassing thousands of companies, provides a broad view of the innovation economy.
The Nasdaq 100: Focusing on Non-Financial Powerhouses
A sub-index of the Nasdaq Composite, the Nasdaq 100 is even more specialized. It comprises the 100 largest non-financial companies listed on the Nasdaq Stock Market. By excluding financial companies (such as banks and investment firms), the Nasdaq 100 provides an even purer focus on the technology and growth sectors. Giants like Apple, Microsoft, Amazon, Google (Alphabet), and Meta Platforms (Facebook) are prominent components. This index is particularly popular among investors seeking exposure to the leading edge of technology and innovation, and it often exhibits higher volatility compared to broader market indices due to its concentrated focus on growth stocks, which can be more sensitive to economic shifts and investor sentiment.
The Dot-Com Era and Beyond: Nasdaq’s Volatility
The Nasdaq has a history of reflecting both the immense potential and the inherent volatility of growth sectors. The late 1990s dot-com bubble saw the Nasdaq Composite surge to unprecedented highs, only to experience a dramatic crash in the early 2000s when many overvalued internet companies failed. This period highlighted the risks associated with investing heavily in nascent industries. However, the Nasdaq has since demonstrated remarkable resilience and continued growth, driven by the emergence of truly transformative technology companies. Its performance remains a key indicator for understanding investor appetite for risk and the valuation of future-oriented businesses.
Key Differences and Complementary Roles
While both the Dow Jones and Nasdaq indices are crucial for understanding market dynamics, their distinct characteristics make them complementary rather than interchangeable.
Weighting Methodologies: Price vs. Market Cap
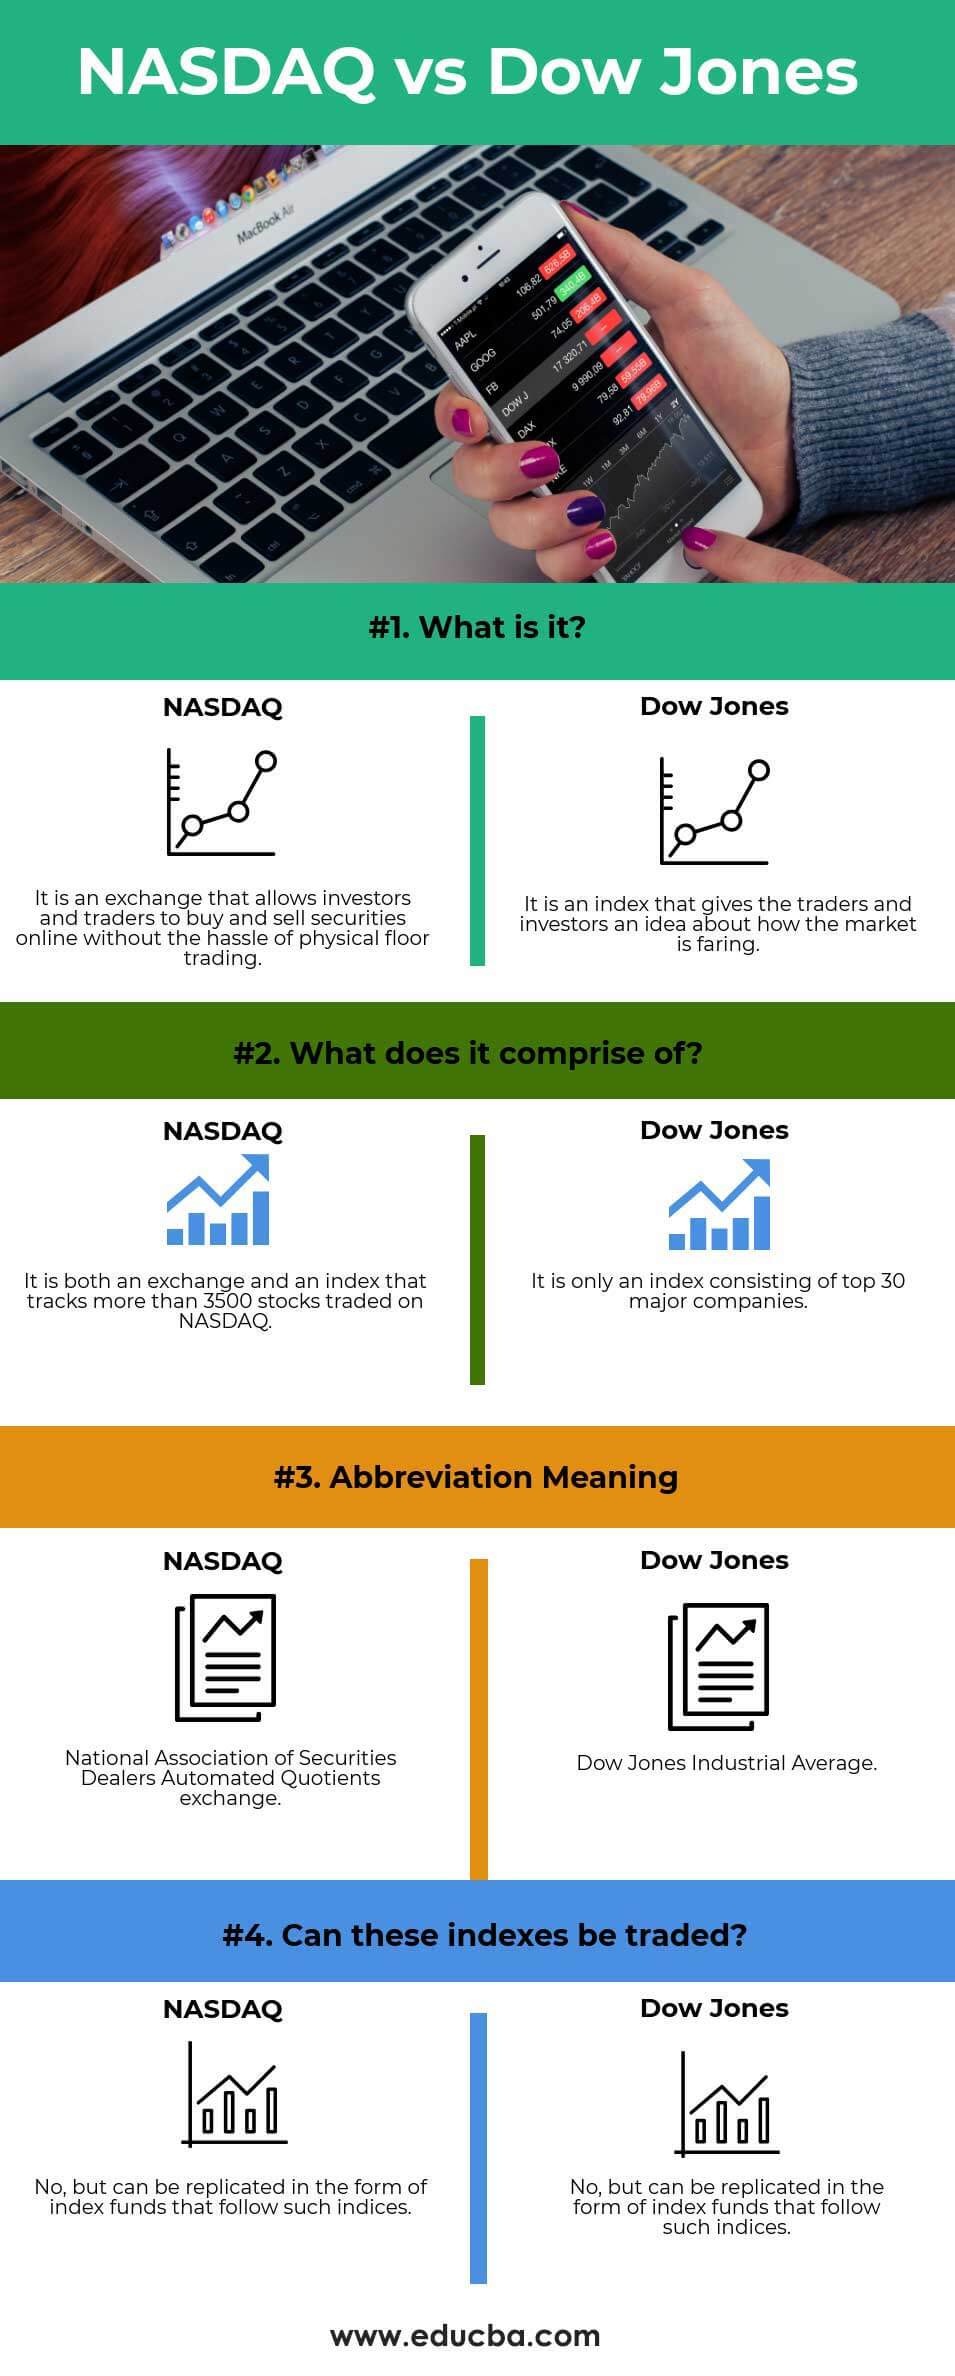
The most fundamental difference lies in their weighting methodologies. The Dow’s price-weighting means higher-priced stocks have a greater impact, irrespective of their company’s size. In contrast, Nasdaq’s market-capitalization weighting ensures that larger companies, those with the highest total market value, exert the most influence on the index’s movements. This distinction is critical because it means a relatively small company with a high stock price could move the Dow more than a tech giant with a lower stock price, whereas on Nasdaq, the tech giant’s influence would be dominant.
Industry Focus: Blue-Chips vs. Growth Tech
Their industry focus also varies significantly. The Dow is largely a collection of established, blue-chip companies across diverse sectors, representing the traditional pillars of the American economy. While it includes some tech giants, its overall composition leans towards stability and mature industries. The Nasdaq, particularly the Nasdaq 100, is heavily concentrated in technology and growth-oriented companies, making it a proxy for innovation and future economic trends. This makes the Dow a good gauge for “old economy” health and the Nasdaq for “new economy” vitality.
Number of Components and Market Breadth
The sheer number of components also sets them apart. The DJIA tracks a very select group of 30 companies, offering a concentrated view. The Nasdaq Composite, by including thousands of companies listed on the Nasdaq exchange, provides a much broader perspective on the overall market, albeit one heavily skewed towards technology. The Nasdaq 100, while also focused on 100 companies, still offers a broader and more market-cap weighted view within its specific niche than the Dow.
Their Combined Narrative of the Economy
Individually, each index tells a story; together, they offer a more complete narrative of the U.S. economy. The Dow can reflect the performance of established corporations and overall industrial strength, while the Nasdaq highlights the vibrancy and growth potential of the innovation sector. When both indices are moving in tandem, it suggests broad market strength or weakness. Divergences, such as the Dow rising while the Nasdaq falls, can signal a shift in market preference from growth stocks to value stocks, or vice versa, providing crucial insights into prevailing investor sentiment and economic conditions.
Why Dow Jones and Nasdaq Matter to Investors and the Economy
The significance of the Dow Jones and Nasdaq extends far beyond their roles as mere statistical measures; they are integral to investment strategy, economic forecasting, and public perception of financial health.
Benchmarking Portfolio Performance
For individual and institutional investors, these indices serve as essential benchmarks. If an investor holds a diversified portfolio, they might compare its returns against the DJIA to gauge how well their blue-chip holdings are performing, or against the Nasdaq 100 if their portfolio is tech-heavy. This comparison helps investors assess the effectiveness of their strategies, identify areas for improvement, and understand whether their investments are outperforming or underperforming the broader market or specific sectors.
Economic Indicators and Sentiment
Beyond individual portfolios, the movements of the Dow and Nasdaq are widely interpreted as leading economic indicators. A sustained upward trend often signals robust corporate earnings, consumer confidence, and overall economic expansion. Conversely, prolonged declines can presage recessions or periods of economic uncertainty. Policymakers, economists, and central bankers closely monitor these indices to assess the health of financial markets and the broader economy, often influencing monetary policy decisions and government actions. They are also powerful psychological indicators, influencing public and business sentiment.
Guiding Investment Decisions
Understanding the trends within the Dow and Nasdaq can guide investment decisions. Investors seeking stable, dividend-paying companies might focus on Dow components, while those looking for high growth potential and disruptive innovation might gravitate towards Nasdaq-listed companies. The relative performance of these indices can also signal shifts in market leadership—for instance, if the Nasdaq is significantly outperforming the Dow, it might suggest a “risk-on” environment where investors favor growth. If the Dow is outperforming, it might indicate a flight to “safety” or value.
Understanding Market Trends and Cycles
Lastly, the Dow and Nasdaq help investors understand market trends and cycles. They provide historical context for market booms and busts, illustrating how different sectors react to economic changes, technological advancements, and geopolitical events. Studying their long-term performance offers invaluable lessons on market volatility, the power of compounding, and the importance of diversification, enabling investors to make more informed and resilient decisions through various economic cycles.
In conclusion, the Dow Jones Industrial Average and the Nasdaq Composite (along with the Nasdaq 100) are cornerstones of global financial analysis. While the Dow offers a historical window into the strength of established industrial leaders, the Nasdaq provides a vibrant lens into the cutting edge of innovation and growth. Together, they paint a comprehensive, albeit distinct, picture of market health, guiding millions of investment decisions and shaping our understanding of the dynamic interplay between finance, technology, and economic progress. For anyone engaged with the financial world, grasping the nuances of these two powerful indices is not just beneficial—it’s essential.
aViewFromTheCave is a participant in the Amazon Services LLC Associates Program, an affiliate advertising program designed to provide a means for sites to earn advertising fees by advertising and linking to Amazon.com. Amazon, the Amazon logo, AmazonSupply, and the AmazonSupply logo are trademarks of Amazon.com, Inc. or its affiliates. As an Amazon Associate we earn affiliate commissions from qualifying purchases.