In the rapidly evolving landscape of technology, data has become the primary fuel driving innovation. From the algorithms powering artificial intelligence to the diagnostic tools used by software engineers to optimize performance, statistical concepts form the underlying architecture of modern tech. One of the most fundamental, yet frequently misunderstood, concepts in this domain is “Degrees of Freedom” (often abbreviated as df).
To a software developer or a data scientist, degrees of freedom represent more than just a mathematical abstraction; they are a measure of the “room to move” within a dataset or a model. Whether you are building a predictive engine, conducting A/B tests on a new app interface, or optimizing server load balancing, understanding df is essential for ensuring that your conclusions are mathematically sound and your models are robust.
The Core Concept: Defining Degrees of Freedom in the Digital Age
At its most basic level, degrees of freedom refer to the number of independent pieces of information that go into the calculation of a statistic. In the context of tech and data science, it is the number of values in a study that are free to vary without changing the final result of a calculation.
What is “df” from a Computational Perspective?
Imagine you are configuring a load-balancing system for a cluster of three servers. If you know the total capacity of the cluster and the specific load on two of those servers, the load on the third server is no longer “free” to vary. It is mathematically determined by the remaining capacity. In this scenario, you have $n – 1$ degrees of freedom, where $n$ is the number of servers.
In tech environments, where we deal with high-dimensional data, df serves as a constraint. It tells the software how many independent observations are available to estimate a parameter. When we lose a degree of freedom, it is usually because we have used a piece of information to calculate an intermediate value (like a mean or a sum), which then acts as a constraint on the remaining data points.
The “n – 1” Rule in Data Processing
The most common formula tech professionals encounter is $df = n – 1$. This is typically applied when calculating the sample variance or standard deviation of a dataset. Why do we subtract one? In computational statistics, if we are using the sample mean to estimate the population mean, we are “spending” one degree of freedom.
For a developer building a monitoring tool, this distinction is vital. Using $n$ instead of $n – 1$ in the denominator of a variance calculation leads to a biased estimate (usually an underestimate) of the true variance. This can result in software that fails to account for edge cases or underestimates the volatility of system performance.
Why Degrees of Freedom Matter for Machine Learning and AI
In the world of artificial intelligence and machine learning (ML), degrees of freedom are intimately tied to model complexity and the risk of overfitting. As we move from simple linear regressions to complex deep learning architectures, managing the “freedom” of our models becomes a primary engineering challenge.
Overfitting and Underfitting: The Mathematical Constraint
Every parameter added to a machine learning model—be it a weight in a neural network or a coefficient in a regression—consumes a degree of freedom. A model with high degrees of freedom relative to the amount of training data is highly flexible. While this allows the model to capture intricate patterns, it also makes it susceptible to “overfitting.”
Overfitting occurs when the model uses its high df to memorize the noise in the training data rather than the underlying signal. Conversely, a model with too few degrees of freedom might “underfit,” failing to capture the essential trends of the dataset. For a machine learning engineer, the goal is to find the “Goldilocks zone” where the degrees of freedom are optimized to generalize well to unseen data.
Model Complexity and Parameter Tuning
In tech research, we often use the term “Effective Degrees of Freedom” when discussing non-linear models or regularized techniques like Ridge or Lasso regression. Regularization is a technique used to penalize complexity, essentially “clamping down” on the degrees of freedom to prevent the model from becoming too erratic.
When you tune a hyperparameter in a software library like Scikit-Learn or TensorFlow, you are often indirectly manipulating the degrees of freedom. By understanding the statistical foundation of these tools, engineers can make more informed decisions about model architecture rather than relying solely on trial and error.
Practical Applications in Software and Data Tools
Statistics is no longer a manual endeavor; it is a computational one. Modern software tools and programming languages have built-in functionalities to handle degrees of freedom, but the user must understand the underlying logic to interpret the output correctly.
Implementation in Python (Pandas & SciPy)
For developers working in Python, libraries like Pandas, NumPy, and SciPy are the gold standard for data manipulation. When you call a function like .var() or .std() in Pandas, the default behavior is to use $ddof=1$ (Delta Degrees of Freedom), which corresponds to the $n – 1$ calculation.
However, NumPy defaults to $ddof=0$. This discrepancy can lead to significant bugs in technical reporting if the developer is unaware of how the software handles degrees of freedom. Accurate data engineering requires a deep dive into documentation to ensure that the statistical constraints applied by the code align with the mathematical requirements of the project.
Statistical Significance in A/B Testing for Apps
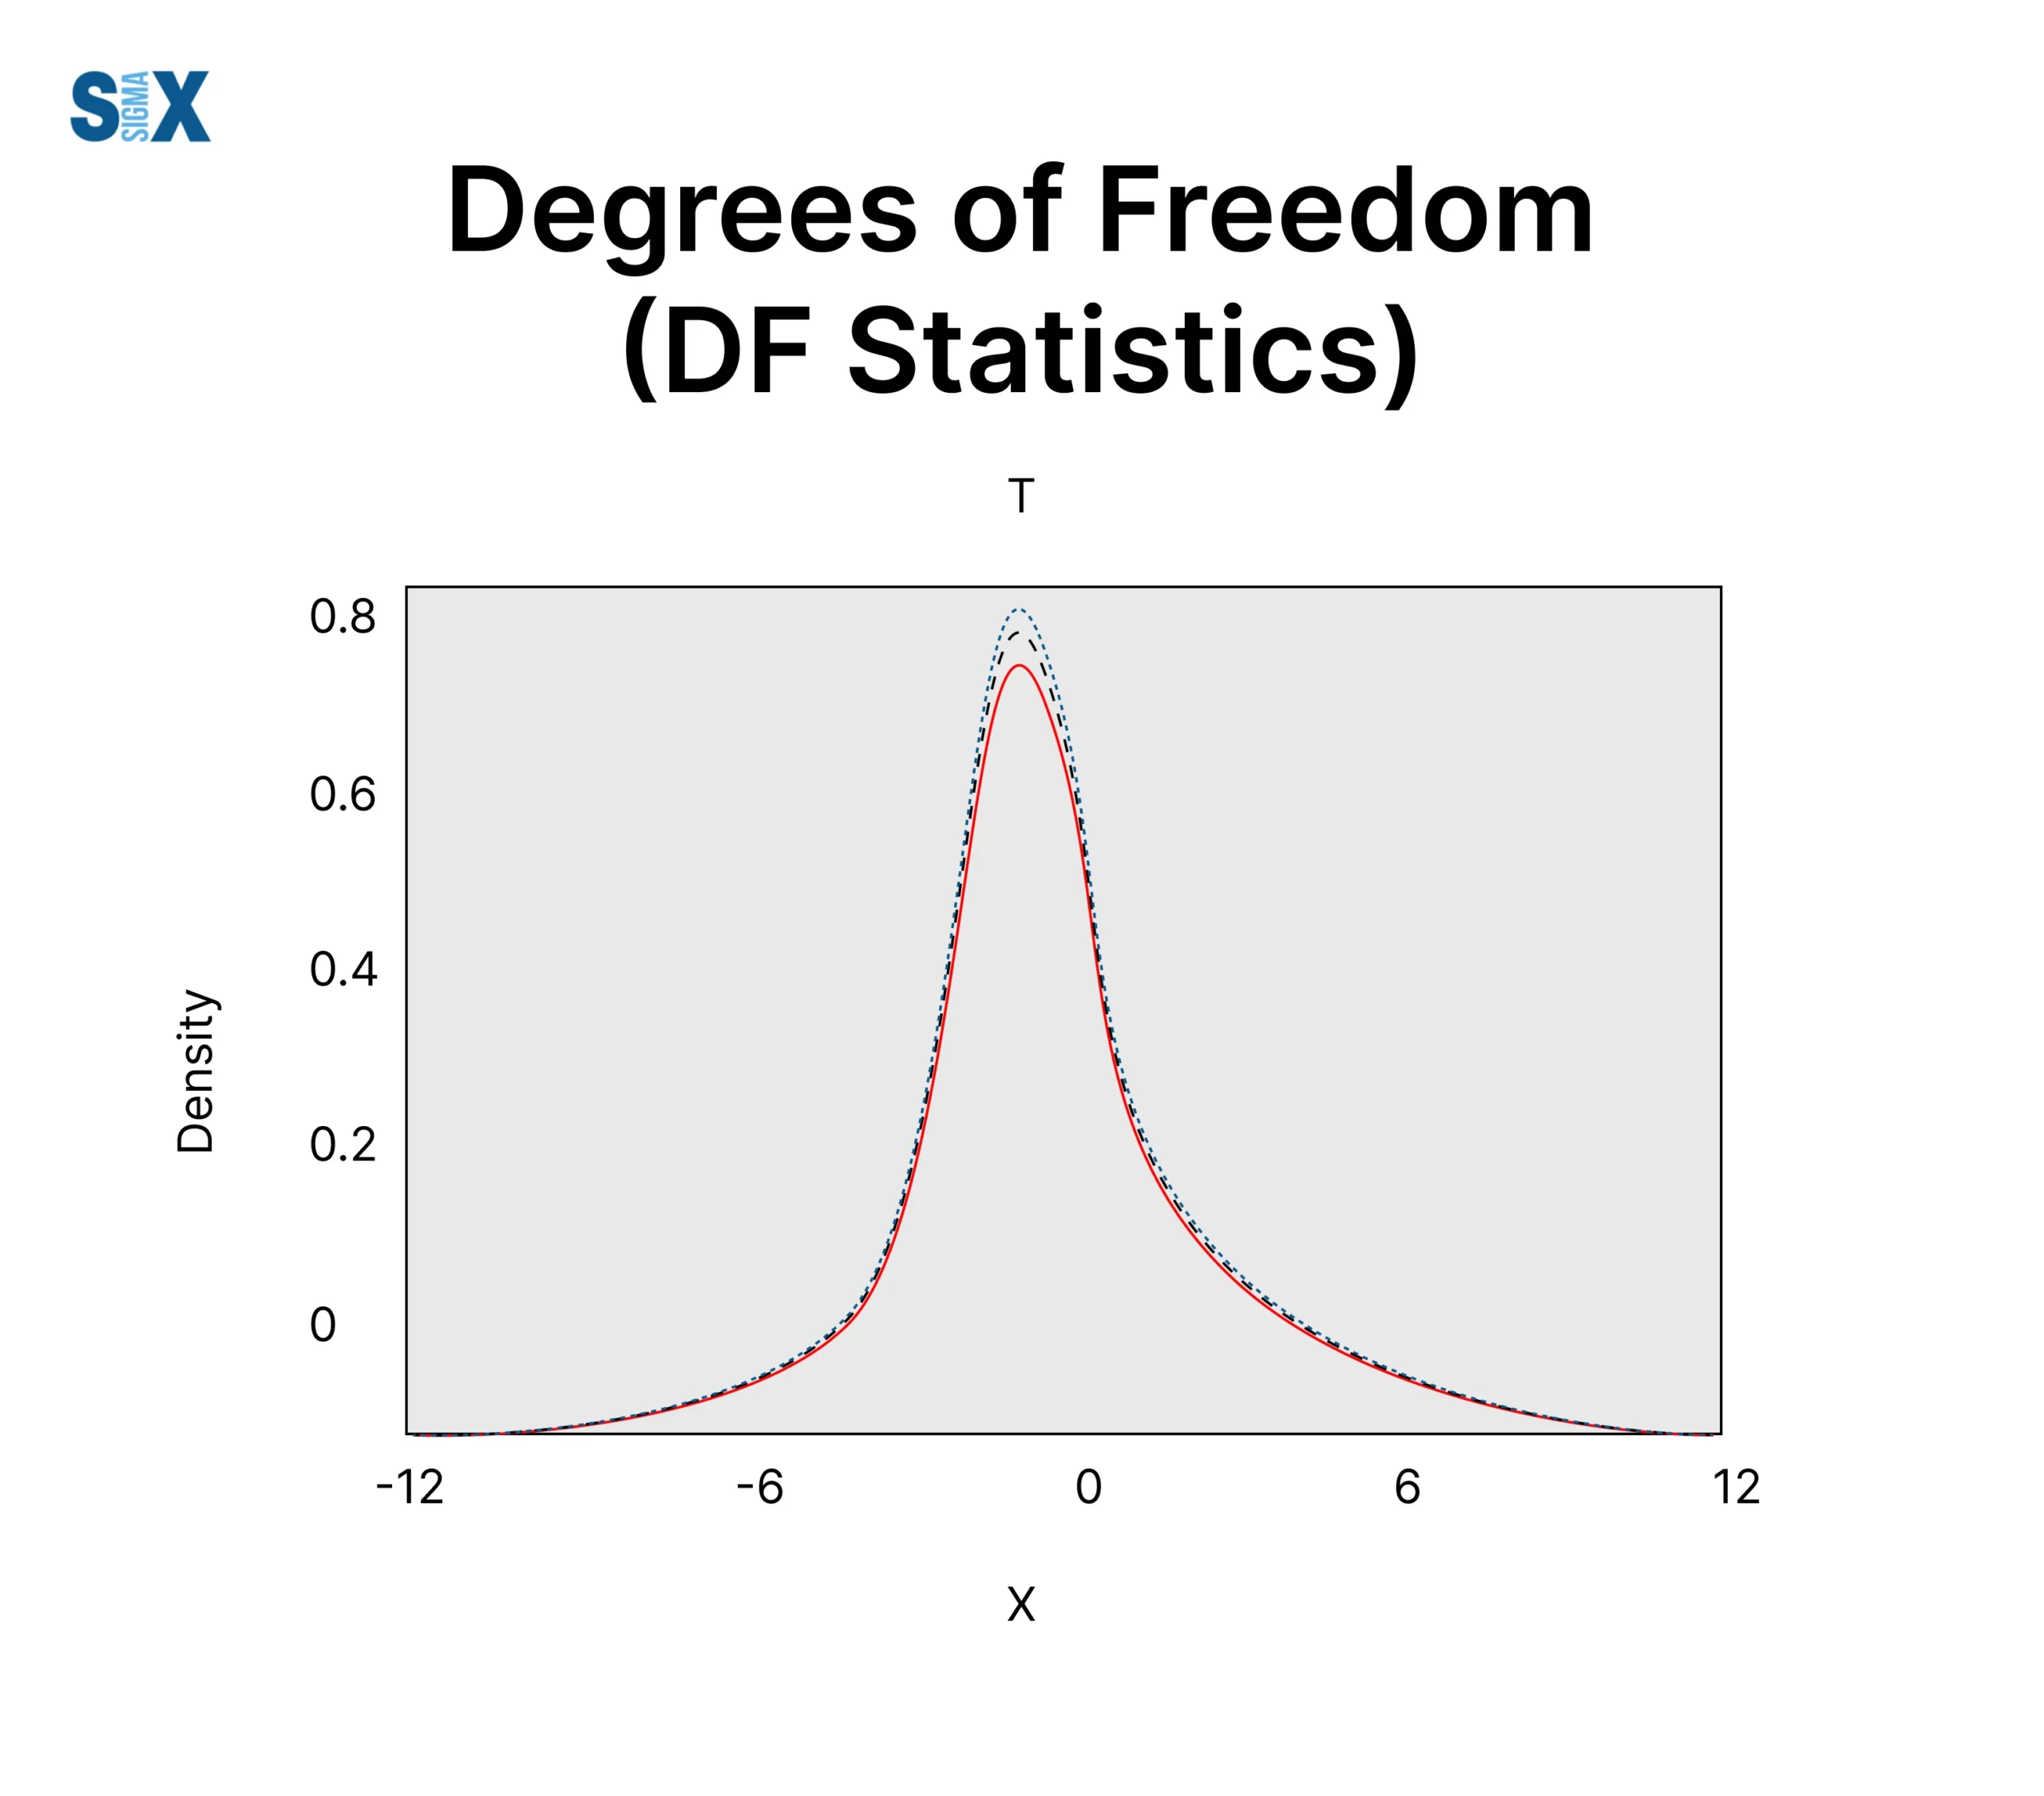
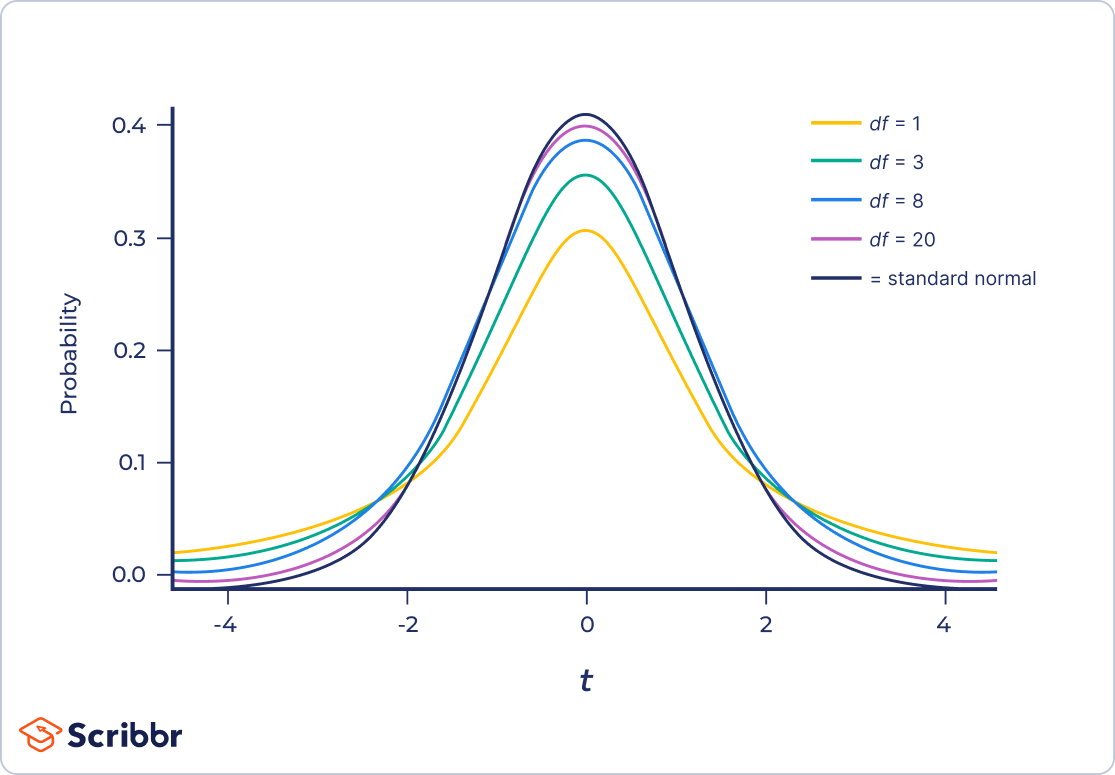
In the tech industry, A/B testing is the standard method for product optimization. When an app developer wants to know if “Button A” leads to more conversions than “Button B,” they perform a T-test. The degrees of freedom in a T-test determine the shape of the T-distribution used to calculate the p-value.
If the df is low, the T-distribution has “heavier tails,” meaning we need a much stronger result to claim statistical significance. As the df increases (with more users participating in the test), the distribution approaches a normal curve. Understanding df allows product managers and growth engineers to determine how much data they need to collect before they can confidently deploy a new feature.
Calculating df Across Different Statistical Models
Different technical scenarios require different ways of calculating degrees of freedom. For a tech professional, recognizing the specific model in use is the first step toward accurate analysis.
T-Tests and Variance in Tech Quality Assurance
In Quality Assurance (QA) and hardware testing, we often use T-tests to compare the performance of two different builds.
- One-sample T-test: $df = n – 1$.
- Two-sample T-test: $df = (n1 + n2) – 2$.
In a scenario where you are comparing the latency of two different API endpoints, you must account for the loss of two degrees of freedom because you are estimating two separate means. This calculation is crucial for determining if the performance difference is due to a code change or mere random fluctuation.
Chi-Square Tests in User Experience (UX) Research
UX researchers often use Chi-square tests to analyze categorical data, such as whether user preference for a navigation layout is independent of their device type (mobile vs. desktop). Here, the degrees of freedom are calculated based on the structure of the data table:
$df = (rows – 1) times (columns – 1)$.
If a researcher is testing three different layouts across two device types, they have $(3 – 1) times (2 – 1) = 2$ degrees of freedom. This number is used to look up the critical value in a Chi-square table (or, more likely, a software function) to determine if the user behavior patterns are statistically significant.

Best Practices for Tech Professionals Handling Statistical Data
As we integrate more automated decision-making into our software systems, the role of the human engineer as a guardian of statistical integrity becomes more important. Degrees of freedom serve as a reminder that data is finite and that every inference has a cost.
- Always Check Software Defaults: As noted with Python libraries, different tools have different defaults for calculating variance and standard deviation. Never assume the software is using $n – 1$ or $n$.
- Match Model Complexity to Data Volume: If you are working with a small dataset (low $n$), avoid high-dimensional models with high degrees of freedom. You will almost certainly overfit.
- Document Statistical Assumptions: When building data pipelines or analytics dashboards, document how df is handled. This is vital for reproducibility and for other engineers who may need to audit your work.
- Understand the “Cost” of Estimation: Every time you estimate a parameter from your data, you lose a degree of freedom. In complex systems with many variables, you can quickly run out of “freedom,” leading to unstable models.
In conclusion, “df” is far more than a subscript in a textbook. In the tech world, it is a measure of the reliability of our software, the accuracy of our AI, and the validity of our user research. By mastering this concept, tech professionals can build more resilient systems and derive more meaningful insights from the vast oceans of data at their disposal. Degrees of freedom represent the mathematical boundaries of what we can know, and in the high-stakes world of technology, knowing those boundaries is the key to innovation.
aViewFromTheCave is a participant in the Amazon Services LLC Associates Program, an affiliate advertising program designed to provide a means for sites to earn advertising fees by advertising and linking to Amazon.com. Amazon, the Amazon logo, AmazonSupply, and the AmazonSupply logo are trademarks of Amazon.com, Inc. or its affiliates. As an Amazon Associate we earn affiliate commissions from qualifying purchases.