
In the vast and ever-evolving landscape of technology, from the intricate algorithms that power artificial intelligence to the robust architectures of enterprise software, a fundamental mathematical concept underpins much of the logic and analysis: the dependent and independent variable. Far from being an abstract academic exercise, grasping these variables is an essential skill for anyone operating within the tech sphere. They are the bedrock for understanding data relationships, building predictive models, designing interactive systems, and ultimately, making informed decisions driven by data.
At its core, the distinction between dependent and independent variables helps us model cause-and-effect relationships or simply observe how one factor changes in response to another. In a world increasingly defined by data, understanding which data points are influencing others, and which are being influenced, is not just beneficial—it’s imperative. This article will demystify these core concepts, explain their profound significance within various technological domains, and illustrate how mastering them can elevate your analytical and problem-solving capabilities in the digital age.
The Core Concepts: Unpacking Variables in a Digital World
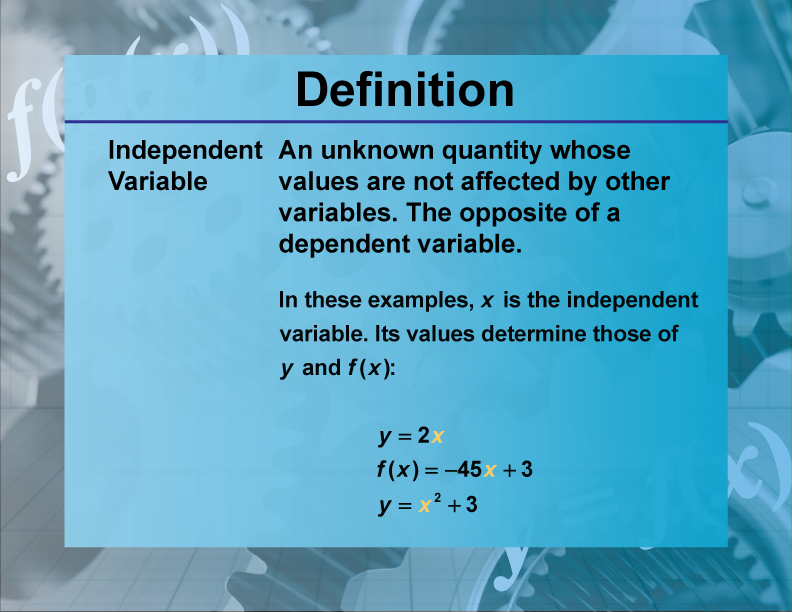
Variables are the building blocks of any quantitative analysis, representing quantities that can change or vary. In mathematics and its technological applications, we often categorize these variables based on their role in a relationship. This distinction is crucial for setting up experiments, analyzing datasets, and developing robust software solutions.
Defining the Independent Variable: The Input, the Cause, the Driver
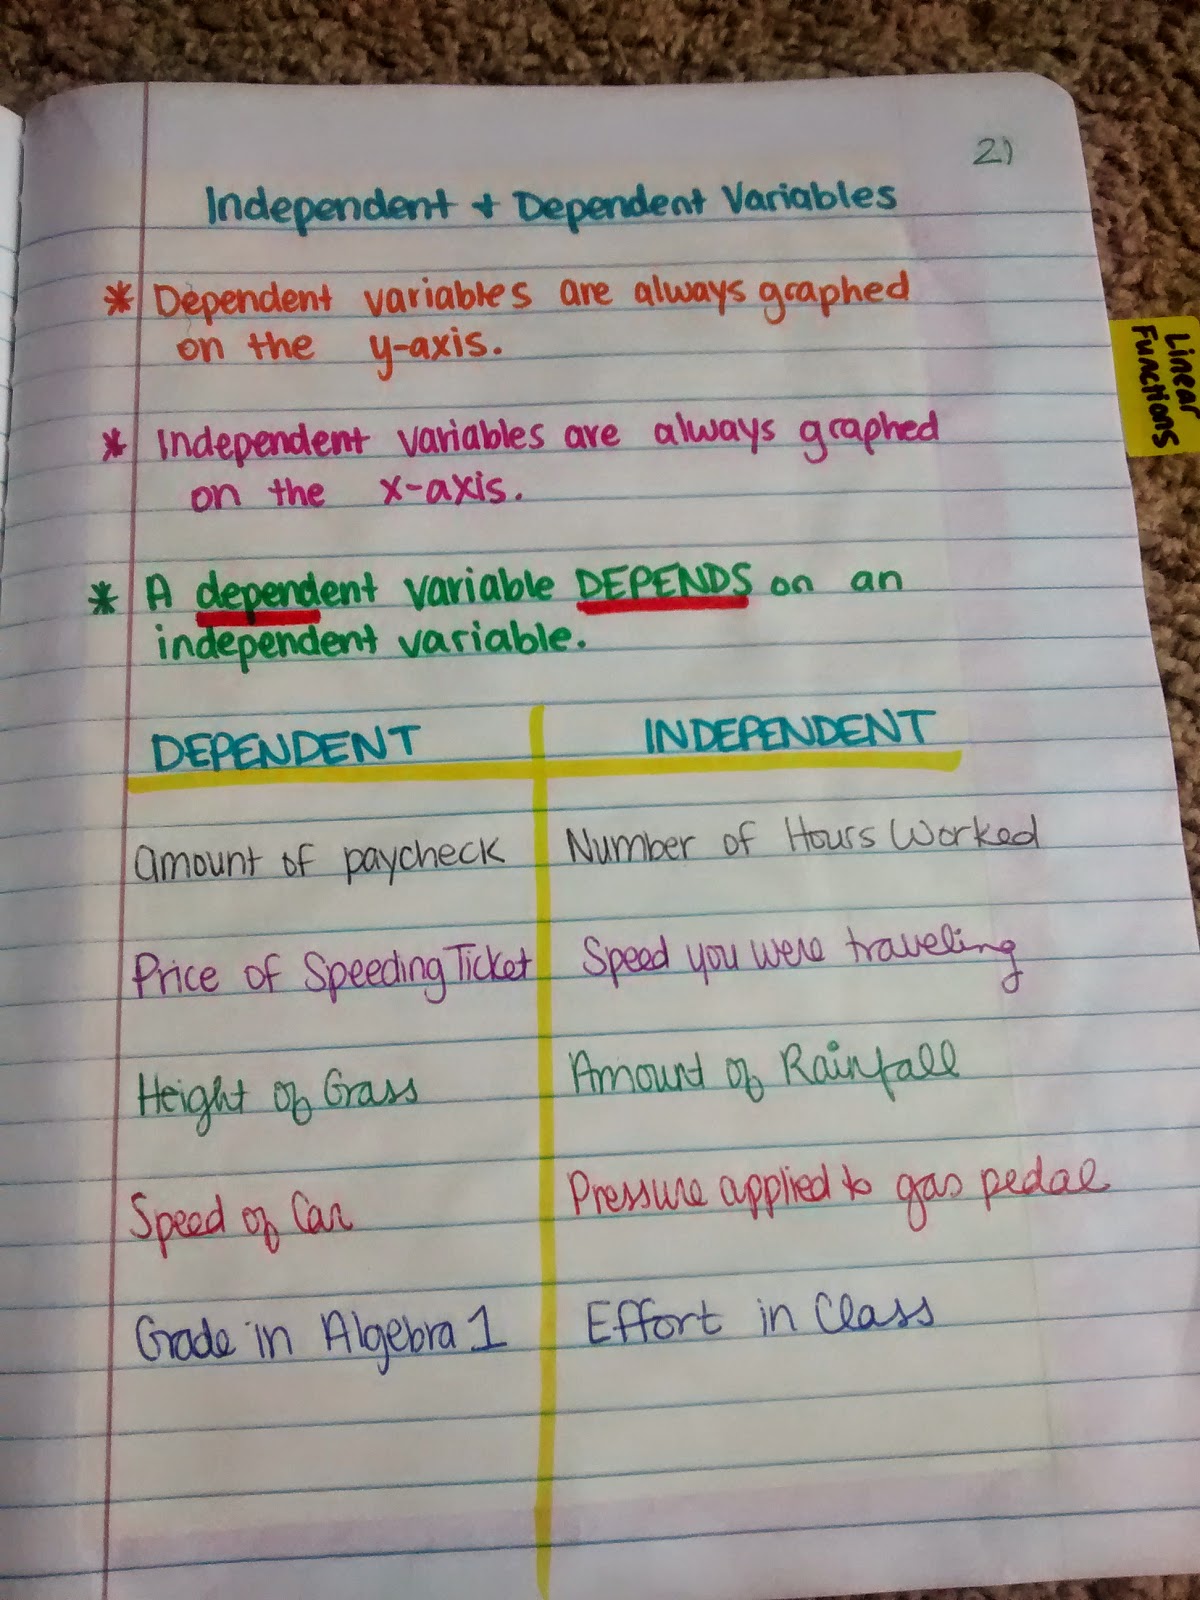
The independent variable is exactly what its name suggests: it operates independently. It is the factor that is changed, manipulated, or controlled in an experiment or observation to see how it affects something else. Think of it as the “cause” or the “input” in a system. In a technological context, this could be anything from the amount of training data fed into a machine learning model, the number of users accessing a server simultaneously, or the specific parameters set in a software configuration.
-
Characteristics:
-
Controlled: Often intentionally altered by the researcher or system.
-
Predictor: Used to predict or explain changes in another variable.
-
Input: Represents the driving force or condition.
-
For example, if a software engineer is testing the load capacity of a web server, the number of simultaneous user requests would be the independent variable. They would systematically increase this number to observe its effects.
Defining the Dependent Variable: The Output, the Effect, the Result
Conversely, the dependent variable is the factor that is measured or observed, and its value depends on changes made to the independent variable. It is the “effect” or the “output” that we are interested in. When you change the independent variable, you are looking to see how the dependent variable responds. In technology, this might be the accuracy of an AI prediction, the response time of a web application, or the battery life of a gadget.
-
Characteristics:
-
Measured/Observed: Its value is monitored.
-
Outcome: The result of changes in the independent variable.
-
Output: Represents the measured response or outcome.
-
Continuing the web server example, the server’s response time or CPU utilization would be the dependent variables. These metrics would change as the number of simultaneous user requests (independent variable) is altered.
The Relationship: How They Interact and Why It Matters
The interplay between dependent and independent variables forms the basis of understanding system behavior and making predictions. It’s not just about identifying them, but about quantifying and characterizing the relationship between them. Is it a direct relationship (as one increases, so does the other)? An inverse relationship (as one increases, the other decreases)? Or is there no significant relationship at all? Understanding this interaction is paramount in tech because it allows us to:
-
Design better systems: By knowing how inputs affect outputs, engineers can optimize performance, efficiency, and user experience.
-
Debug effectively: Pinpointing which independent variable is causing an undesired change in a dependent variable is key to troubleshooting.
-
Predict future states: Machine learning models, for instance, learn these relationships from data to forecast outcomes.
In an algorithm, independent variables often correspond to the inputs of a function, while dependent variables are the outputs. This fundamental understanding ensures that logical flows are correctly modeled and that the system behaves predictably under various conditions.
Why These Variables Are Pivotal in Technology
The theoretical understanding of dependent and independent variables gains immense practical significance when applied to the myriad challenges and innovations within the technology sector. From refining algorithms to securing digital assets, this conceptual framework is continuously leveraged.
Foundations of Data Science and Analytics: Predicting and Explaining
Data science is inherently built on the principles of dependent and independent variables. Every time a data scientist builds a model to predict a future outcome (e.g., customer churn, stock price movement, sensor failure), they are identifying key independent variables (features) that are likely to influence the dependent variable (the outcome they want to predict).
-
Predictive Analytics: Models like linear regression or decision trees are designed to quantify the relationship between independent variables (e.g., age, income, browsing history) and a dependent variable (e.g., likelihood of purchasing a product).
-
Explanatory Analytics: Understanding which independent variables have the strongest impact on a dependent variable allows data scientists to explain phenomena, offering insights to businesses on what drives specific outcomes. For example, which features of a product (independent variables) lead to higher user engagement (dependent variable)?
Powering AI and Machine Learning Models: Learning from Data
Artificial intelligence, particularly machine learning, operates almost exclusively by identifying and leveraging the relationships between dependent and independent variables within vast datasets.
-
Training Models: During the training phase, an ML model is fed numerous examples where it learns to map independent variables (input features like pixels in an image, words in a sentence) to a dependent variable (output like object detected, sentiment expressed). The model adjusts its internal parameters to best approximate this relationship.
-
Inference: Once trained, the model takes new independent variables as input and uses its learned mapping to predict the most likely dependent variable. For instance, in a facial recognition system, the pixel data of a new face is the independent variable, and the predicted identity is the dependent variable.
Essential for Software Development and Algorithm Design: Logic and Control
Beyond data science and AI, the concept of variables is fundamental to the very fabric of software development and algorithm design. Any program that takes input, processes it, and produces output is implicitly dealing with these variables.
-
Function Parameters: In programming, function arguments are often independent variables, while the function’s return value is the dependent variable.
calculate_total(price, quantity):priceandquantityare independent,totalis dependent. -
System Interactions: When designing complex systems, developers must consider how changes in one module (independent variable) will affect the behavior or output of another module (dependent variable). This ensures modularity, testability, and robustness.
-
User Interface (UI) Development: User actions (clicks, inputs – independent variables) trigger changes in the UI state or data displayed (dependent variables).

Practical Applications Across Tech Disciplines
The abstract concept of dependent and independent variables manifests in concrete applications across virtually every tech domain, proving its utility as a versatile analytical tool.
Web Analytics: Understanding User Behavior
In web analytics, dependent and independent variables are used extensively to understand website performance and user engagement.
-
Conversion Rate Optimization: An independent variable might be a change in website layout or a new call-to-action button. The dependent variable would be the conversion rate (e.g., purchases, sign-ups). Analysts measure how changes to the independent variable impact the dependent variable to optimize performance.
-
Traffic Analysis: The source of traffic (e.g., organic search, social media, paid ads) could be an independent variable, and the bounce rate or time on page could be dependent variables, helping identify which sources bring engaged users.
IoT and Sensor Data: Monitoring and Responding
The Internet of Things (IoT) generates vast amounts of sensor data, where understanding variable relationships is crucial for effective monitoring and automation.
-
Predictive Maintenance: In an industrial IoT setup, the temperature or vibration levels of a machine (independent variables) might be monitored to predict a machine failure (dependent variable). An algorithm learns the correlation to flag potential issues before they occur.
-
Smart Home Automation: A smart thermostat might use the ambient room temperature (independent variable) to determine whether to turn the heating or cooling on/off (dependent variable/action).
Cybersecurity: Identifying Threats and Dependencies
Even in cybersecurity, dependent and independent variables play a role in anomaly detection and threat analysis.
-
Intrusion Detection: Independent variables could be network traffic volume, number of failed login attempts, or source IP reputation. The dependent variable would be the likelihood of an intrusion or attack. Security systems learn normal patterns to flag deviations.
-
Vulnerability Assessment: Testing different input payloads (independent variables) into a web application to observe whether it triggers an error, crash, or unexpected behavior (dependent variable) is a common method for identifying vulnerabilities.
Visualizing and Modeling Variable Relationships
Understanding dependent and independent variables isn’t just about identification; it’s also about effectively representing and analyzing their relationships. Tech tools provide powerful ways to do this.
Graphing and Data Visualization: Making Sense of Connections
Visual tools are invaluable for illustrating the relationship between variables, particularly in data analysis and business intelligence.
-
Scatter Plots: The most common way to visualize two quantitative variables, with the independent variable typically on the x-axis and the dependent variable on the y-axis. This quickly reveals patterns, trends, or clusters, like how server load affects response time.
-
Line Graphs: Ideal for showing how a dependent variable changes over time (the independent variable), such as website traffic over a month or stock price fluctuations.
-
Bar Charts: Can show the relationship between a categorical independent variable (e.g., different operating systems) and a quantitative dependent variable (e.g., application crash rate).
Regression Analysis: Quantifying Dependencies
Regression analysis is a statistical technique widely used in tech to model the relationship between a dependent variable and one or more independent variables.
-
Linear Regression: Used to predict the value of a dependent variable based on the value of a single independent variable (simple linear regression) or multiple independent variables (multiple linear regression). This is foundational in fields from finance to social sciences, but equally crucial in tech for things like predicting software project completion times based on team size and complexity.
-
Machine Learning Models: Many ML algorithms (e.g., gradient boosting, random forests) are essentially sophisticated forms of regression or classification that identify complex, non-linear relationships between independent features and a dependent target variable.
Simulation and Predictive Modeling: Forecasting Future States
By understanding the established relationships between variables, tech professionals can build simulations and predictive models to forecast future outcomes or test hypothetical scenarios.
-
Financial Modeling: In FinTech, models predict how various independent economic indicators (interest rates, inflation) will impact dependent financial outcomes (stock prices, company profits).
-
Network Performance Simulation: Engineers can simulate changes in network traffic (independent variable) to predict the impact on network latency or throughput (dependent variables) before implementing physical changes.
-
Drug Discovery (Bioinformatics): Independent variables (molecular structures, dosages) are tested to predict dependent variables (drug efficacy, side effects) using computational models.
Mastering Variables: A Key Skill for the Tech Professional
For any aspiring or current tech professional, a deep understanding of dependent and independent variables transcends mere academic knowledge. It’s a core competency that enhances analytical prowess and improves decision-making.
Critical Thinking and Problem Solving
Identifying which variables are independent and which are dependent forces a structured approach to problem-solving. It encourages thinking in terms of cause and effect, allowing professionals to isolate issues, design effective tests, and develop targeted solutions. When a system isn’t performing as expected, the first step is often to identify the potential independent variables that could be causing the observed dependent variable (the poor performance).
Effective Communication of Technical Insights
Beyond analysis, clearly articulating the relationships between variables is vital for communicating technical insights to both technical and non-technical stakeholders. Whether explaining why a particular feature leads to higher user engagement, justifying an infrastructure upgrade based on load tests, or presenting the predicted outcome of a new AI model, using the framework of dependent and independent variables provides clarity and precision. It helps frame the narrative around data, making complex analyses understandable and actionable.
In conclusion, the concepts of dependent and independent variables are far from abstract mathematical curiosities. They are powerful conceptual tools that form the very backbone of data-driven decision-making, analytical rigor, and innovative development within the technology sector. From the granular level of a single function in a codebase to the macro scale of enterprise-wide analytics and AI strategies, mastering these variables is not just advantageous—it’s an indispensable skill for navigating and shaping the digital future.
aViewFromTheCave is a participant in the Amazon Services LLC Associates Program, an affiliate advertising program designed to provide a means for sites to earn advertising fees by advertising and linking to Amazon.com. Amazon, the Amazon logo, AmazonSupply, and the AmazonSupply logo are trademarks of Amazon.com, Inc. or its affiliates. As an Amazon Associate we earn affiliate commissions from qualifying purchases.