
In the dynamic world of financial markets, understanding the subtle moves of institutional players, often referred to as “smart money,” can provide a significant edge. Among the myriad analytical tools and concepts employed by traders, the term SMT has gained traction, particularly within communities focused on Smart Money Concepts (SMC). In this context, SMT predominantly stands for Smart Money Technique (Divergence), a sophisticated method used to identify potential market reversals or continuations based on the comparative behavior of highly correlated assets. It’s a powerful analytical lens for discerning the true intentions of large market participants, differentiating genuine market shifts from engineered liquidity grabs.

Understanding Smart Money Concepts and the Role of SMT
To fully grasp what SMT divergence entails, it’s essential to first comprehend the broader framework of Smart Money Concepts (SMC). SMC is a trading methodology that aims to track the footprints of institutional traders – banks, hedge funds, and other large financial entities – believing that these entities drive market movements and often manipulate price action to their advantage. Unlike retail traders who typically react to price, smart money creates price. Their sheer volume of capital allows them to influence supply and demand, often leaving identifiable patterns in the charts.
The Foundation of Institutional Trading
The core premise of SMC is that markets are not entirely random but are rather orchestrated environments where liquidity is the primary driver. Institutional traders need significant liquidity to execute their large orders without drastically moving the market against themselves. This often involves engineering specific price movements to lure retail traders into false breakouts or breakdowns, creating the necessary opposing orders (liquidity) for institutions to accumulate or distribute positions discreetly. Concepts like order blocks, liquidity voids, mitigation blocks, and fair value gaps are all manifestations of this institutional footprint.
The Illusion of Randomness
For the uninitiated, market movements can appear chaotic and unpredictable. However, SMC suggests that beneath this apparent randomness lies a structured process driven by the need for institutions to transact. Their strategies are often designed to capitalize on the predictable behaviors of the retail trading crowd, such as placing stop-losses at obvious support/resistance levels. Smart money will often “sweep” these liquidity pools before initiating their true directional move. SMT divergence is one such technique that allows keen observers to identify when smart money is subtly changing its stance on an asset, even when general market sentiment or initial price action might suggest otherwise. It’s a critical piece of the puzzle for anticipating reversals or shifts in market bias before they become widely apparent.
Deconstructing SMT Divergence: Identification and Signals
SMT divergence is a specific analytical tool within the SMC framework that leverages the strong correlation between certain financial instruments to identify potential shifts in market sentiment by “smart money.” It’s based on the premise that highly correlated assets should generally move in tandem. When this correlation breaks down at critical price points, it often signals an underlying institutional intent that deviates from the superficial price action.
Defining SMT (Smart Money Technique) Divergence
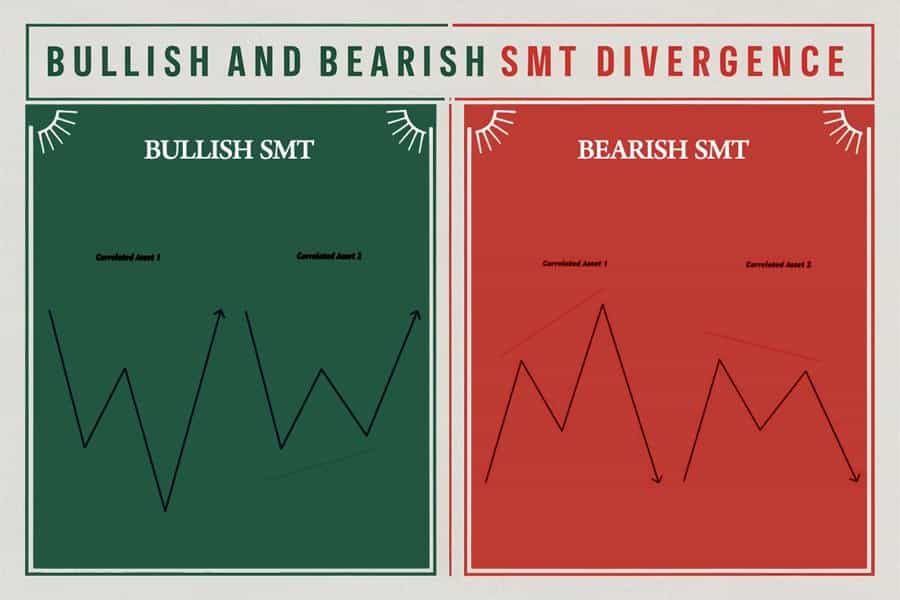
At its core, SMT divergence occurs when two highly correlated assets, which are expected to move together, show contradictory price action at key turning points. For instance, if Asset A makes a new higher high, but Asset B (which is strongly correlated) fails to make a corresponding new higher high, this divergence can signal an impending bearish reversal for both assets. Conversely, if Asset A makes a new lower low, but Asset B fails to make a new lower low, it could signal an impending bullish reversal. This discrepancy suggests that while one asset is being “pushed” to create an apparent trend continuation (often to grab liquidity), the other asset’s inability to confirm that move indicates a lack of genuine conviction from smart money across the board.
Identifying Confluence and Confirmation
The power of SMT divergence lies in its ability to offer an early warning sign. However, like all advanced trading techniques, it is rarely used in isolation. Traders typically look for SMT divergence at significant levels of support or resistance, within identified order blocks, or after a liquidity sweep. The confluence of SMT divergence with other SMC principles, such as market structure breaks (MSB), fair value gaps (FVG), or liquidity pools, significantly enhances its reliability.
For example, a common application involves comparing the EUR/USD and GBP/USD currency pairs, or the US Dollar Index (DXY) against a major pair like EUR/USD.
- Bullish SMT Divergence (Bearish for correlated pair): If the DXY makes a lower low, but the EUR/USD fails to make a higher high (meaning EUR/USD doesn’t show the expected strength against the weakening dollar), this can signal that smart money is accumulating dollars (i.e., bullish on DXY, bearish on EUR/USD). The EUR/USD is failing to confirm the DXY’s weakness.
- Bearish SMT Divergence (Bullish for correlated pair): If the DXY makes a higher high, but the EUR/USD fails to make a lower low, this suggests that smart money is distributing dollars (i.e., bearish on DXY, bullish on EUR/USD). The EUR/USD is failing to confirm the DXY’s strength.
The non-confirming asset is often seen as the “stronger” or “weaker” one in the impending move, signaling the true direction the institutions intend to take.
Strategic Application: Trading with SMT Divergence
Integrating SMT divergence into a trading strategy requires meticulous observation, patience, and a deep understanding of market structure. It’s not merely about spotting a discrepancy; it’s about understanding what that discrepancy implies within the broader market context and using it to formulate high-probability trade setups.
Correlated Assets in Focus
The choice of correlated assets is crucial. The most common pairs for SMT analysis include:
- Major Forex Pairs: EUR/USD and GBP/USD (both correlated to the US Dollar).
- US Dollar Index (DXY): Often correlated inversely with major USD pairs like EUR/USD.
- Equity Indices: S&P 500, NASDAQ 100, Dow Jones Industrial Average (often highly correlated).
- Commodities: Gold (XAU/USD) often shows an inverse correlation with the DXY.
Traders often monitor these related instruments on separate charts simultaneously, looking for the tell-tale signs of divergence at key liquidity points or price extremes.
The Setup: What to Look For
Identifying an SMT divergence involves a specific sequence of observations:
- Identify a Key Level: Price approaching a significant high or low, an order block, or a liquidity pool on one of the correlated assets.
- Observe Price Action: As one asset reaches a new extreme (e.g., a new higher high), closely watch the correlated asset.
- Spot the Divergence:
- Bearish SMT: Asset A makes a higher high, while Asset B makes a lower high (fails to make a new higher high). This signals potential reversal down.
- Bullish SMT: Asset A makes a lower low, while Asset B makes a higher low (fails to make a new lower low). This signals potential reversal up.
- Look for Confirmation: After the divergence, wait for additional SMC signals in the primary asset you intend to trade. This could be a market structure break (MSB), an order block activation, or a fair value gap being respected. This confirmation validates the SMT divergence and provides a more precise entry.
Entry and Exit Strategies
Once SMT divergence is identified and confirmed by other SMC elements, entry and exit points become clearer:
- Entry: A common entry point is after a market structure break in the direction implied by the SMT divergence, often on a retest of an order block or fair value gap created during the impulse move following the divergence. For instance, if a bearish SMT divergence occurs, and the primary asset breaks market structure to the downside, a short entry could be placed on the subsequent retracement to a bearish order block.
- Stop-Loss: Stop-losses are typically placed above the swing high (for short trades) or below the swing low (for long trades) that formed the divergence or the confirming market structure break. This ensures that if the SMT signal was false or the market reverses against the intended direction, risk is tightly managed.
- Take-Profit: Targets are usually aligned with opposing liquidity pools, significant order blocks, or previous swing highs/lows where smart money might look to take profits or reverse positions. The goal is to capture the move initiated by the institutional shift identified by the SMT.
Integrating SMT into a Robust Trading Framework
While powerful, SMT divergence is not a standalone magic bullet. Its true strength emerges when integrated into a comprehensive trading framework that accounts for market structure, liquidity, and overall institutional flow. Understanding both its advantages and limitations is paramount for consistent success.
Advantages: Anticipating Market Shifts
The primary advantage of using SMT divergence is its predictive potential. It offers an early warning signal of an impending reversal or significant shift in market direction before the majority of retail traders react. By identifying where smart money is subtly accumulating or distributing positions, traders can position themselves advantageously, often at optimal entry points with favorable risk-to-reward ratios. This technique is particularly effective in identifying traps set by institutions, allowing traders to avoid being caught on the wrong side of a liquidity sweep.
Disadvantages: Nuance and False Signals
Despite its benefits, SMT divergence presents several challenges. It requires a keen eye and experience to interpret correctly. What appears as divergence to an untrained eye might simply be a temporary breakdown in correlation or noise. False signals can occur, especially in highly volatile or choppy markets, or when the correlation between assets temporarily weakens. Furthermore, SMT divergence alone does not dictate an exact entry or exit; it merely highlights a potential area of interest. Without confirmation from other SMC tools, relying solely on SMT can lead to premature entries and avoidable losses. It’s a nuanced tool that demands careful consideration of context, rather than a rigid set of rules.
Integrating SMT with Other Tools
The most effective application of SMT divergence is in conjunction with other Smart Money Concepts. This layering of analysis provides a higher probability setup:
- Market Structure: Always observe SMT divergence within the context of the prevailing market structure (bullish, bearish, or ranging). A bullish SMT divergence at a strong support level after a market structure shift to the upside is far more potent than one occurring in the middle of nowhere.
- Liquidity: SMT often signals that smart money is about to move away from an area where liquidity has been taken (e.g., above old highs or below old lows). Confirming that a liquidity sweep has occurred before or during the SMT divergence enhances the trade’s validity.
- Order Blocks and Fair Value Gaps: These institutional footprints provide precise areas for entries and targets. An SMT divergence can indicate that price is likely to head towards or react off a specific order block or to fill a fair value gap.
- Timeframe Analysis: Applying SMT divergence across multiple timeframes can provide greater conviction. A divergence on a higher timeframe (e.g., 4-hour) confirmed by a smaller divergence on a lower timeframe (e.g., 15-minute) at a critical price point strengthens the overall bias.
By combining SMT divergence with these complementary tools, traders can develop a robust and high-probability trading strategy that aligns with the sophisticated operations of smart money.
Mastering SMT: Advanced Insights and Common Pitfalls
Mastering SMT divergence involves moving beyond its basic identification and developing a deeper understanding of its nuances, psychological underpinnings, and potential pitfalls. It’s an ongoing journey of observation, backtesting, and refinement.
Different Types of SMT Divergence
While the core concept remains consistent, SMT divergence can manifest in slightly different forms, offering varying degrees of strength and reliability:
- Classic SMT Divergence: The most common form, as described, where one asset makes a new high/low and the correlated asset fails to confirm.
- Hidden SMT Divergence: Less discussed, but equally important. This occurs when the primary asset makes a higher low (in an uptrend) or lower high (in a downtrend), and the correlated asset fails to do the same, hinting at trend continuation.
- Triple SMT Divergence: In rare instances, divergence can be observed across three highly correlated assets (e.g., EUR/USD, GBP/USD, and AUD/USD against the DXY), offering an even stronger signal due to the broader consensus among the correlating instruments.
Recognizing these variations can provide a more comprehensive view of institutional activity and strengthen conviction in trade setups.
SMT and Timeframes
SMT divergence is fractal in nature, meaning it can appear on any timeframe. However, divergences observed on higher timeframes (e.g., daily, 4-hour) generally carry more weight and signify more significant potential market reversals or trends than those seen on lower timeframes (e.g., 5-minute). While lower timeframe SMTs can be used for scalping or precise entries on higher timeframe moves, always confirm the higher timeframe bias first. A bearish SMT on a 15-minute chart within a strong daily uptrend might just be a temporary retracement rather than a full reversal. Aligning SMT signals across multiple timeframes (top-down analysis) is crucial for high-probability trading.
The Psychological Edge
Understanding SMT divergence also offers a significant psychological edge. By recognizing how smart money manipulates price to trap retail traders, you can avoid becoming part of the “herd” that provides liquidity for institutional operations. This insight helps in maintaining discipline, avoiding emotional decisions triggered by false breakouts or sudden spikes, and confidently executing trades based on a deeper understanding of market mechanics. It shifts your perspective from being a reactive participant to an anticipatory analyst, allowing you to “think like smart money.”

Common Pitfalls
Even with advanced understanding, traders must be aware of common pitfalls:
- Over-reliance: Never rely solely on SMT divergence. It’s a contributing factor, not the only one. Always seek confluence with market structure, liquidity, and other SMC elements.
- Ignoring Context: A divergence in isolation, without considering the overall market environment or significant news events, can be misleading.
- Premature Entry: Entering a trade immediately upon spotting divergence without waiting for confirmation (e.g., a market structure break) significantly increases risk. Patience is a virtue in SMT trading.
- Poor Correlation: Ensure the assets you are comparing have a strong and consistent correlation. Trading based on weak or transient correlations will lead to unreliable signals.
By continuously refining one’s approach to SMT divergence and adhering to a disciplined methodology, traders can unlock its full potential as a powerful tool for navigating the complexities of the financial markets and aligning themselves with the informed movements of smart money.
aViewFromTheCave is a participant in the Amazon Services LLC Associates Program, an affiliate advertising program designed to provide a means for sites to earn advertising fees by advertising and linking to Amazon.com. Amazon, the Amazon logo, AmazonSupply, and the AmazonSupply logo are trademarks of Amazon.com, Inc. or its affiliates. As an Amazon Associate we earn affiliate commissions from qualifying purchases.