
In the dynamic world of stock market investing, countless tools and metrics exist to help investors make informed decisions. Among the most widely used and respected technical indicators is the Relative Strength Index (RSI). Developed by J. Welles Wilder Jr., the RSI is a momentum oscillator that measures the speed and change of price movements. For both seasoned traders and burgeoning investors, understanding the RSI is crucial for gauging market sentiment, identifying potential reversals, and enhancing the precision of their investment strategies.
Understanding the Relative Strength Index (RSI)
At its core, the RSI is a sophisticated mathematical formula designed to quantify the strength of recent price changes, thereby indicating whether a stock is overbought or oversold. This insight can be invaluable for timing entry and exit points, reducing speculative risk, and fostering a more disciplined approach to market participation.
The Momentum Indicator at a Glance
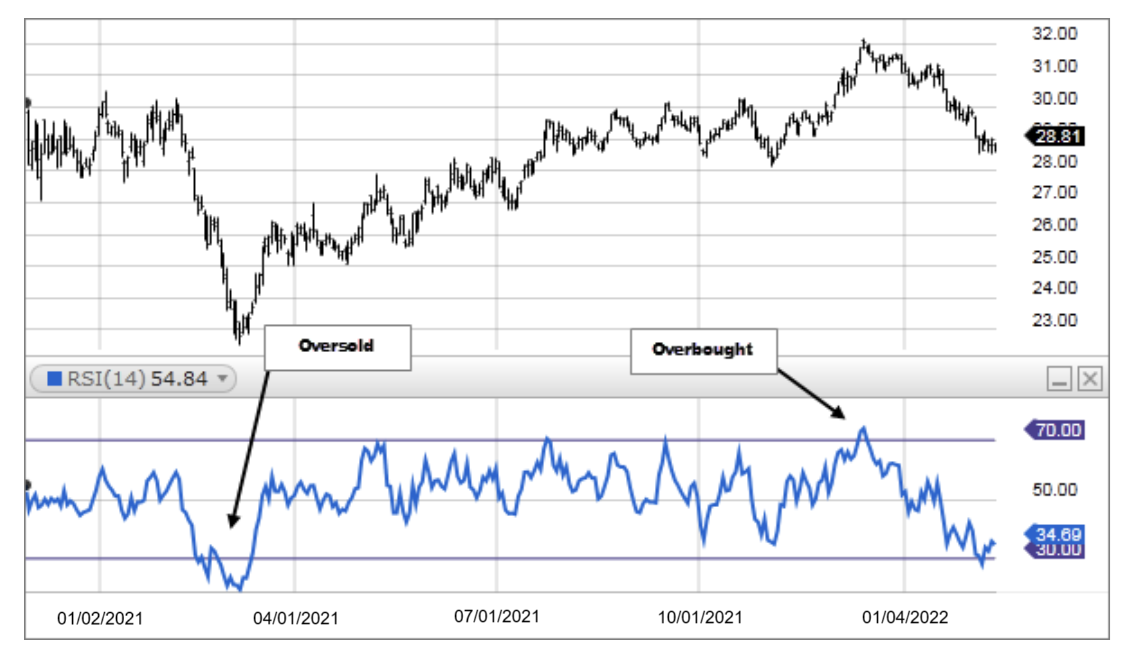
The Relative Strength Index operates as a leading indicator, meaning it often signals potential shifts in price direction before they become apparent on a standard price chart. It oscillates between zero and 100, providing a normalized scale that makes it easy to compare the momentum of different stocks or even the same stock over various periods. The fundamental premise behind RSI is that if a stock’s price has been increasing rapidly, it might be becoming overbought and due for a correction. Conversely, if a stock’s price has been falling sharply, it might be oversold and ripe for a rebound. This concept aligns with the natural ebb and flow of market cycles, where periods of aggressive buying are often followed by profit-taking, and excessive selling eventually attracts value investors.
The Calculation Behind RSI
While investors don’t typically need to perform the calculation manually (charting software does this automatically), understanding the underlying logic provides a deeper appreciation for the indicator’s utility. The RSI calculation involves a two-step process. First, it determines the “average gain” and “average loss” over a specified number of periods (the default and most common period is 14, e.g., 14 days for daily charts, 14 hours for hourly charts). Second, these averages are used to calculate the Relative Strength (RS), which is the average gain divided by the average loss. Finally, the RSI is derived from the RS using the formula: RSI = 100 – [100 / (1 + RS)].
This formula ensures that the RSI always falls within the 0 to 100 range. A higher RS value, indicating stronger gains relative to losses, pushes the RSI towards 100, signaling increasing momentum and potential overbuying. A lower RS value, where losses outweigh gains, pulls the RSI towards 0, suggesting weakening momentum and potential overselling. The 14-period setting is widely accepted because it offers a good balance between sensitivity (reacting to price changes) and smoothness (filtering out minor noise).
Interpreting the RSI Scale (0-100)
The RSI scale is segmented to provide clear visual cues for market conditions:
- Overbought Zone (Above 70): When the RSI crosses above 70, it suggests that the stock has been gaining momentum very rapidly, potentially indicating that it is overvalued in the short term and might be due for a price correction or a consolidation period. This doesn’t necessarily mean the price will immediately fall, but rather that the bullish trend might be exhausting itself.
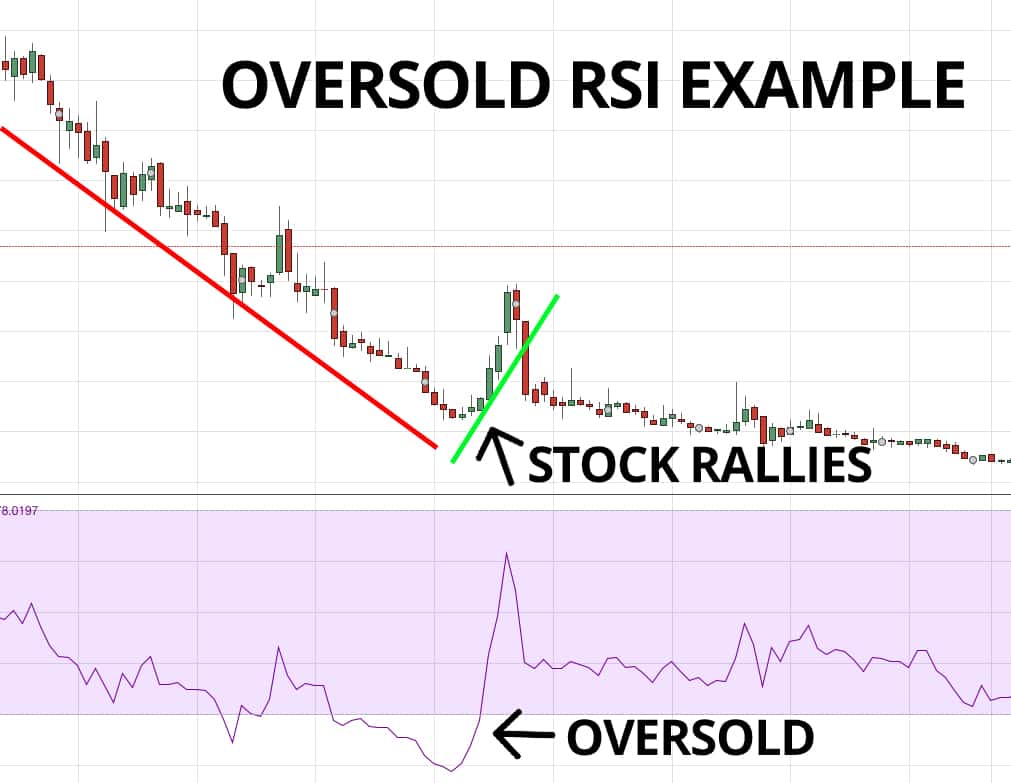
- Oversold Zone (Below 30): Conversely, when the RSI dips below 30, it implies that the stock has experienced significant selling pressure, potentially making it undervalued in the short term and poised for a rebound. Similar to the overbought condition, this is not a guaranteed bounce, but a signal that the bearish momentum might be waning.
- Neutral Zone (30-70): An RSI reading between 30 and 70 typically indicates that the stock’s price is moving within a relatively stable range, without significant overbought or oversold conditions. The 50-mark often acts as a centerline; a move above 50 can suggest increasing bullish momentum, while a move below 50 might indicate increasing bearish momentum.
It’s crucial to remember that these thresholds are not absolute buy or sell signals on their own. They are indicators of potential conditions that warrant further investigation using other analytical tools and market context.
Key RSI Signals for Investors
Beyond simply identifying overbought or oversold conditions, the RSI offers several more nuanced signals that can provide deeper insights into a stock’s trajectory. Recognizing these patterns can significantly enhance an investor’s ability to anticipate market movements.
Overbought and Oversold Conditions
The most straightforward application of the RSI is the identification of overbought and oversold regions. As discussed, an RSI above 70 indicates a strong buying spree that may be unsustainable, while an RSI below 30 suggests excessive selling that could lead to a bounce. Savvy investors often look for these extremes as potential opportunities for mean reversion trades. For example, if a stock with strong fundamentals experiences a temporary dip that pushes its RSI below 30, it might present an attractive buying opportunity. Conversely, a stock that has parabolic growth with an RSI consistently above 80 could be signaling an opportune time to take profits or tighten stop-loss orders. However, in strong bull markets, RSI can remain in overbought territory for extended periods without an immediate reversal, just as in strong bear markets, it can stay oversold. This highlights the importance of context and combining RSI with other indicators.
Divergence: A Powerful Warning Sign
One of the most potent signals generated by the RSI is divergence. Divergence occurs when the price of an asset moves in one direction while the RSI moves in the opposite direction, signaling a potential trend reversal.
- Bearish Divergence: This occurs when a stock’s price makes a new higher high, but the RSI fails to make a new higher high, instead forming a lower high. This indicates that the upward momentum is weakening, despite the price continuing to climb, often preceding a price correction or reversal downwards. It’s a warning that the buyers are losing conviction.
- Bullish Divergence: Conversely, bullish divergence happens when a stock’s price makes a new lower low, but the RSI forms a higher low. This suggests that the downward momentum is fading, even as the price falls, potentially signaling an upcoming reversal upwards. It implies that sellers are losing control, and a bounce could be imminent.
Divergences are particularly valuable because they provide an early warning sign, allowing investors to prepare for potential shifts before they fully materialize. They are stronger signals when observed at significant price highs or lows.
Centerline Crossover
The 50-level on the RSI scale often acts as a centerline, providing additional insights into the prevailing trend. A move above 50 generally indicates that the average gains are outperforming average losses, suggesting an increasing bullish momentum. Conversely, a move below 50 implies that average losses are exceeding average gains, signaling growing bearish momentum.

While not as strong a signal as overbought/oversold conditions or divergences, a sustained move above or below the 50-mark can confirm a trend. For instance, if a stock breaks above a resistance level and its RSI simultaneously crosses above 50, it could be seen as confirmation of renewed bullish interest. Similarly, a breakdown below support accompanied by an RSI drop below 50 might confirm a bearish turn.
Integrating RSI into Your Investment Strategy
While the RSI is a powerful tool, its true potential is unlocked when integrated thoughtfully into a broader investment strategy, rather than being used in isolation. No single indicator provides all the answers, and combining RSI with other forms of analysis leads to more robust decision-making.
RSI in Conjunction with Other Indicators
To mitigate the risk of false signals and enhance conviction, investors often pair RSI with other technical analysis tools.
- Moving Averages (MAs): Combining RSI with moving averages can provide excellent entry and exit points. For instance, an investor might consider buying when the RSI is oversold (below 30) AND the stock’s price is simultaneously above its 50-day or 200-day moving average, indicating that the short-term oversold condition might be a temporary dip within a larger uptrend. Conversely, a sell signal could be an overbought RSI (above 70) with the price breaking below a key moving average.
- Support and Resistance: Identifying support and resistance levels on a price chart provides crucial context for RSI signals. An oversold RSI at a strong support level or an overbought RSI at a significant resistance level significantly increases the probability of a reversal.
- Volume: Volume analysis can confirm the strength of RSI signals. A bullish divergence accompanied by increasing buying volume when the price is low adds weight to the potential for a rebound. Similarly, an overbought RSI coupled with declining volume at new price highs might signal a lack of conviction behind the ascent.
- Candlestick Patterns: Specific candlestick patterns (e.g., hammer, engulfing patterns) appearing at RSI extremes can further confirm potential turning points.
Timeframes and RSI Application
The RSI can be applied to any timeframe—from intraday charts (minutes, hours) for day traders to daily, weekly, or monthly charts for swing traders and long-term investors. The interpretation remains the same, but the implications change:
- Shorter Timeframes: On shorter timeframes, RSI signals tend to be more frequent but also more prone to noise. Traders using hourly or 15-minute charts might use RSI for quick entries and exits, aiming to capitalize on minor fluctuations.
- Longer Timeframes: For long-term investors, using RSI on daily or weekly charts provides a broader perspective, filtering out short-term volatility. An oversold RSI on a weekly chart for a fundamentally sound company might signal a significant buying opportunity for a sustained move, rather than just a quick bounce. It’s often recommended to check the RSI on multiple timeframes to get a comprehensive picture. For example, if a stock is oversold on the daily chart but still strong on the weekly chart, it suggests a potential buying opportunity for a short-term correction within a larger uptrend.
Limitations and Nuances
Despite its utility, the RSI is not a foolproof indicator. It has limitations that investors must be aware of:
- False Signals in Strong Trends: In a strong uptrend, RSI can remain in overbought territory (above 70) for extended periods without the price reversing significantly. Similarly, in a strong downtrend, it can stay oversold (below 30). Acting solely on these signals in such environments can lead to premature exits or entries against the prevailing trend.
- Lack of Price Targets: The RSI tells you about momentum and potential turning points but doesn’t provide price targets. Investors still need other methods (e.g., Fibonacci retracements, pivot points) to determine where a price might go after a reversal.
- Customization: While the default 14-period setting is standard, some traders adjust this to suit specific assets or trading styles. A shorter period (e.g., 7) makes the RSI more sensitive and generates more signals, while a longer period (e.g., 21) makes it smoother and generates fewer, but potentially more reliable, signals. Experimentation with different settings can be beneficial.
Practical Application and Risk Management
Effective use of the RSI in stock market investing demands not only a theoretical understanding but also practical application coupled with robust risk management principles.
Backtesting and Customization
Before fully integrating RSI into an active trading or investing strategy, it is prudent to backtest its effectiveness on historical data for the specific stocks or markets you intend to trade. This involves analyzing how RSI signals (overbought/oversold, divergences, crossovers) performed in the past under various market conditions. Backtesting helps investors understand the reliability and limitations of the indicator for their chosen assets and timeframes. Furthermore, while the 14-period RSI is standard, experimentation with different look-back periods (e.g., 7, 21, or even 28) can yield better results for certain securities. Some assets might react better to a more sensitive RSI, while others require a smoother reading. Customizing the RSI parameters to suit an asset’s unique volatility profile can significantly enhance its predictive power.
Avoiding Common Pitfalls
Several common mistakes can undermine the effective use of RSI:
- Trading Solely on Overbought/Oversold: As mentioned, a stock can remain overbought or oversold for extended periods in strong trends. Blindly buying when RSI hits 30 or selling when it hits 70 without considering the broader market context or other indicators is a recipe for whipsaws and losses.
- Ignoring Trend: The RSI is best used in conjunction with the primary trend. In an undeniable uptrend, oversold RSI conditions might be treated as buying opportunities, while overbought conditions might be ignored or used for minor profit-taking. Conversely, in a strong downtrend, overbought RSI conditions could be selling opportunities, while oversold conditions might be short-lived bounces.
- Lack of Confirmation: Relying on a single RSI signal without confirmation from other indicators or price action analysis can lead to poor decisions. Always seek confluence—when multiple indicators or analytical methods point to the same conclusion—for higher probability trades.
RSI as Part of a Comprehensive Approach
Ultimately, the Relative Strength Index is a valuable component of a comprehensive investment toolkit. It provides crucial insights into the momentum and sentiment behind price movements, helping investors identify potential turning points and confirm existing trends. However, it should never be the sole basis for investment decisions. A robust strategy typically combines RSI with:
- Fundamental Analysis: Understanding a company’s financial health, industry position, and growth prospects provides the foundational context for any technical signal. A strong RSI signal for a fundamentally sound company is more compelling than for a struggling one.
- Other Technical Indicators: Employing a combination of trend-following indicators (like moving averages), volatility indicators (like Bollinger Bands), and other oscillators (like MACD) can create a more complete picture.
- Risk Management: Setting clear stop-loss orders, defining position sizes, and adhering to a strict risk-reward ratio are paramount for capital preservation, regardless of the indicators used.
By integrating the RSI intelligently and understanding its strengths and limitations, investors can significantly sharpen their market analysis, improve their timing, and navigate the complexities of the stock market with greater confidence and discipline.
aViewFromTheCave is a participant in the Amazon Services LLC Associates Program, an affiliate advertising program designed to provide a means for sites to earn advertising fees by advertising and linking to Amazon.com. Amazon, the Amazon logo, AmazonSupply, and the AmazonSupply logo are trademarks of Amazon.com, Inc. or its affiliates. As an Amazon Associate we earn affiliate commissions from qualifying purchases.