
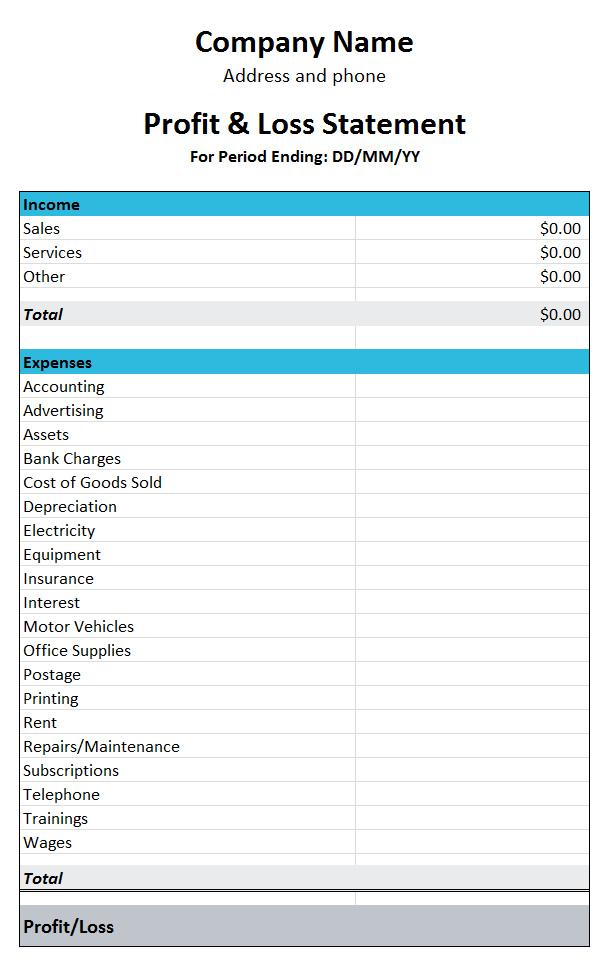
In the dynamic world of business, understanding financial performance is paramount to success. While the balance sheet offers a snapshot of a company’s assets and liabilities at a given moment, and the cash flow statement tracks the movement of cash, there’s one critical document that tells the story of a company’s operational triumphs and challenges over a period: the Profit and Loss (P&L) statement. Also known as an Income Statement or Statement of Financial Performance, the P&L statement is a fundamental financial report that summarizes the revenues, costs, and expenses incurred during a specific period—typically a quarter or a fiscal year. It acts as a report card, revealing whether a business has made a profit or incurred a loss, making it an indispensable tool for management, investors, and lenders alike.
The Core Purpose and Importance of a P&L Statement
The primary objective of a Profit and Loss statement is to present a clear picture of a company’s financial performance over a defined period. Beyond simply showing a bottom-line profit or loss, its insights are crucial for a multitude of strategic and operational functions within an organization.
Gauging Financial Health and Performance
At its heart, the P&L statement is the most direct indicator of a business’s financial health and operational efficiency. By meticulously detailing all income generated and expenses incurred, it allows stakeholders to quickly ascertain if the company is generating enough revenue to cover its costs and, ultimately, deliver a profit. A consistent track record of profitability, as displayed on the P&L, signals a robust business model, effective cost management, and strong market demand for its products or services. Conversely, a P&L revealing recurring losses can indicate underlying issues such as declining sales, escalating costs, or inefficient operations, prompting a deeper investigation and corrective actions. It’s a vital tool for understanding not just if a company is profitable, but how it arrived at that state, highlighting trends in revenue growth, cost containment, and overall operational effectiveness.
Informing Strategic Decisions
For management teams, the P&L statement is a living document that directly informs strategic decision-making. Analyzing trends in revenue streams can help identify which products or services are performing well and which might need re-evaluation or discontinuation. A detailed breakdown of expenses allows for budget adjustments, cost-cutting initiatives, or reallocation of resources to more profitable ventures. For instance, an increase in marketing expenses yielding no proportional increase in sales might prompt a change in advertising strategy. Similarly, a rising cost of goods sold (COGS) could trigger negotiations with suppliers or a review of production processes. Investors and lenders also scrutinize the P&L to assess a company’s earning potential and its ability to service debt or generate returns. It helps them determine the viability of an investment or the creditworthiness of a borrower, influencing decisions on equity financing, loans, or mergers and acquisitions. Without a clear P&L, strategic planning would be akin to navigating in the dark.
Meeting Regulatory and Compliance Requirements
Beyond internal analysis and external investment considerations, the Profit and Loss statement plays a non-negotiable role in regulatory compliance and legal obligations. Businesses are legally required to prepare P&L statements for tax purposes, as the statement forms the basis for calculating taxable income. Government agencies, such as the Internal Revenue Service (IRS) in the U.S., rely on these reports to ensure businesses are accurately reporting their earnings and paying their fair share of taxes. Furthermore, publicly traded companies must regularly disclose their P&L statements to regulatory bodies like the Securities and Exchange Commission (SEC) and to their shareholders, ensuring transparency and providing essential information for investors to make informed decisions. Audits often begin with a thorough examination of the P&L to verify the accuracy of financial reporting. Adherence to generally accepted accounting principles (GAAP) or international financial reporting standards (IFRS) in preparing these statements is crucial to maintain credibility and avoid legal repercussions.
Key Components of a Profit and Loss Statement
A P&L statement, while appearing complex at first glance, is systematically organized to present a clear narrative of a company’s financial journey over a specific period. Understanding each component is essential to deciphering the overall picture.
Revenue (Sales)
Revenue, often referred to as sales, is the starting point of any P&L statement and represents the total amount of money a company earns from its primary business activities before deducting any expenses. This typically includes income from selling goods, providing services, or, in some cases, licensing intellectual property. It’s crucial to distinguish between gross revenue (total sales before returns or discounts) and net revenue (gross revenue minus sales returns, allowances, and discounts). Net revenue is the figure usually reported on the P&L, as it provides a more accurate representation of the actual income generated from customer transactions.
Cost of Goods Sold (COGS)
Directly following revenue is the Cost of Goods Sold (COGS), which represents the direct costs attributable to the production of the goods a company sells or the services it provides. For a manufacturing company, COGS includes the cost of raw materials, direct labor involved in production, and manufacturing overhead (e.g., factory utilities). For a retail business, it’s the cost paid to acquire the merchandise it sells. For a service-based business, it might include the direct costs of delivering that service. COGS is calculated as: Beginning Inventory + Purchases – Ending Inventory. It’s a critical component because subtracting COGS from revenue yields the company’s gross profit, a fundamental measure of profitability.
Gross Profit
Gross Profit is a vital interim profitability metric, calculated by subtracting the Cost of Goods Sold (COGS) from Net Revenue. This figure represents the profit a company makes from its core product or service sales before accounting for other operating expenses. A healthy gross profit margin (Gross Profit / Revenue) indicates efficient production processes, competitive pricing strategies, and effective management of supply chain costs. It shows how much money is left to cover the company’s operating costs and still generate a net profit.
Operating Expenses
After gross profit, the P&L statement lists operating expenses, which are the costs a business incurs that are not directly tied to the production of goods or services, but are necessary to run the business on a day-to-day basis. These are often categorized into Selling, General, and Administrative (SG&A) expenses.
-
Selling Expenses: Costs related to marketing and selling products, such as advertising, sales commissions, and delivery costs.
-
General and Administrative Expenses: Costs for overall business operations, including salaries of administrative staff, rent, utilities, office supplies, insurance, and professional fees.
-
Depreciation and Amortization: Non-cash expenses that systematically allocate the cost of tangible assets (depreciation) and intangible assets (amortization) over their useful lives.
Managing operating expenses effectively is key to improving a company’s overall profitability.
Operating Income (EBIT)
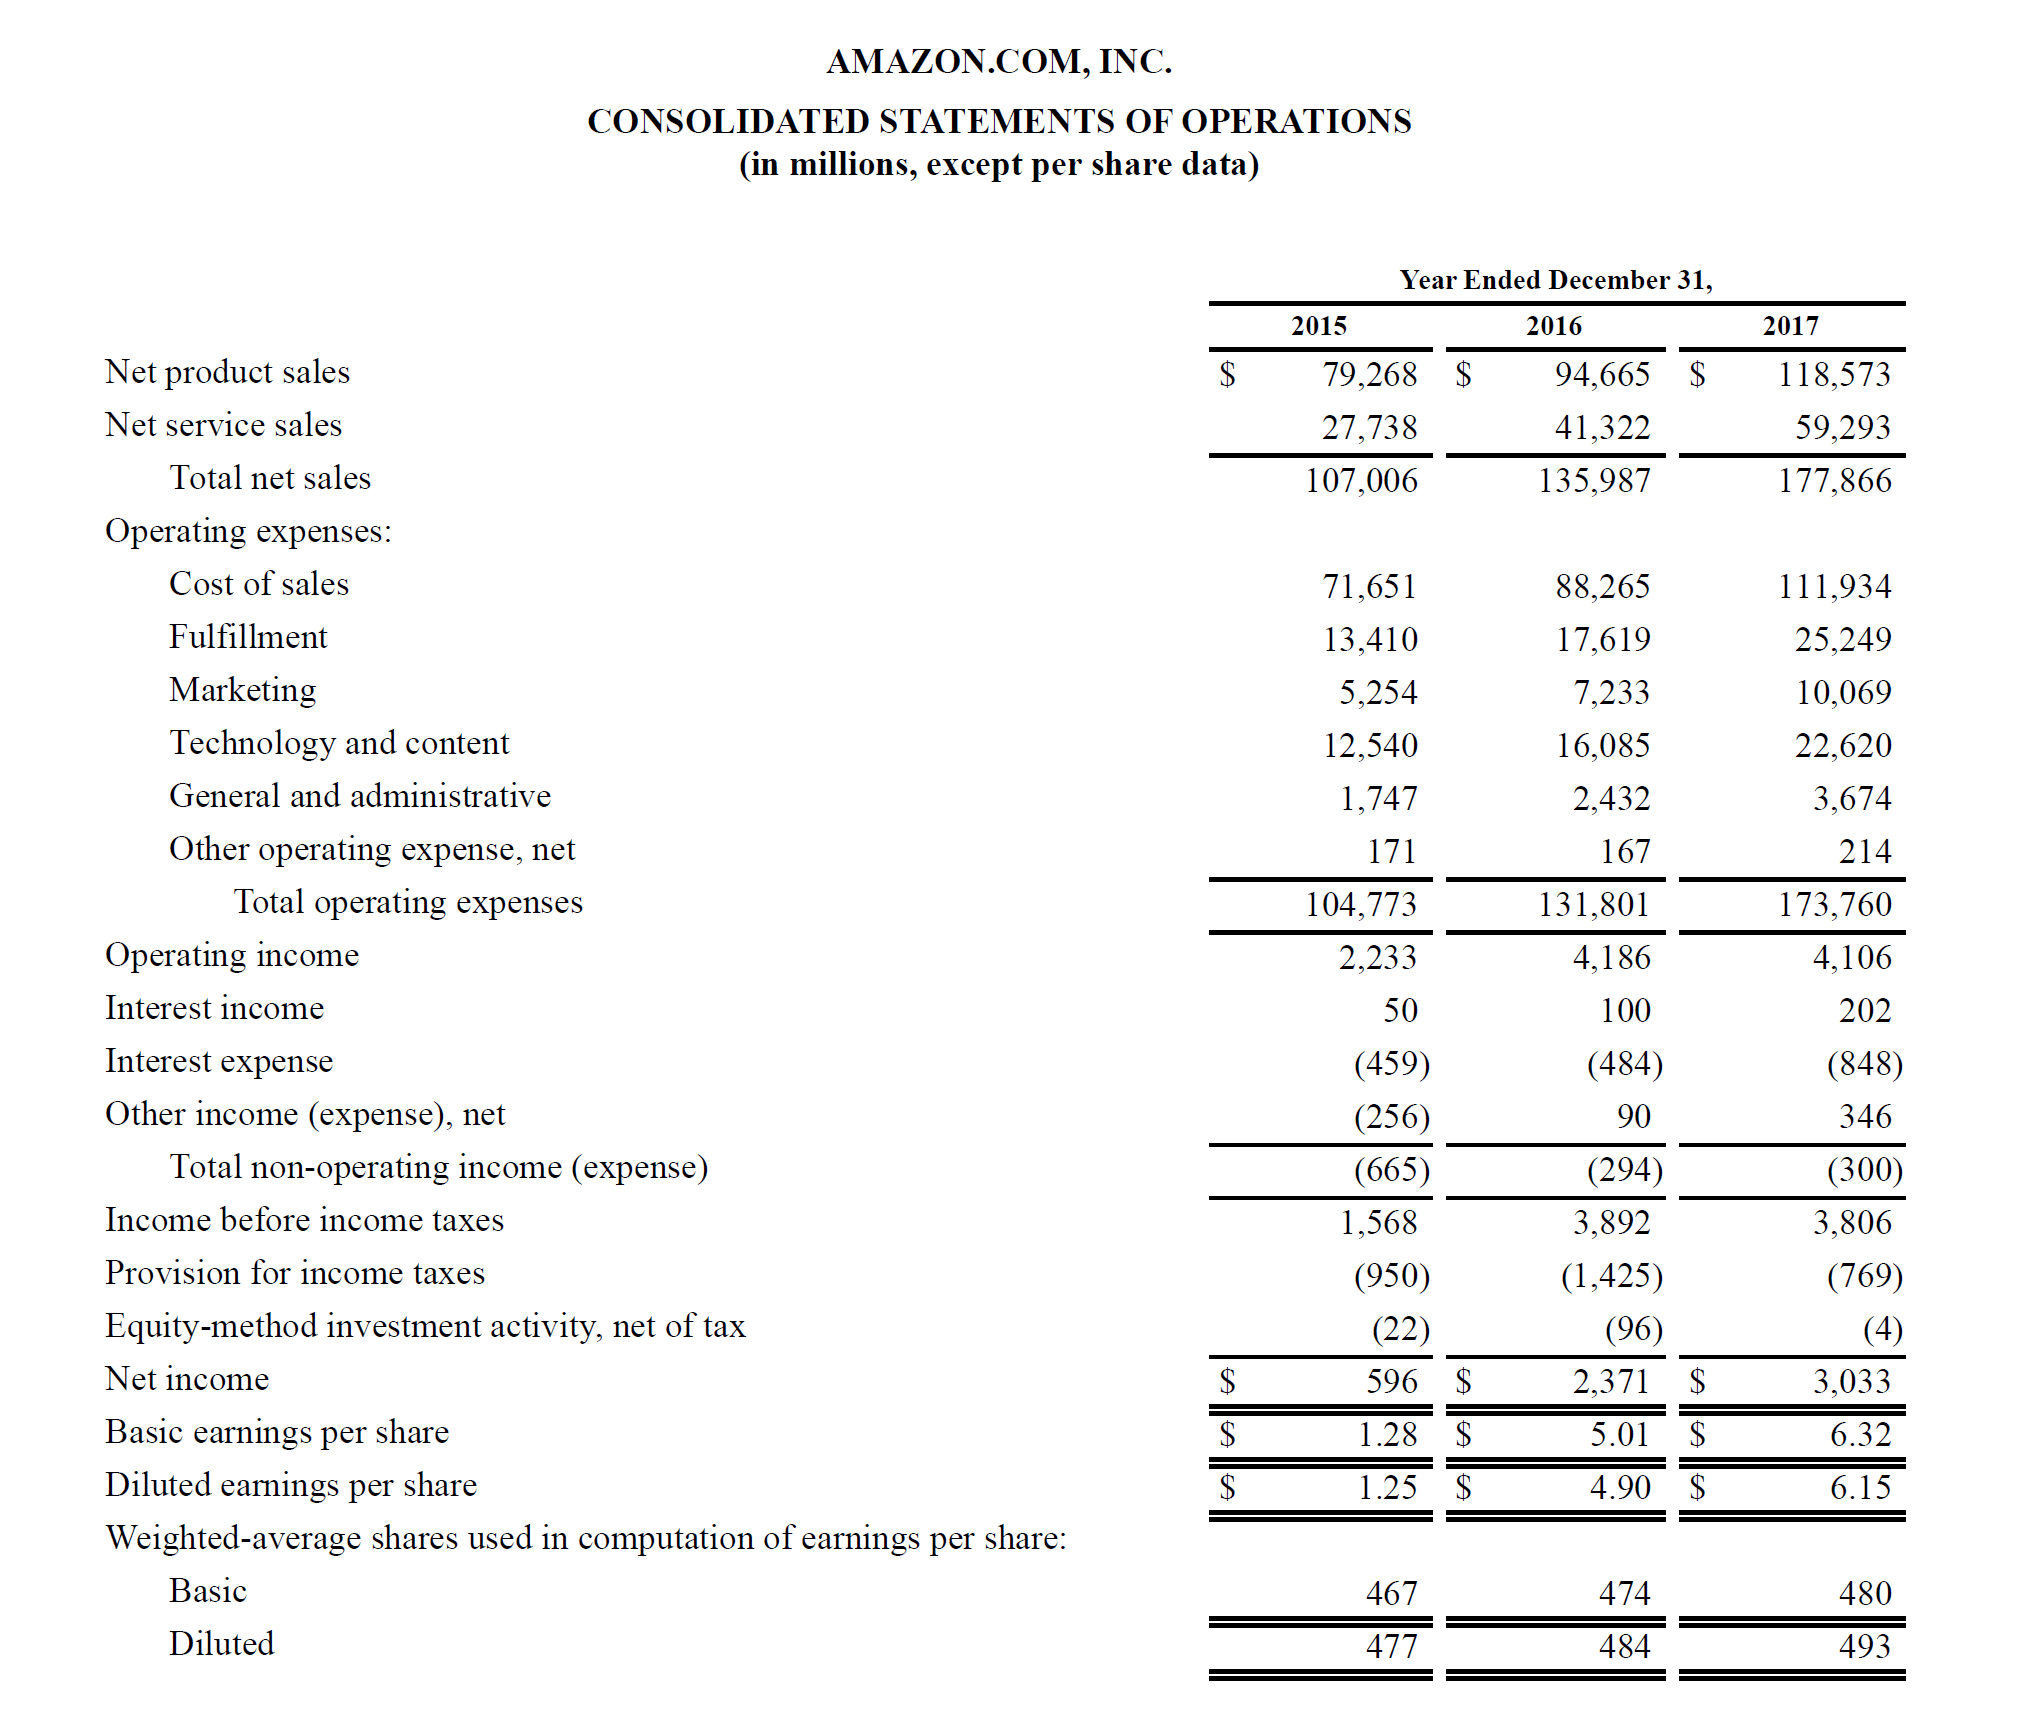
Operating Income, often referred to as Earnings Before Interest and Taxes (EBIT), is calculated by subtracting total Operating Expenses from Gross Profit. This figure indicates the profit a company generates from its core business operations, before accounting for interest payments on debt and income taxes. Operating income is a crucial metric for evaluating the efficiency and effectiveness of a company’s primary business activities, as it removes the impact of financing decisions and tax strategies. A consistent growth in operating income signals a strong and sustainable business model.
Other Income and Expenses
Below operating income, the P&L statement includes “Other Income and Expenses.” These are revenues and costs that are not generated from the company’s core business operations. Examples include interest income earned on investments, interest expense paid on loans, gains or losses from the sale of assets (like property or equipment), or income/expenses from non-operating ventures. These items can significantly impact the final net income but are separated to provide a clearer view of core operational performance.
Income Tax Expense
The Income Tax Expense represents the amount of money a company owes in taxes on its taxable income. This figure is typically calculated after all other revenues and expenses, including interest, have been accounted for, as taxes are levied on the company’s profit. Tax rates and regulations can vary significantly by jurisdiction, making this a complex area often requiring professional accounting expertise.
Net Income (The Bottom Line)
The final line item on the P&L statement is Net Income, often called “the bottom line.” This is the ultimate measure of a company’s profitability for the reporting period. It’s calculated by taking Operating Income, adding other income, subtracting other expenses, and finally subtracting income tax expense. If the figure is positive, the company made a profit; if negative, it incurred a loss. Net income is what remains for shareholders (either reinvested in the business as retained earnings or distributed as dividends) and is a key indicator of a company’s overall financial success and ability to generate wealth for its owners.
How to Read and Interpret a P&L Statement
Simply generating a P&L statement is only the first step; the real value lies in its interpretation. Savvy business owners and investors know that reading a P&L involves more than just glancing at the net income figure. It requires contextual analysis and the application of various analytical techniques.
Understanding the Reporting Period
The first crucial step in interpreting any P&L statement is to identify its reporting period. Is it for a month, a quarter, or an entire fiscal year? The P&L is always a summary over a period of time, unlike the balance sheet which is a point in time. Understanding this context is vital because performance can fluctuate seasonally or due to one-off events. Comparing a P&L for a holiday quarter to a non-holiday quarter, for instance, without acknowledging the seasonal differences, would lead to inaccurate conclusions. Consistent reporting periods are essential for meaningful comparisons and trend analysis.
Vertical Analysis (Common-Size Statement)
Vertical analysis, also known as creating a common-size P&L statement, involves expressing each line item as a percentage of total revenue. This technique is incredibly powerful because it standardizes the statement, making it easier to compare a company’s performance over different periods or to benchmark it against competitors, regardless of their size. For example, if COGS consistently represents 40% of revenue, and suddenly jumps to 50%, it signals an issue with production efficiency or pricing. Vertical analysis helps identify structural changes in cost structures or revenue generation, allowing for a deeper understanding of efficiency and profitability drivers.
Horizontal Analysis (Trend Analysis)
Horizontal analysis involves comparing line items across multiple reporting periods (e.g., comparing Q1 of this year to Q1 of last year, or year-over-year growth). This method highlights trends, growth rates, and significant changes over time. By observing increases or decreases in revenue, COGS, operating expenses, or net income over several periods, businesses can identify patterns, forecast future performance, and spot anomalies. For instance, a steady increase in sales revenue accompanied by a proportional increase in net income indicates healthy growth. Conversely, rising revenue with stagnating net income might suggest increasing expenses eating into profits, prompting further investigation.
Key Ratios Derived from P&L
Financial ratios extracted from the P&L statement provide powerful, standardized metrics for assessing specific aspects of a company’s performance.
-
Gross Profit Margin: (Gross Profit / Revenue) * 100. This ratio indicates the percentage of revenue remaining after accounting for the cost of goods sold. A higher margin suggests more efficient production or better pricing power.
-
Operating Profit Margin: (Operating Income / Revenue) * 100. This shows the profitability from a company’s core operations. It indicates how much profit is generated from each dollar of sales before interest and taxes.
-
Net Profit Margin: (Net Income / Revenue) * 100. This is the ultimate measure of profitability, showing how much net income a company makes for every dollar of revenue. A higher net profit margin indicates strong overall financial performance.
Analyzing these ratios in conjunction with vertical and horizontal analysis provides a holistic view of a company’s profitability, efficiency, and financial health.
The P&L Statement vs. Other Financial Statements
While the P&L statement provides critical insights into a company’s profitability over time, it’s just one piece of the larger financial puzzle. To gain a comprehensive understanding, it must be viewed in conjunction with the other primary financial statements: the Balance Sheet and the Cash Flow Statement. Each serves a distinct purpose and offers a unique perspective.
P&L vs. Balance Sheet
The fundamental difference between the P&L statement and the Balance Sheet lies in what they measure and when. The P&L statement is like a movie of a company’s financial activity over a period (e.g., a quarter or a year). It reports on revenues earned and expenses incurred during that time, culminating in a net profit or loss. It answers the question: “How did the company perform financially during this period?”
The Balance Sheet, on the other hand, is a snapshot of a company’s financial position at a single point in time (e.g., December 31st). It details what a company owns (assets), what it owes (liabilities), and the owner’s investment in the company (equity). It adheres to the accounting equation: Assets = Liabilities + Equity. The Balance Sheet answers the question: “What is the company’s financial position right now?”
While distinct, they are interconnected. The net income from the P&L statement flows into the Retained Earnings section of the Balance Sheet, affecting the equity of the company. A profitable P&L increases retained earnings, thereby increasing equity on the balance sheet.
P&L vs. Cash Flow Statement
The distinction between the P&L statement and the Cash Flow Statement often causes confusion, primarily due to the concept of accrual accounting. The P&L statement is prepared using accrual basis accounting. This means revenues are recognized when earned (even if cash hasn’t been received yet) and expenses are recognized when incurred (even if cash hasn’t been paid yet). This approach provides a clearer picture of economic performance and matches revenues with the expenses that generated them, but it doesn’t necessarily reflect actual cash movements.
The Cash Flow Statement, however, tracks the actual movement of cash into and out of the business during a specific period. It is divided into three sections:
-
Operating Activities: Cash flows from the company’s primary business operations.
-
Investing Activities: Cash flows related to the purchase or sale of long-term assets.
-
Financing Activities: Cash flows from debt, equity, and dividend payments.
The Cash Flow Statement addresses the crucial question: “Where did the cash come from, and where did it go?” It can explain why a highly profitable company (according to its P&L) might still struggle with cash flow, perhaps due to delayed customer payments or significant capital expenditures. Conversely, a company with a P&L showing a loss might still have positive cash flow if it sells off assets or takes out new loans.
Together, these three statements provide a holistic view of a company’s financial story. The P&L shows profitability, the Balance Sheet shows financial position, and the Cash Flow Statement shows liquidity. Relying on just one would give an incomplete and potentially misleading picture.
Best Practices for Businesses Regarding P&L
To truly leverage the power of the Profit and Loss statement, businesses must adopt certain best practices that extend beyond mere report generation. These practices transform the P&L from a static document into a dynamic tool for growth and strategic management.
Regular Review and Analysis
The P&L statement is not a report to be filed away once generated. It requires regular, proactive review and in-depth analysis. Business owners should make it a habit to scrutinize their P&L monthly, or at least quarterly, comparing current performance to previous periods, budgets, and industry benchmarks. This ongoing analysis helps to:
-
Identify Trends: Spot upward or downward trends in revenue, COGS, and operating expenses early on.
-
Pinpoint Issues: Quickly identify areas where costs are escalating unexpectedly or where revenue is falling short of projections.
-
Evaluate Strategies: Assess the effectiveness of recent business decisions, such as marketing campaigns, pricing changes, or cost-cutting measures.
-
Allocate Resources: Make informed decisions about where to invest more resources and where to pull back.
Simply looking at the bottom line isn’t enough; understanding the drivers behind that profit or loss is paramount.
Accuracy and Consistency
The reliability of any financial statement hinges on the accuracy and consistency of the underlying data. Inaccurate entries, misclassified expenses, or inconsistent accounting methods can severely distort the P&L, leading to flawed analysis and poor decision-making. Businesses should implement robust internal controls to ensure all financial transactions are recorded precisely and promptly. This includes:
-
Reconciling Accounts: Regularly reconcile bank statements, credit card statements, and other financial accounts.
-
Proper Classification: Ensure revenues and expenses are correctly categorized (e.g., differentiating between COGS and operating expenses).
-
Consistent Application of Accounting Principles: Stick to the same accounting methods (e.g., depreciation methods, inventory valuation) from one period to the next to ensure comparability.
Consistency is key for accurate horizontal analysis and benchmarking.
Leveraging Technology
In today’s digital age, manual creation and analysis of P&L statements are largely inefficient and prone to error. Modern accounting software and financial management tools have revolutionized how businesses manage their P&L. Solutions like QuickBooks, Xero, Sage, and various ERP systems can:
-
Automate Data Entry: Reduce manual effort and human error by integrating with banks, payment processors, and other business systems.
-
Generate Reports Instantly: Create detailed and customized P&L statements with just a few clicks.
-
Facilitate Analysis: Offer built-in reporting features, dashboards, and ratio analysis tools to simplify interpretation.
-
Support Budgeting and Forecasting: Integrate P&L data into budgeting and forecasting models for more accurate future planning.
Embracing technology not only saves time but also enhances the accuracy and analytical depth of P&L reporting.
Seeking Professional Guidance
While small business owners can certainly learn to understand their P&L, the complexities of accounting principles, tax laws, and in-depth financial analysis often warrant professional expertise. Engaging with qualified accountants, bookkeepers, or financial advisors can provide invaluable support:
-
Ensuring Compliance: Professionals can ensure the P&L adheres to GAAP/IFRS and relevant tax regulations.
-
Optimizing Financial Strategy: Advisors can help interpret complex P&L data, identify strategic opportunities, and develop plans to improve profitability and efficiency.
-
Forecasting and Budgeting: They can assist in creating realistic financial projections and budgets based on historical P&L performance.
-
Audit Preparation: Their expertise is crucial during audits, ensuring all financial records are in order and readily explainable.
For businesses of all sizes, professional guidance can transform the P&L from a mere compliance document into a powerful strategic asset.

Conclusion
The Profit and Loss statement is undeniably one of the most vital financial documents a business possesses. Far more than just a tally of income and expenditure, it serves as a dynamic narrative of a company’s financial performance over time. By meticulously detailing revenues, costs, and expenses, it unveils whether a business is generating a profit or incurring a loss, thereby offering unparalleled insights into its operational efficiency, pricing strategies, and overall financial health. For management, it’s a compass for strategic decision-making, guiding everything from product development to resource allocation. For investors and lenders, it’s a critical barometer of a company’s earning potential and creditworthiness.
Understanding each component—from top-line revenue to the bottom-line net income—and knowing how to interpret the statement through various analytical techniques are indispensable skills for any stakeholder. When viewed in concert with the Balance Sheet and Cash Flow Statement, the P&L contributes to a holistic and robust understanding of a company’s financial landscape. By adopting best practices such as regular review, ensuring accuracy, leveraging technology, and seeking professional guidance, businesses can transform their P&L from a mandatory report into a powerful strategic tool that drives sustainable growth and long-term success.
aViewFromTheCave is a participant in the Amazon Services LLC Associates Program, an affiliate advertising program designed to provide a means for sites to earn advertising fees by advertising and linking to Amazon.com. Amazon, the Amazon logo, AmazonSupply, and the AmazonSupply logo are trademarks of Amazon.com, Inc. or its affiliates. As an Amazon Associate we earn affiliate commissions from qualifying purchases.