
In the dynamic and often bewildering world of finance, terms like “points” are thrown around with such frequency that they can seem like an esoteric language designed solely for market professionals. Yet, understanding what a “point” signifies in the stock market is fundamental for anyone looking to comprehend daily market movements, interpret news headlines, or even simply follow their investments. Far from being a mere jargon, a “point” is a crucial unit of measurement that helps investors and analysts gauge the scale and direction of market shifts, particularly when discussing major stock indices. It’s a concept that underpins much of financial reporting and market analysis, providing a common language to articulate changes in market value.
This article will meticulously demystify the concept of a “point” in the stock market, exploring its various applications, distinguishing it from percentage changes, and explaining its profound relevance to major market indices like the Dow Jones Industrial Average (DJIA) and the S&P 500. By the end, you’ll not only grasp what a point is but also how to interpret its movements, empowering you to make more informed decisions and better understand the narrative of the global financial markets.
Demystifying the “Point”: A Core Concept in Market Analysis
At its most basic, a “point” in the stock market refers to a unit of change in the value of an index or, less commonly, an individual stock. However, its significance and interpretation vary dramatically depending on the context. While it might seem straightforward, the distinction between a point and other measures like dollar amounts or percentages is crucial for accurate market comprehension. It’s a fundamental building block for discussing market performance and an essential component of financial literacy.
Points vs. Dollars: Understanding the Distinction
When discussing individual stocks, a “point” is often synonymous with a single dollar. For instance, if a stock trading at $50 rises by one point, it means its price has increased to $51. Conversely, if it drops by two points, its price falls to $48. This direct correlation makes understanding individual stock movements relatively simple. However, the term “point” truly gains its unique meaning and importance when applied to stock market indices. Unlike individual stock prices, which are quoted in dollars and cents, indices are abstract numerical values representing the aggregate performance of a basket of stocks. In this context, a point does not equate to a dollar value in the same direct manner, as indices do not trade like individual stocks. Instead, they are calculated values, and a point movement reflects a change in that calculated value.
The Role of Indices: Where Points Predominate
The true domain of the “point” is in the measurement of stock market indices. An index, such as the Dow Jones Industrial Average (DJIA) or the S&P 500, is a statistical measure that tracks the performance of a selected group of stocks, aiming to represent the overall health or a specific segment of the stock market. These indices are not assets you can directly buy or sell (though there are index funds and ETFs that track them). Instead, their values are derived from the prices of their constituent stocks, often weighted by factors like market capitalization.
When you hear that “the Dow gained 300 points today,” it signifies that the calculated value of the Dow Jones Industrial Average has increased by 300 units from its previous closing value. Each “point” in an index represents a specific, predefined increment in its numerical value. For indices that are price-weighted, like the DJIA, a point might reflect a sum of specific dollar changes across its component stocks. For market-cap-weighted indices like the S&P 500, a point represents a proportional change based on the combined market value of its constituents. Understanding that indices are abstract numbers, not direct dollar values, is key to appreciating the concept of a point in this context.
Why Not Always Percentages? The Contextual Value of Points
While percentage changes offer a standardized way to compare performance across different assets regardless of their absolute value, points provide a sense of scale and momentum within a particular index. For instance, a 100-point gain on an index trading at 10,000 points is a 1% increase, whereas a 100-point gain on an index trading at 30,000 points is only a 0.33% increase. Both scenarios involve the same “point” movement, but their percentage implications differ significantly.
Financial news often reports point changes because they convey a more immediate and visceral impact for those familiar with the typical range of an index. A headline stating “Dow drops 500 points” often grabs more attention and conveys a greater sense of market turmoil than “Dow drops 1.5%,” even if the percentage change is the more accurate measure for comparative analysis. Points offer a historical context, as investors become accustomed to the typical daily fluctuations in point terms for key indices. Both points and percentages are valuable, but they serve slightly different communicative and analytical purposes.
Points in Action: Major Market Indices
To truly grasp the concept of a “point,” it’s essential to see it in action within the context of the world’s most influential stock market indices. These indices serve as barometers for the overall health and direction of national and global economies, and their daily point movements are closely watched by investors, economists, and policymakers alike.
The Dow Jones Industrial Average (DJIA): A Classic Example
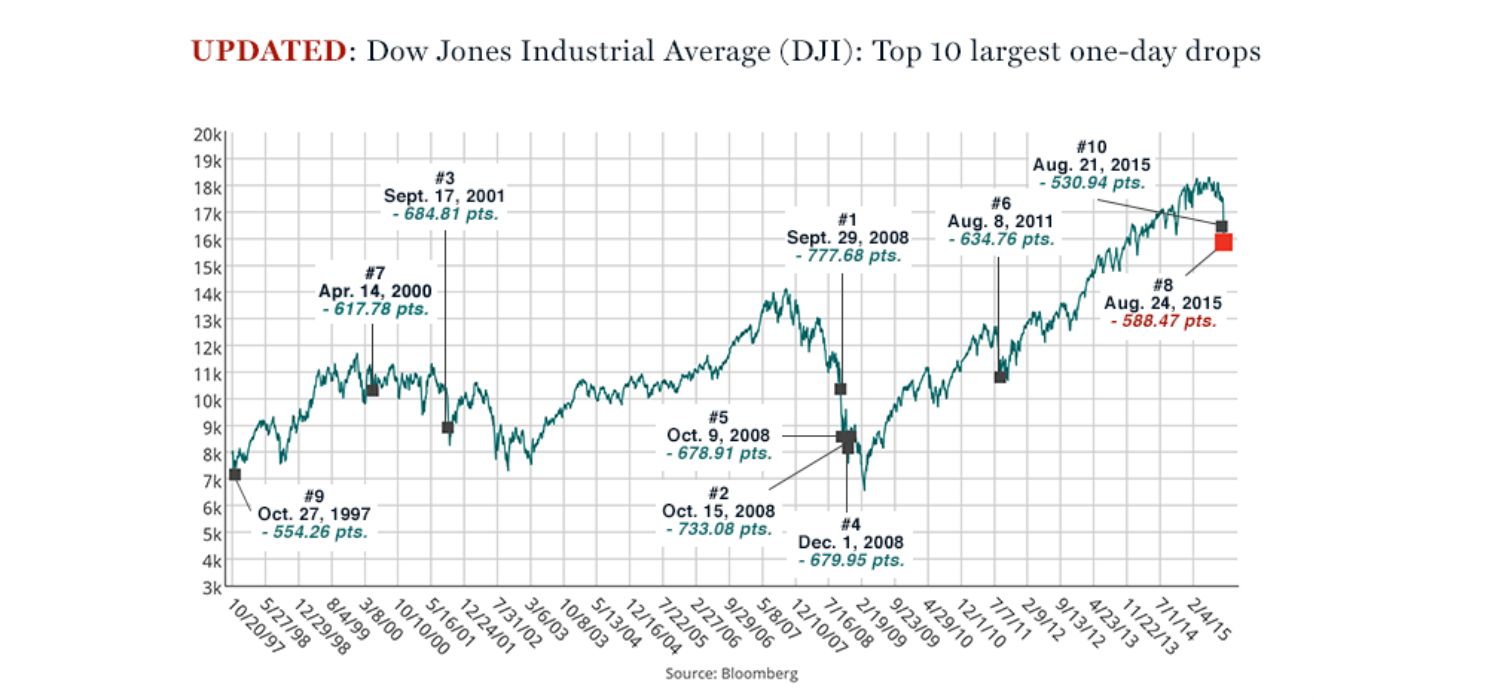
Perhaps the most famous example where “points” are predominantly used is the Dow Jones Industrial Average (DJIA). Composed of 30 large, publicly traded companies based in the United States, the DJIA is a price-weighted index. This means its value is derived by summing the prices of its 30 component stocks and then dividing that sum by a “Dow divisor” – a number adjusted for stock splits, spin-offs, and other structural changes to maintain continuity.
When the DJIA moves by “X points,” it signifies a change in this calculated index value. For example, if the Dow closes at 35,000 points one day and then opens at 35,100 points the next, it has risen by 100 points. Each point in the Dow reflects a collective dollar change across its component stocks, weighted by their influence on the divisor. Due to the high nominal value of the Dow (currently in the tens of thousands), even a significant point movement, say 500 points, might represent a relatively modest percentage change, often in the range of 1% to 2%.
S&P 500 and Other Broad Market Barometers
While the DJIA is a prominent example, points are also frequently used when discussing other major indices, although with slightly different interpretations due to their calculation methodologies. The S&P 500, for instance, is a market-capitalization-weighted index that tracks 500 of the largest U.S. publicly traded companies. Unlike the Dow, where higher-priced stocks have a greater impact, in the S&P 500, companies with larger market values have a greater influence on the index’s movement.
When the S&P 500 moves by points, say 20 points, it reflects a proportional change in the aggregate market value of its constituent companies. Given the S&P 500’s current nominal value (in the thousands), a 20-point movement might represent a fraction of a percent change. Other indices, such as the Nasdaq Composite (heavy on tech stocks) or international indices like the FTSE 100 (UK) or Nikkei 225 (Japan), also report their movements in points, providing a quick snapshot of their daily performance for investors around the globe.
The Nuance of Point Movements in Different Indices
It’s crucial to understand that a “point” in one index is not equivalent to a “point” in another. A 100-point move in the Dow Jones Industrial Average (which might be around 0.3% when the Dow is at 35,000) represents a much smaller relative change than a 100-point move in, say, a newer or smaller index trading at only 2,000 points (which would be a 5% change). This underscores the importance of considering the base value of the index when interpreting point changes. Without this context, point movements alone can be misleading. While points provide a useful, quick-glance measure, they should always be considered alongside percentage changes for a more accurate and comparable understanding of market performance.
Interpreting Point Movements: What Do They Mean for Investors?
Beyond merely knowing what a point is, the real value lies in understanding what point movements signify for investors. Market movements, whether measured in points or percentages, are not just abstract numbers; they are indicators of market sentiment, economic health, and potential impacts on individual investment portfolios.
Gauging Market Sentiment and Volatility
Large point swings, particularly in major indices like the Dow, are often interpreted as reflections of strong market sentiment – either bullish (upward trend) or bearish (downward trend) – or significant market volatility. A day where the Dow moves 500 points can signal a major reaction to economic news, geopolitical events, or shifts in corporate earnings outlooks. Consecutive days of large point gains might indicate growing investor confidence, while repeated large point losses can suggest fear and uncertainty.
Understanding the magnitude of typical daily point movements for a given index helps investors calibrate their expectations. When a day’s movement significantly exceeds this average, it suggests heightened volatility and often warrants a deeper dive into the underlying causes, such as a surprising inflation report or a major policy announcement from a central bank.
From Points to Portfolio: The Impact on Individual Investments
While indices move in points, individual investment portfolios are directly impacted by the dollar changes in the stocks, bonds, and other assets they hold. However, the overall market’s point movement can influence the performance of individual investments. If the broad market index, such as the S&P 500, experiences a substantial point gain, it’s highly probable that many of the stocks within that index (and perhaps even others not directly in the index) will also see their prices rise. Conversely, a significant point drop in the market often leads to widespread declines across individual holdings.
Investors use index point movements as a general indicator of the market’s direction and strength. For diversified portfolios, the overall market trend often acts as a significant tailwind or headwind. While specific stocks may buck the trend due to company-specific news, the market’s aggregate point movement provides a crucial context for understanding daily portfolio fluctuations. It helps investors determine whether their portfolio’s performance is in line with, outperforming, or underperforming the broader market.
Long-Term Trends vs. Daily Fluctuations
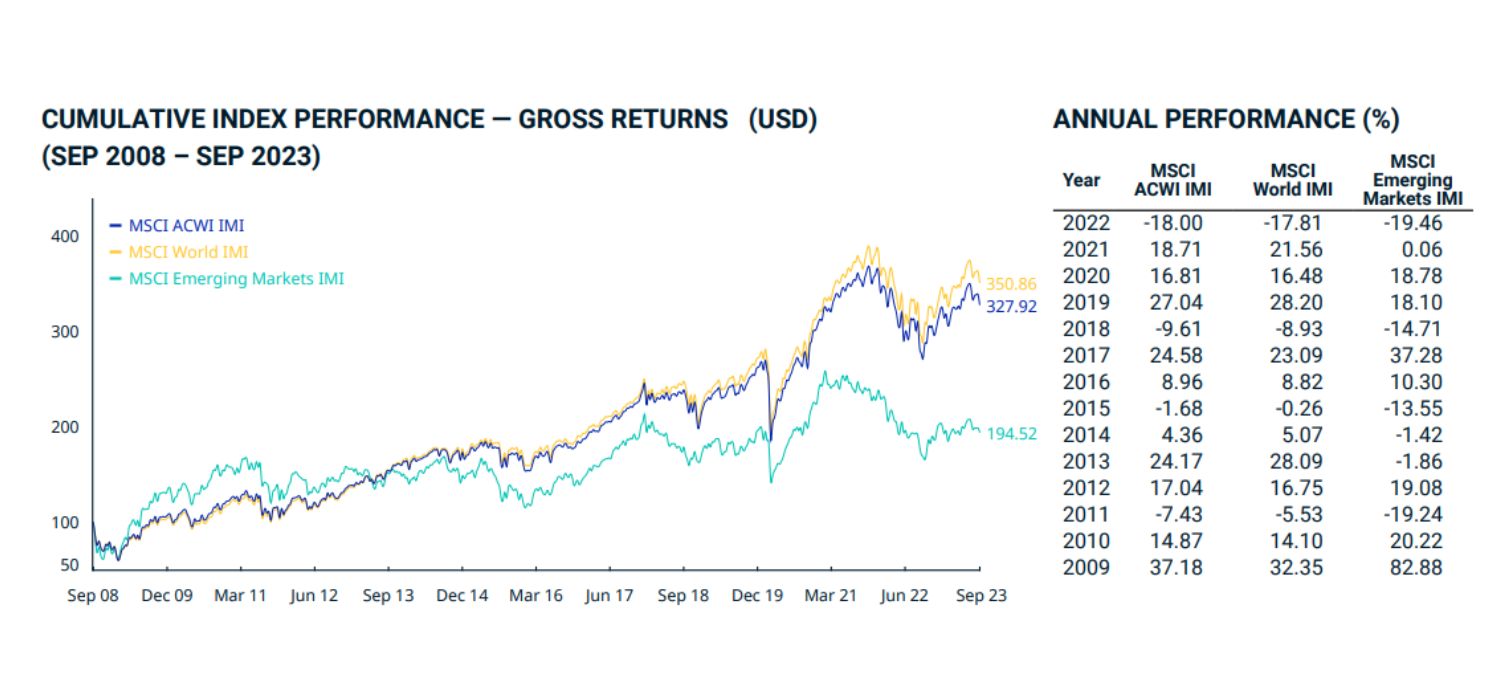
It’s important for investors to differentiate between daily point fluctuations and long-term trends. While daily news often focuses on dramatic point gains or losses, these short-term movements are often noise in the context of long-term investment goals. A 300-point drop in the Dow might be significant for day traders, but for a long-term investor, it might be a minor blip in a multi-year upward trend.
Point movements over extended periods, however, like month-to-month or year-to-year, reveal more meaningful trends about economic growth, market cycles, and overall investment returns. Analyzing point changes over time allows investors to identify sustained bull or bear markets, understand periods of consolidation, and gauge the market’s overall trajectory, which is far more relevant for strategic asset allocation and retirement planning than daily headlines.
Beyond the Basics: Advanced Considerations for Understanding Points
For those seeking a deeper understanding, there are additional nuances to consider when interpreting point movements in the stock market. These advanced considerations provide a more comprehensive view of how points are derived and what truly drives them.
Market Capitalization and Index Weighting
The composition and weighting method of an index significantly affect how its points move. As mentioned, the DJIA is price-weighted, meaning stocks with higher per-share prices have a greater influence. A large dollar change in a high-priced Dow stock will move the index by more points than the same dollar change in a lower-priced stock.
In contrast, market-capitalization-weighted indices like the S&P 500 are influenced more by the total value of a company’s outstanding shares. A small percentage change in a mega-cap stock (e.g., Apple, Microsoft) can translate into a substantial point movement for the S&P 500 because of its immense market capitalization. Understanding the weighting methodology of an index is crucial for discerning which companies or sectors are driving its point changes. This insight can help investors analyze whether market gains are broad-based or concentrated in a few large players.
The Influence of Economic News and Events
Point movements in major indices are rarely random. They are often a direct response to a constant flow of economic data, corporate earnings reports, geopolitical developments, and central bank announcements. Positive economic news (e.g., strong jobs report, lower inflation) tends to lead to point gains, as it suggests a healthy environment for corporate profits. Conversely, negative news (e.g., rising interest rates, trade tensions) can trigger significant point losses, reflecting investor concerns about future earnings and economic stability.
Understanding the direct link between significant news events and subsequent point movements is vital for any investor. It allows one to connect the dots between macro-economic indicators and their immediate impact on financial markets, providing context to daily volatility and long-term trends.
Points in Global Markets: A Universal Language
While our discussion has focused primarily on the U.S. market, the concept of a “point” is a universal measure in global stock markets. Major indices in Europe (e.g., Euro Stoxx 50, DAX 30), Asia (e.g., Nikkei 225, Hang Seng Index), and other regions also report their daily movements in points. This common terminology facilitates cross-border financial reporting and comparative analysis. An investor tracking global markets will find that whether they’re looking at the FTSE 100 in London or the Shanghai Composite in China, daily movements are quantified in points, albeit with different base values and underlying economic drivers. This global consistency underscores the fundamental utility of the “point” as a unit of measure for tracking the pulse of financial markets worldwide.

Conclusion
The term “point” in the stock market, initially seeming like an abstract piece of financial jargon, is in fact a crucial unit of measurement that allows investors and analysts to quantify and communicate market changes with precision. While for individual stocks a point often equates to a dollar, its true significance shines when discussing stock market indices. Here, a point represents a specific increment in the index’s calculated value, offering a quick, albeit context-dependent, gauge of market movement.
Understanding the distinction between points and percentages, appreciating the unique calculation methodologies of indices like the DJIA and S&P 500, and recognizing the interplay between economic events and market point swings are all essential components of financial literacy. By moving beyond a superficial understanding, investors can interpret market news more effectively, discern patterns, and ultimately make more informed decisions about their portfolios. The stock market is a complex ecosystem, but by mastering its fundamental language, including the meaning of a “point,” you gain a powerful tool for navigating its intricate landscape.
aViewFromTheCave is a participant in the Amazon Services LLC Associates Program, an affiliate advertising program designed to provide a means for sites to earn advertising fees by advertising and linking to Amazon.com. Amazon, the Amazon logo, AmazonSupply, and the AmazonSupply logo are trademarks of Amazon.com, Inc. or its affiliates. As an Amazon Associate we earn affiliate commissions from qualifying purchases.